The Insurance Policy Analytics Dashboard in Google Sheets tracks 5 KPIs across 7 interactive pages, with 14+ pre-built charts and multiple slicers for instant filtering. Setup takes under 10 minutes — just replace the sample data and every dashboard page updates automatically.
🌍 Join 8,400+ teams in 40+ countries using NextGenTemplates to replace paid SaaS tools with one-time-purchase Excel, Google Sheets, Power BI, and HTML templates.Insurance Policy Analytics Dashboard in Google Sheets
✅ Instant download · One-time payment · No subscription · No per-user fees · Lifetime access
🔑 Key Features of Insurance Policy Analytics Dashboard in Google Sheets
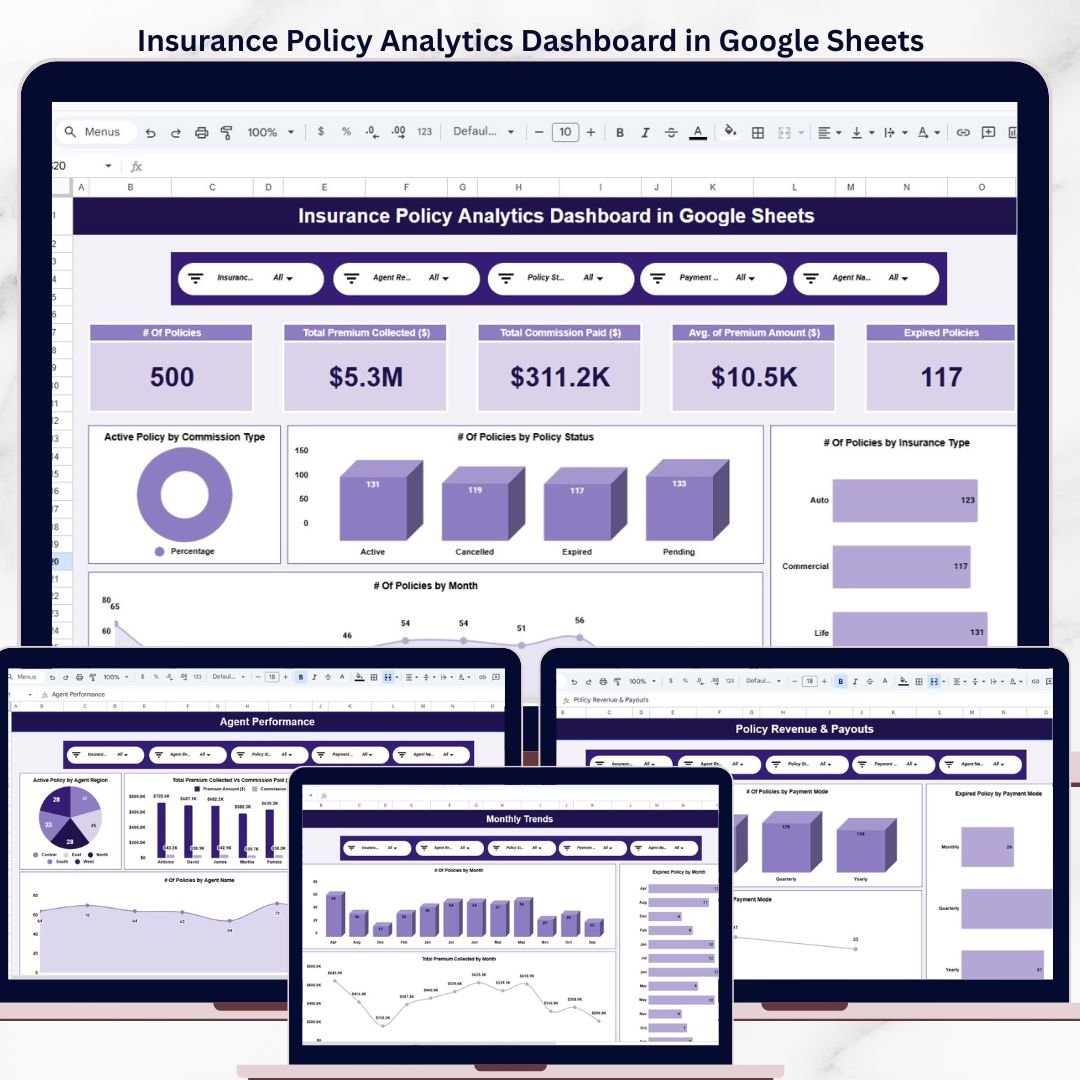
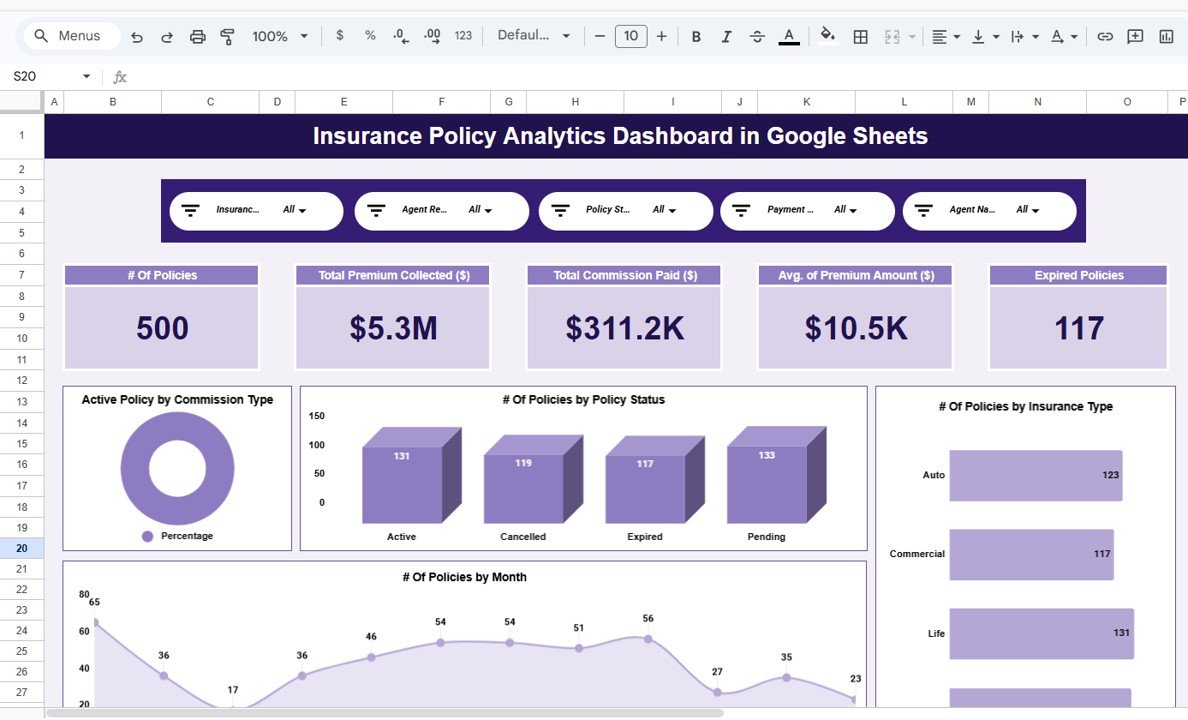
This dashboard tracks 5 key performance indicators including total policies issued, total premium collected, total commission paid, average premium amount, and expired policy count. Each metric is displayed as a KPI card on the Overview page and updates instantly when you filter data using the built-in slicers.Insurance Policy Analytics Dashboard in Google Sheets
📊 The template includes 14+ charts spread across 5 analysis pages — Overview, Commission Analysis, Agent Performance, Policy Revenue & Payouts, and Monthly Trends. Every chart follows the format “{Metric} by {Category}” so you can quickly spot patterns in policy distribution, agent workload, premium revenue, and seasonal trends.Insurance Policy Analytics Dashboard in Google Sheets
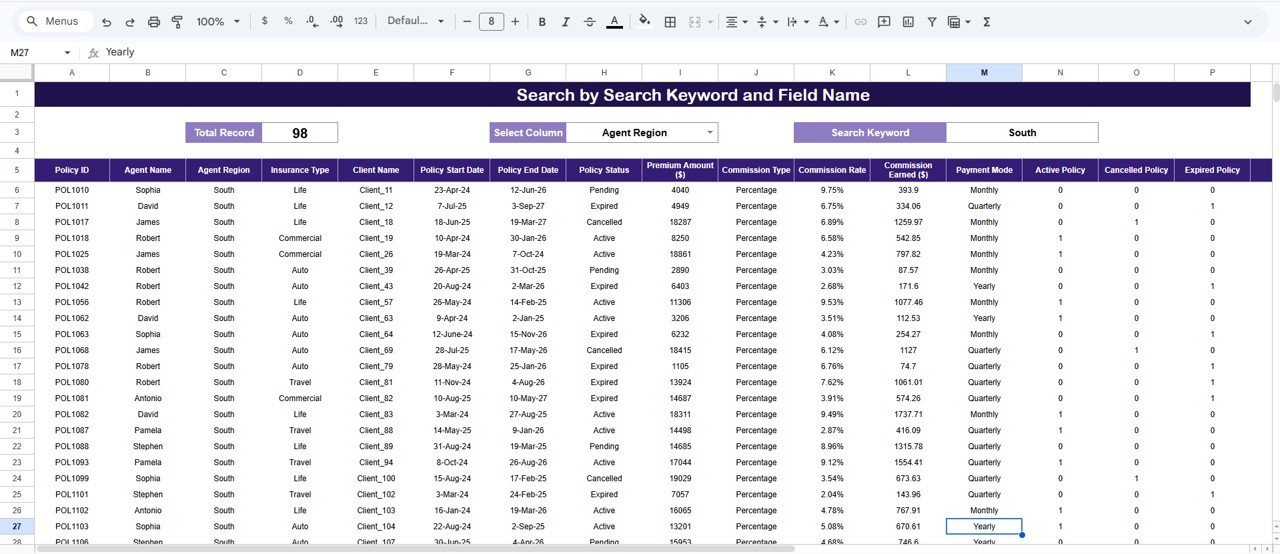
🔍 A dedicated Search Sheet lets you find any policy record instantly by selecting a column name and typing a search keyword. The total record count and a filtered list of matching policies appear immediately — no formulas to write, no filters to set up manually.
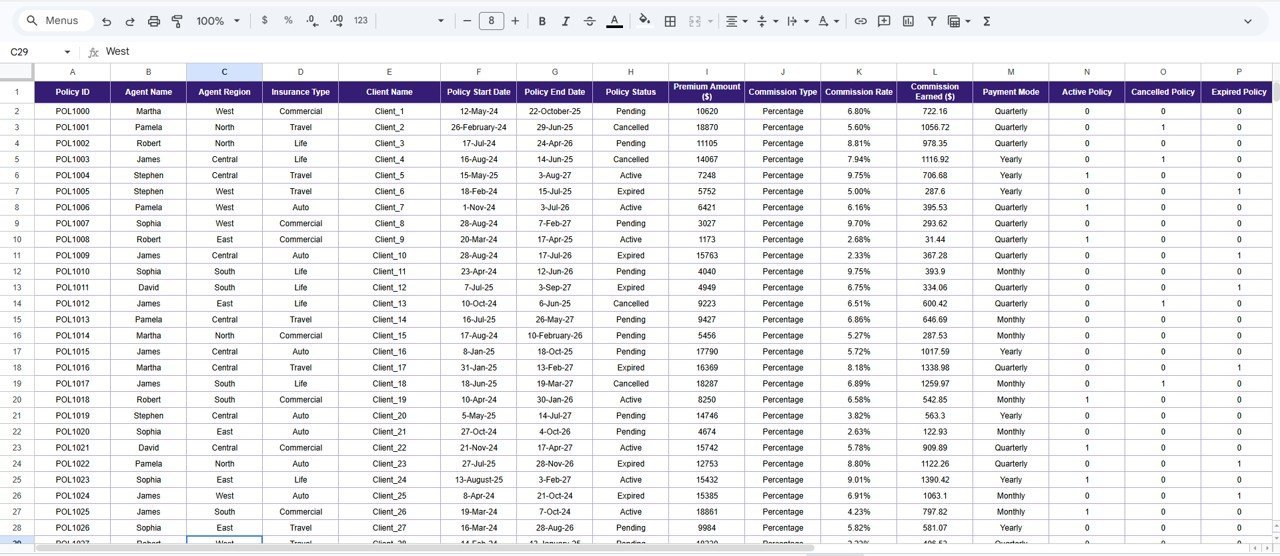
📂 The Data Sheet tab is where you enter your actual policy data. The sample dataset is pre-formatted so you can see exactly which columns are needed — just paste your own records in the same structure and every page recalculates automatically.Insurance Policy Analytics Dashboard in Google Sheets
📦 What’s Inside the Insurance Policy Analytics Dashboard
The dashboard contains 7 pages designed for end-to-end insurance policy monitoring:Insurance Policy Analytics Dashboard in Google Sheets
📌 Overview Page — Displays 5 KPI cards (# Of Policies, Total Premium Collected, Total Commission Paid, Avg. of Premium Amount, Expired Policies) alongside 4 charts: Active Policy by Commission Type, # Of Policies by Policy Status, # Of Policies by Insurance Type, and # Of Policies by Month. Multiple slicers let you filter the entire view in one click.
 Insurance Policy Analytics Dashboard in Google Sheets
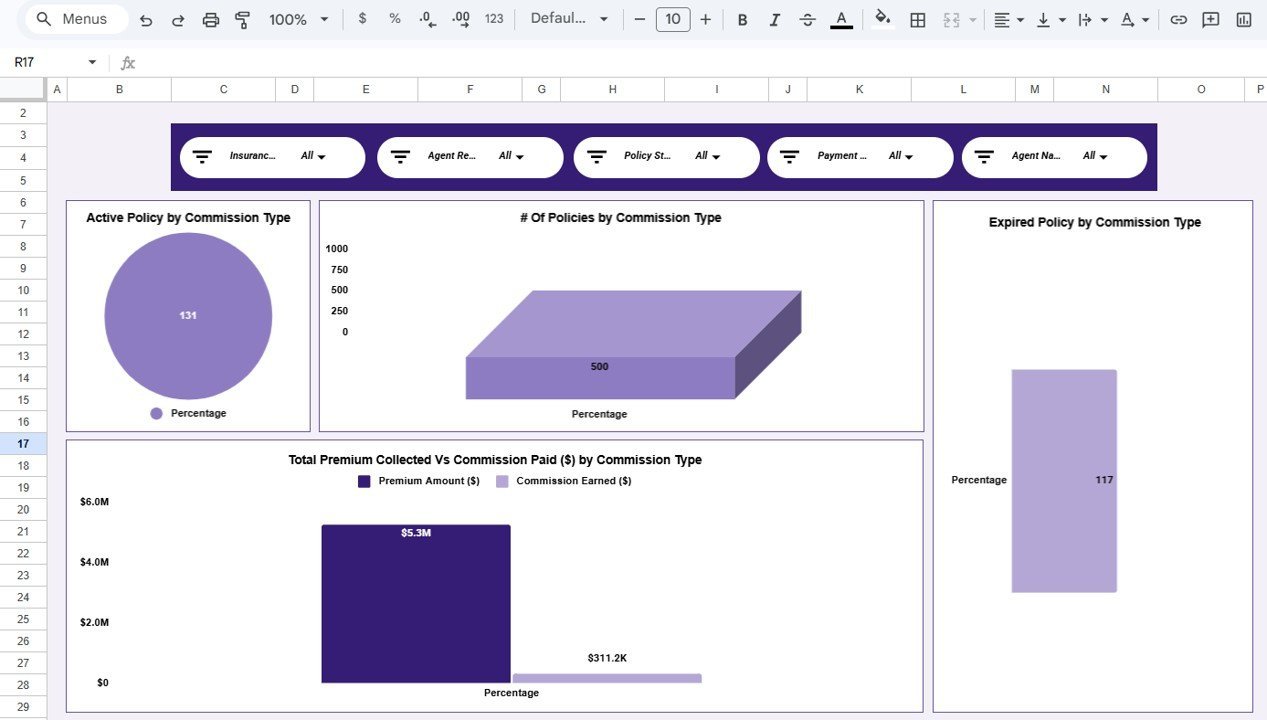
📌 Commission Analysis — Breaks down commission data with 4 charts: Active Policy by Commission Type, # Of Policies by Commission Type, Expired Policy by Commission Type, and Total Premium Collected Vs Commission Paid by Commission Type. Helps identify which commission structures drive the most premium and which have the highest expiration rates.
 Commission Analysis
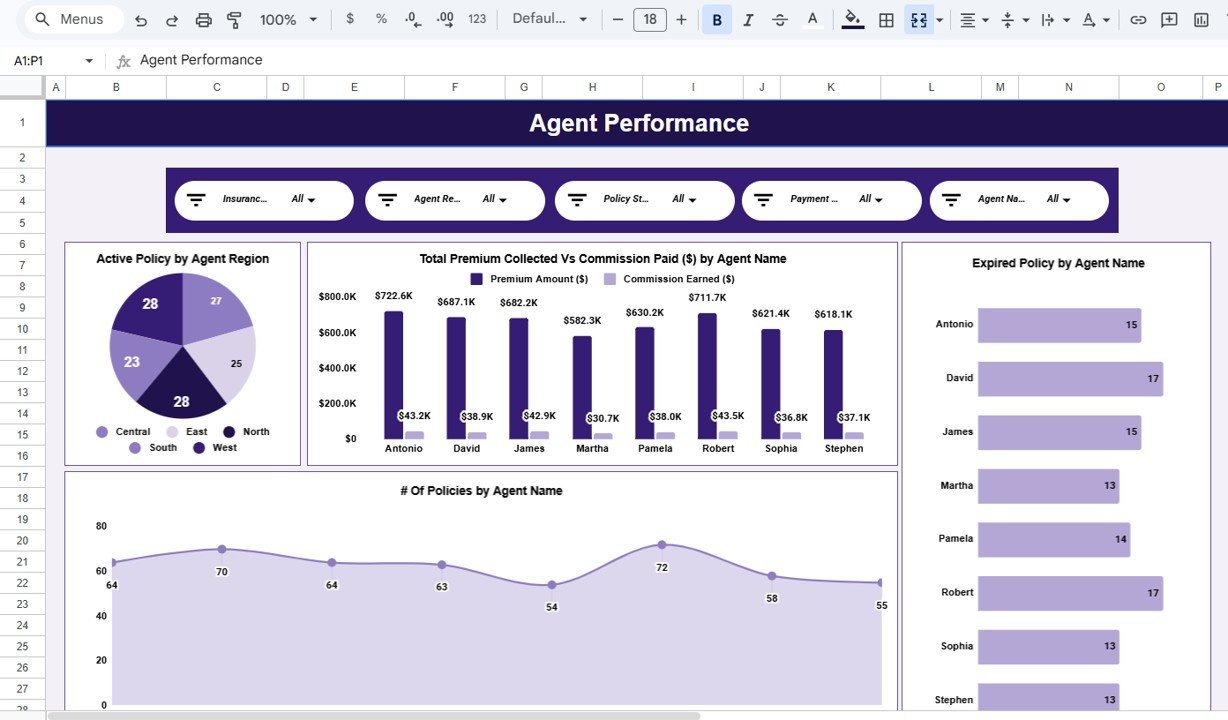
📌 Agent Performance — Tracks individual agent output with 4 charts: Active Policy by Agent Region, Total Premium Collected Vs Commission Paid by Agent Name, Expired Policy by Agent Name, and # Of Policies by Agent Name. Managers can pinpoint top performers and underperforming regions at a glance.
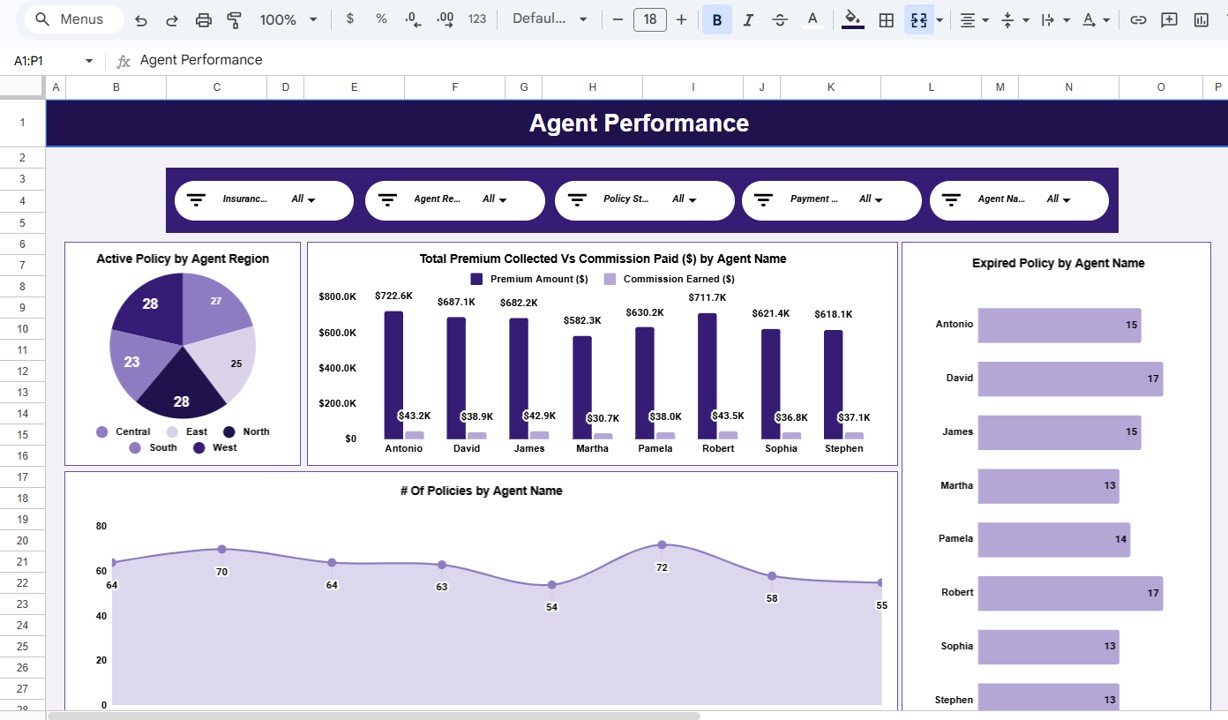 Agent Performance
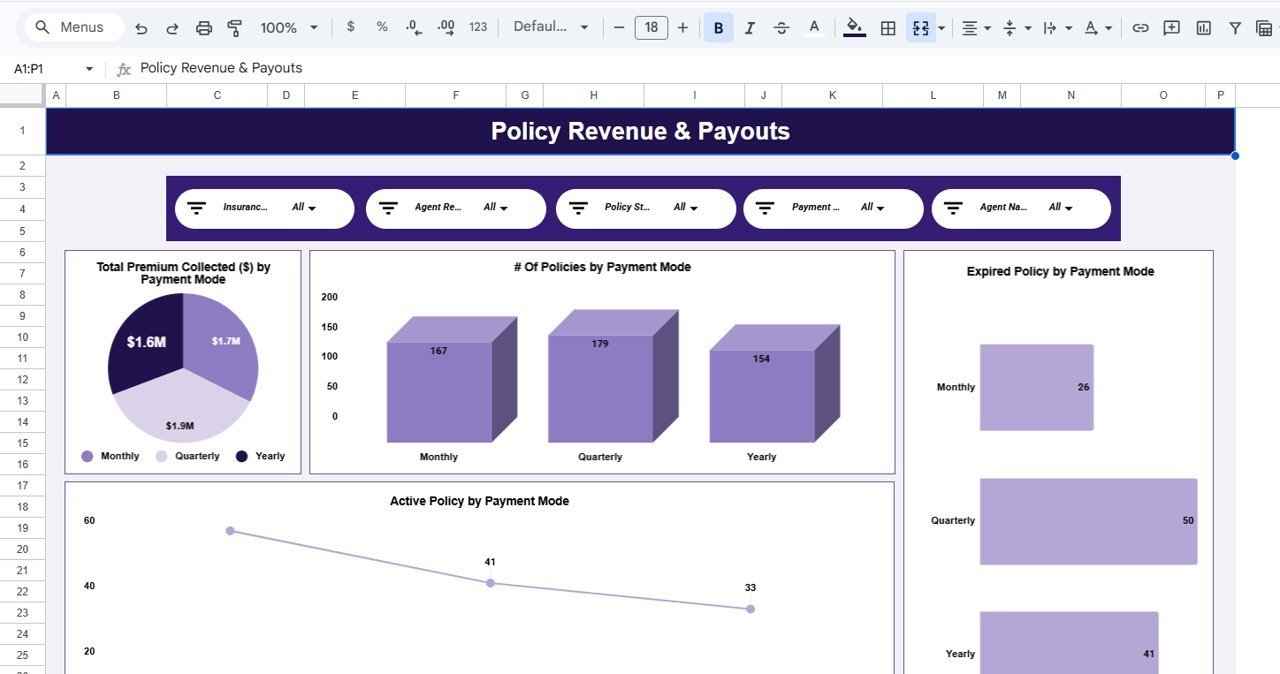
📌 Policy Revenue & Payouts — Analyzes payment patterns with 4 charts: Total Premium Collected by Payment Mode, # Of Policies by Payment Mode, Expired Policy by Payment Mode, and Active Policy by Payment Mode. Useful for understanding which payment channels generate the highest collections.
 Policy Revenue & Payouts
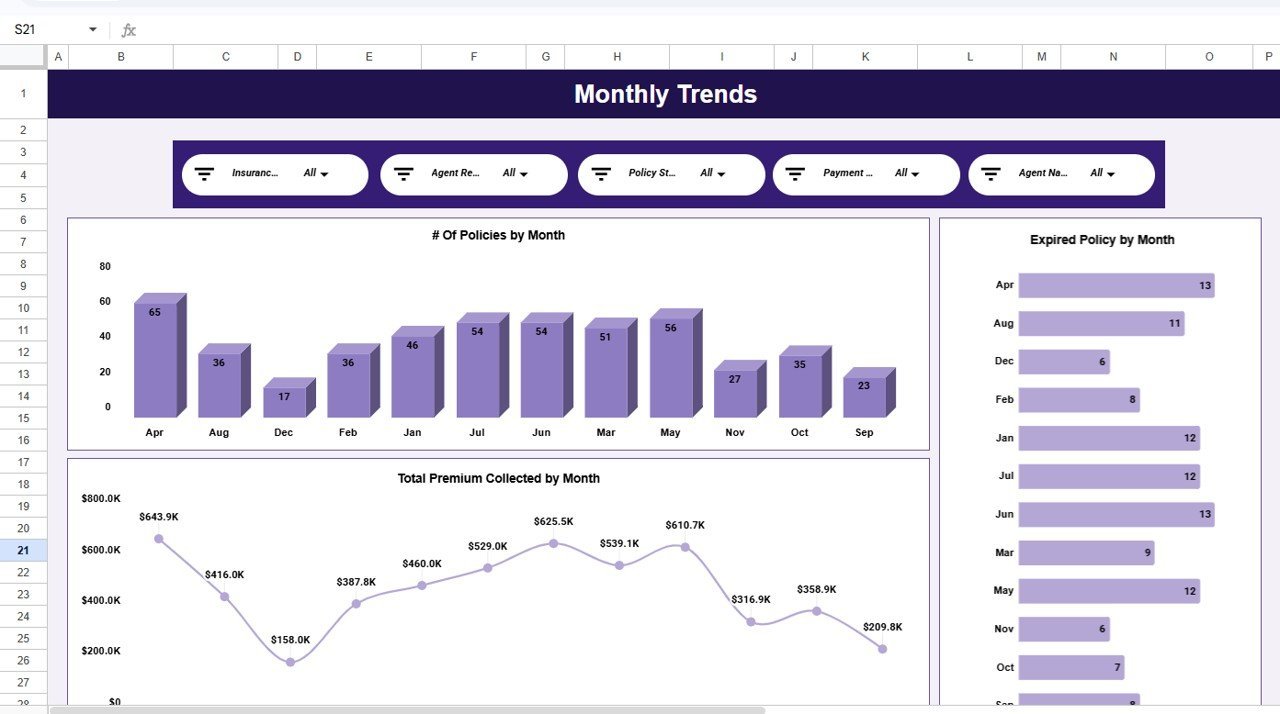
📌 Monthly Trends — Shows 3 time-based charts: # Of Policies by Month, Expired Policy by Month, and Total Premium Collected by Month. Spot seasonal spikes and plan renewal campaigns around expiration peaks.
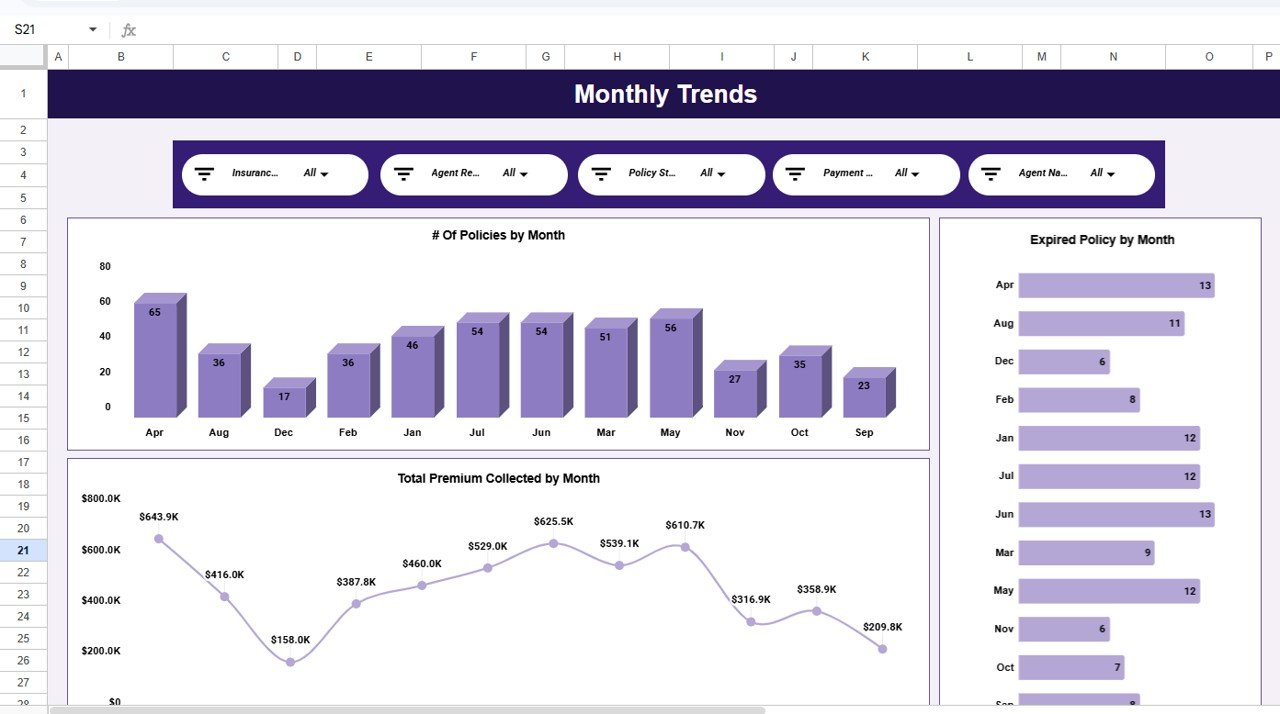 Monthly Trends
📌 Search Sheet — Select any column name, type a keyword, and instantly see the total record count plus a complete filtered list of matching policies.
 Search Sheet
📌 Data Sheet — Enter your policy records here in the pre-formatted structure. All dashboard pages pull from this single data source.
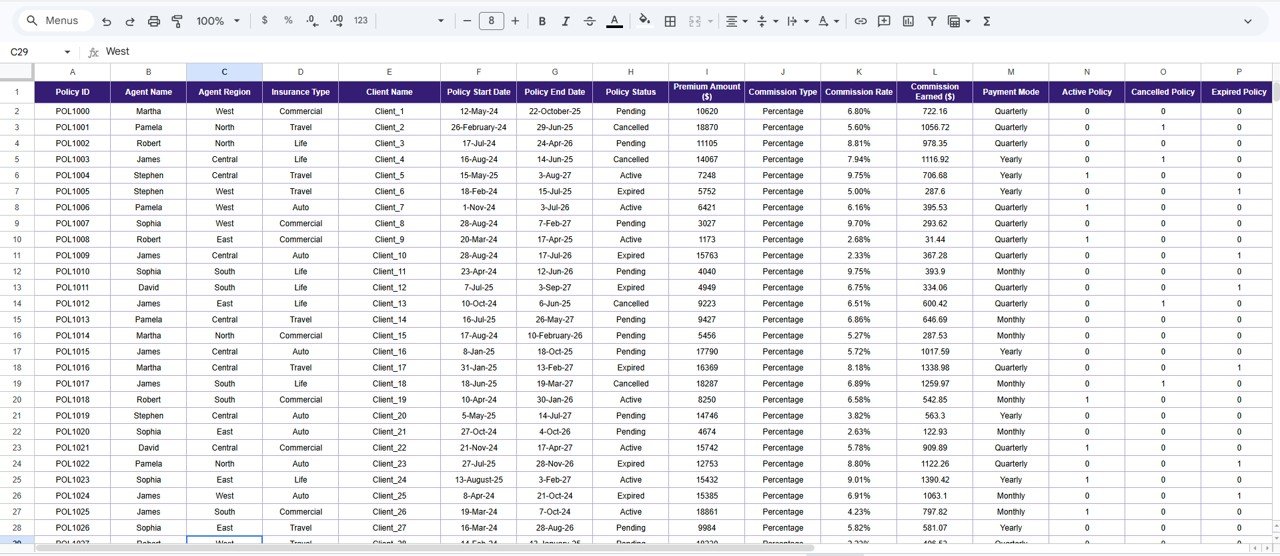 Data Sheet
📊 Insurance Policy Analytics Dashboard vs. Microsoft Excel Dashboard vs. Applied Epic — Where This Fits
| Feature | Insurance Policy Analytics Dashboard (Google Sheets) | Microsoft Excel Dashboard | Applied Epic / Vertafore |
|---|---|---|---|
| Cost | $9.99 one-time | $17.99+ one-time (separate purchase) | $150–$300/user/month |
| Platform | Google Sheets (browser-based) | Desktop Excel required | Cloud SaaS |
| Setup Time | Under 10 minutes | 10–15 minutes | 4–8 weeks implementation |
| Real-Time Collaboration | ✅ Built-in (Google Sheets) | Limited (OneDrive required) | ✅ Yes |
| Mobile Access | ✅ Any browser or Google Sheets app | Limited on mobile | ✅ Mobile app |
| Customizable Fields | ✅ Fully editable | ✅ Fully editable | Limited without IT support |
| Share via Link | ✅ One-click sharing | ❌ File attachment needed | ✅ Within platform |
| Year-1 Cost (5 Users) | $9.99 total | $17.99 total | $9,000–$18,000 |
| Commission Tracking | ✅ Built-in analysis page | ✅ With manual setup | ✅ Advanced automation |
For insurance teams that want policy analytics and commission tracking without paying enterprise SaaS fees, the Insurance Policy Analytics Dashboard in Google Sheets sits in the sweet spot.
👥 Who This Template Is For — and Who It’s Not For
✅ This template is built for:
- Independent insurance agents and brokers managing 50–5,000 policies
- Small to mid-size insurance agencies tracking agent performance and commissions
- Insurance operations managers who need monthly premium and expiration reports
- Financial analysts at insurance firms who want a visual policy overview without IT involvement
❌ This template is NOT for:
- Large carriers needing API integrations with claims processing systems
- Agencies requiring automated policy binding or compliance workflows
- Teams needing multi-currency or multi-country regulatory reporting
⚙️ How to Use the Insurance Policy Analytics Dashboard
1️⃣ Open the Google Sheets link from the PDF guide included in your download and click “Make a Copy” to save it to your Google Drive.
2️⃣ Go to the Data Sheet tab and replace the sample policy records with your own data, keeping the same column structure.
3️⃣ Navigate to the Overview page to see all 5 KPI cards and 4 charts update automatically with your data.
4️⃣ Use the built-in slicers to filter by insurance type, agent region, commission type, or date range across all dashboard pages.
5️⃣ Explore the analysis pages — Commission Analysis, Agent Performance, Policy Revenue & Payouts, and Monthly Trends for deeper insights.
6️⃣ Use the Search Sheet to find specific policy records instantly by selecting a column and typing a keyword.
💼 Real-World Use Cases
Rajesh manages an insurance brokerage with 12 agents in Mumbai. He uses the Insurance Policy Analytics Dashboard to track which agents bring in the most premium revenue, compare commission payouts across flat-rate and percentage-based structures, and identify months with the highest policy expirations so his team can launch targeted renewal campaigns — all without paying for Applied Epic.
Lisa runs operations at a 200-policy independent agency in Texas. She replaced three separate spreadsheets with this single dashboard. Now she monitors active vs expired policies, compares payment modes, and generates monthly trend reports for her agency owner in under 5 minutes — saving roughly 4 hours per week compared to manual tracking.
Ahmed is a freelance insurance consultant in Dubai. He uses the dashboard to present policy analytics to his clients during quarterly reviews. The built-in charts and slicer filters let him customize views per client without rebuilding reports from scratch each time.
❓ Frequently Asked Questions
What KPIs does the Insurance Policy Analytics Dashboard track?
The Insurance Policy Analytics Dashboard tracks 5 key performance indicators: total number of policies, total premium collected, total commission paid, average premium amount, and expired policy count. All metrics update automatically when you add your own data to the Data Sheet.
How many charts are included in this dashboard?
The dashboard includes 14+ charts spread across 5 analysis pages — Overview, Commission Analysis, Agent Performance, Policy Revenue & Payouts, and Monthly Trends. Each chart visualizes a different aspect of your insurance portfolio.
Can I filter the dashboard by insurance type or agent?
Yes. The dashboard includes built-in slicers on the Overview page that let you filter all KPIs and charts by insurance type, agent region, commission type, policy status, and date range — no formulas needed.
How does this compare to Applied Epic or Vertafore?
Applied Epic costs $150–$300 per user per month and requires weeks of implementation. The Insurance Policy Analytics Dashboard costs $9.99 one-time, sets up in under 10 minutes, and covers the core analytics most small agencies need — without contracts or per-user fees.
Does this work on mobile devices?
Yes. Google Sheets runs in any modern browser and has a dedicated mobile app for iOS and Android. You can view and filter the dashboard from your phone or tablet.
How long does setup take?
Setup takes under 10 minutes. Open the Google Sheets copy link, click “Make a Copy,” paste your policy data into the Data Sheet tab, and every chart and KPI card updates automatically.
Can I add more data columns to the Data Sheet?
The Data Sheet is fully editable. You can add extra columns for your own reference. However, the dashboard charts and KPIs are linked to the existing column structure, so keep the original columns intact for automatic updates.
👤 About the Author
Built by PK — Microsoft Certified Professional with 15+ years of Excel, Google Sheets, and Power BI experience. Founder of NextGenTemplates, reaching 300K+ subscribers across YouTube channels (@PK-AnExcelExpert, @NextGenTemplates, @NeoTechNavigators). Every template is hand-built and tested before release.
🔗 Explore Related Templates
📌 Insurance Agency Dashboard in Google Sheets — Track agency-level operations, claims, and client metrics.
📌 Insurance KPI Scorecard in Google Sheets — Monitor target vs actual KPIs with traffic-light indicators.
📌 Insurance Brokers Dashboard in Google Sheets — Analyze broker-level performance and client portfolios.
📌 Also available as: Excel version | Power BI version | HTML version
👉 Browse all Google Sheets Dashboard Templates
📖 Click here to read the Detailed Blog Post
Watch the step-by-step video tutorial:
🎥 Visit our YouTube channel for step-by-step video tutorials
👉 YouTube.com/@NextGenTemplates


Reviews
There are no reviews yet.