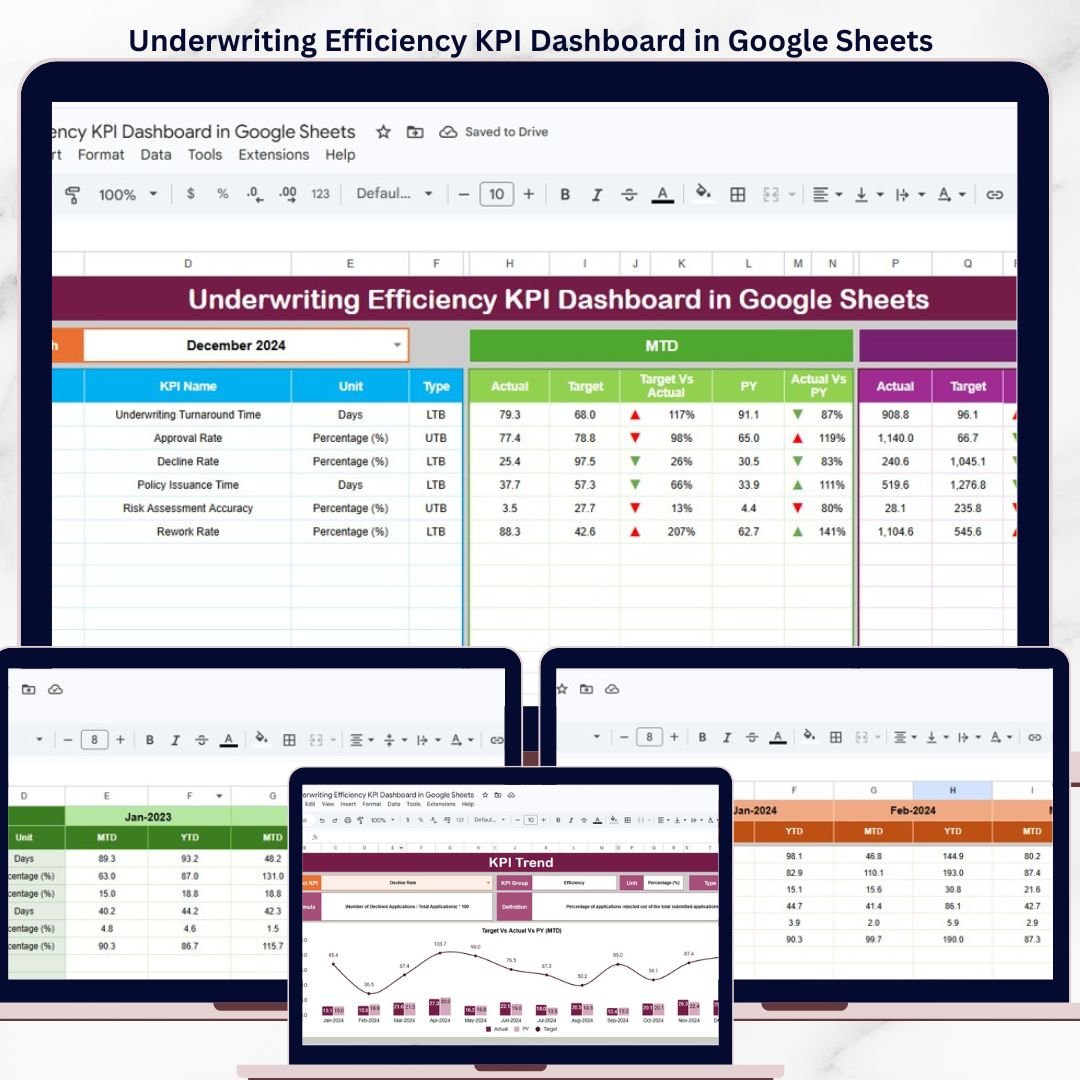

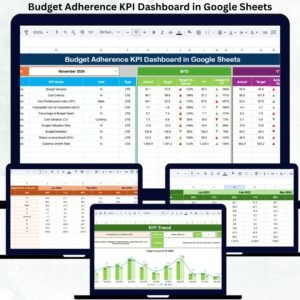
The Underwriting Efficiency KPI Dashboard in Google Sheets tracks 15+ underwriting KPIs across 6 interactive worksheets, with MTD and YTD trend charts, conditional formatting arrows, and month-based filtering. Setup takes under 10 minutes — just replace the sample data and every metric updates automatically.
🌍 Join 8,400+ teams in 40+ countries using NextGenTemplates to replace paid SaaS tools with one-time-purchase Excel, Google Sheets, Power BI, and HTML templates.
✅ Instant download · One-time payment · No subscription · No per-user fees · Lifetime access
🔑 Key Features of Underwriting Efficiency KPI Dashboard in Google Sheets
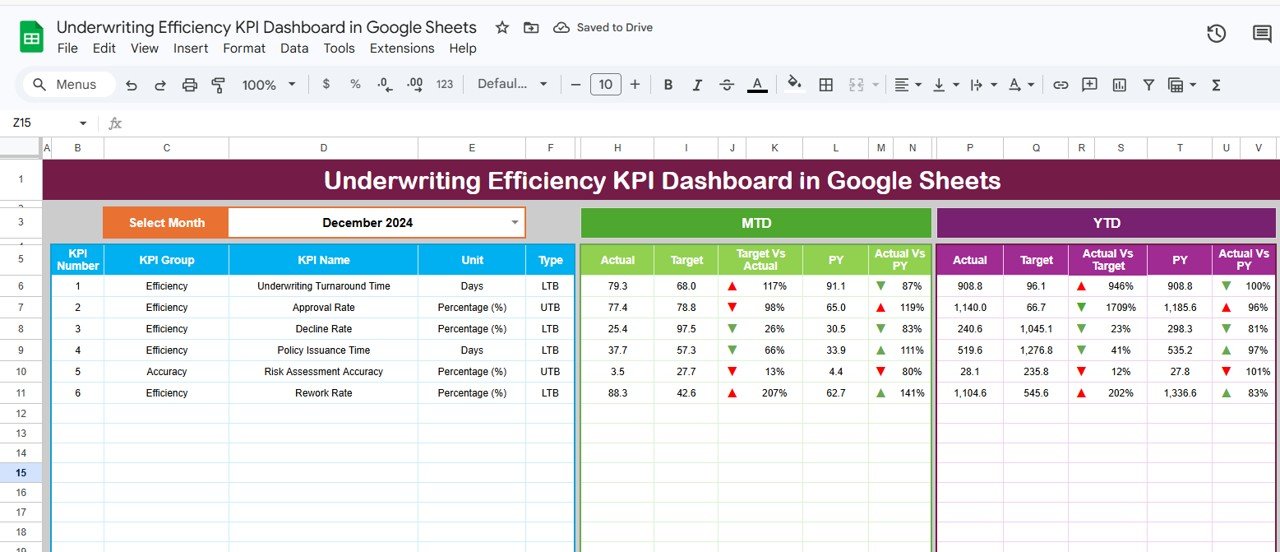
📌 Month-Based Dynamic Filtering – Select any month from a dropdown on cell D3 and the entire dashboard refreshes MTD Actual, Target, Previous Year, YTD Actual, Target, and PY numbers instantly.Underwriting Efficiency KPI Dashboard in Google Sheets
📌 Conditional Formatting Arrows – Every KPI row displays up/down arrows comparing Target vs Actual and Previous Year vs Actual, giving instant visual cues on performance direction.Underwriting Efficiency KPI Dashboard in Google Sheets
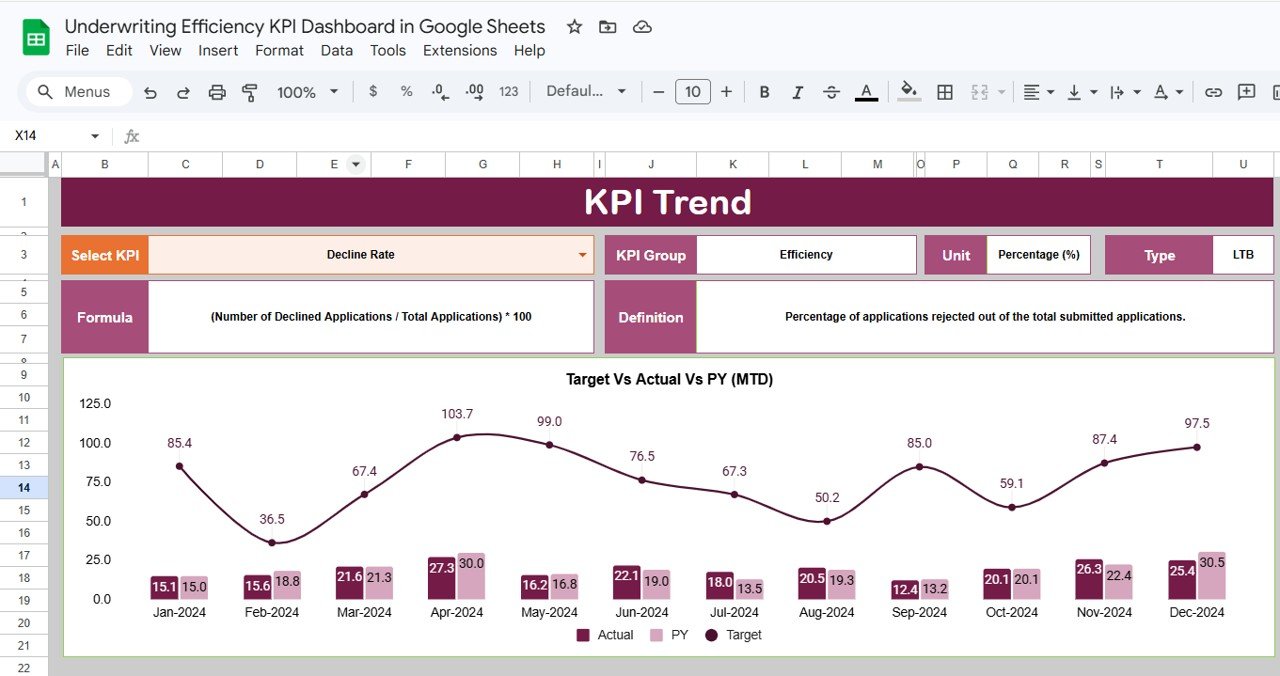
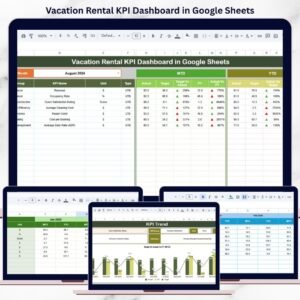
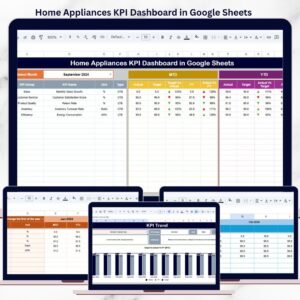
📌 MTD and YTD Trend Charts – The KPI Trend sheet plots monthly trend lines for Actual, Target, and Previous Year side by side, so you can spot underwriting performance shifts across the fiscal year.Underwriting Efficiency KPI Dashboard in Google Sheets
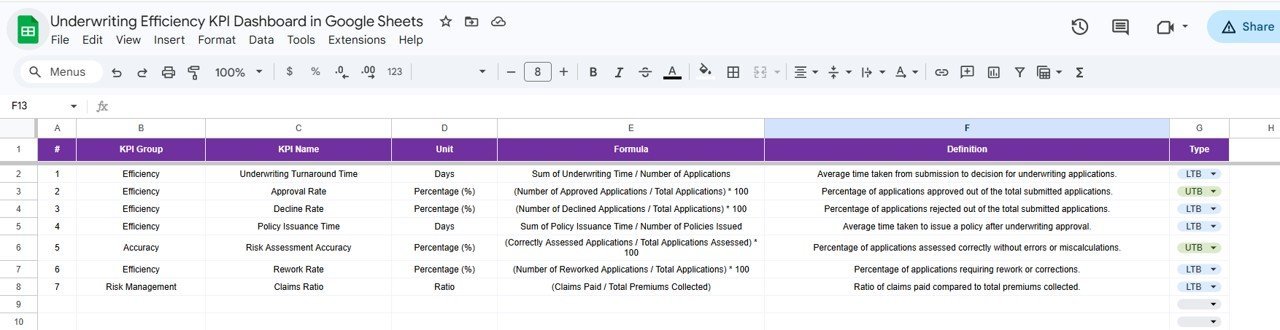
📌 KPI Definition Library – Each metric includes its KPI Group, Unit, Formula, Definition, and Type (Lower the Better or Upper the Better), making interpretation clear for every team member.Underwriting Efficiency KPI Dashboard in Google Sheets
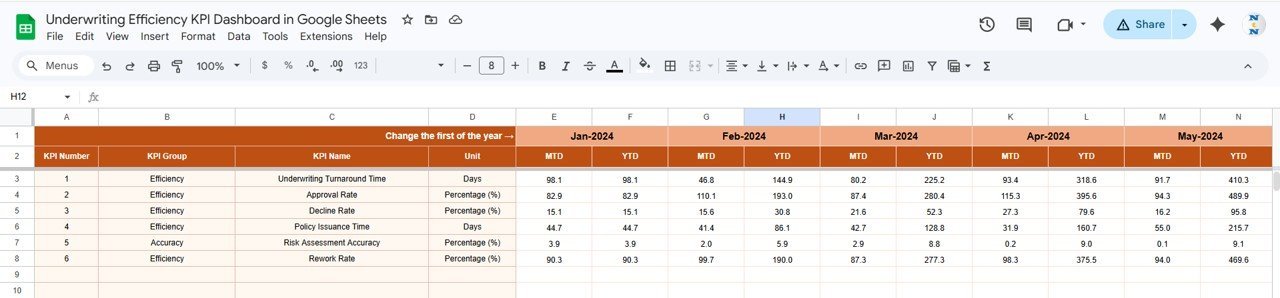
📌 Separate Input Sheets for Actual, Target, and Previous Year – Three dedicated input tabs keep data entry organized and error-free. Change the first month of the year on cell E1 to align with your fiscal calendar.Underwriting Efficiency KPI Dashboard in Google Sheets
📌 Real-Time Google Sheets Collaboration – Share the dashboard with underwriters, actuaries, and managers. Everyone sees live updates without emailing spreadsheet versions.
📌 No Macros, No Add-ons – Built entirely with native Google Sheets formulas and charts. Works on any device with a browser.
Underwriting Efficiency KPI Dashboard in Google Sheets
📦 What’s Inside the Underwriting Efficiency KPI Dashboard
This template includes 6 worksheets designed for insurance underwriting teams:
📊 Dashboard Sheet – The main view showing all KPIs with MTD Actual, Target, Previous Year, YTD Actual, Target, and PY columns. Select any month from the dropdown on D3 and all numbers update. Conditional formatting arrows highlight Target vs Actual and PY vs Actual variances.
📈 KPI Trend Sheet – Select any KPI from the dropdown on C3. View its KPI Group, Unit, Type (LTB/UTB), Formula, and Definition. MTD and YTD trend charts plot Actual, Target, and Previous Year lines for full-year visibility.
KPI Trend Sheet
📝 Actual Numbers Input Sheet – Enter MTD and YTD actual numbers for each month. Change the starting month on cell E1 to match your fiscal year.
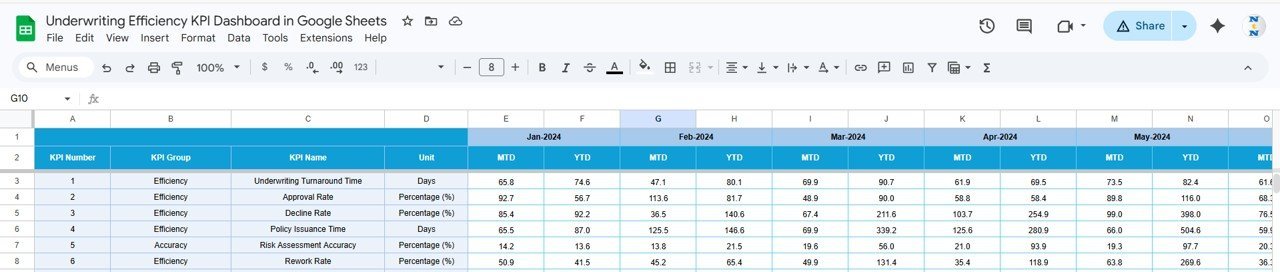
🎯 Target Number Input Sheet – Enter MTD and YTD target numbers for each KPI for every month of the year.
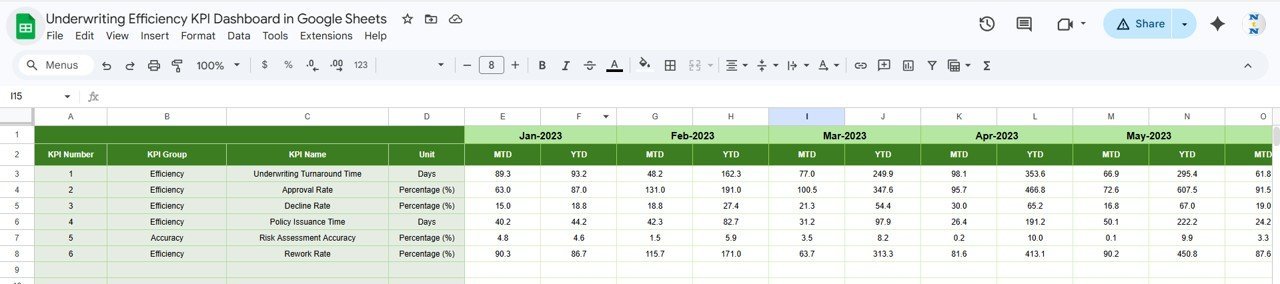
📅 Previous Year Number Sheet – Enter previous year numbers in the same format to enable year-over-year comparisons.
📋 KPI Definition Sheet – Define each KPI Name, KPI Group, Unit, Formula, Definition, and Type (LTB or UTB). This sheet feeds the KPI Trend page with metadata.
📊 Underwriting Efficiency KPI Dashboard vs. Microsoft Excel Dashboard vs. Guidewire InsuranceSuite — Where This Fits
| Feature | Underwriting Efficiency KPI Dashboard (Google Sheets) | Microsoft Excel Dashboard | Guidewire InsuranceSuite |
|---|---|---|---|
| Cost | $8.99 one-time | Requires Excel license ($6.99+/mo) | $50,000+ annual enterprise license |
| Platform | Google Sheets (browser-based) | Desktop application | Cloud enterprise platform |
| Setup Time | Under 10 minutes ✅ | 30-60 minutes | 6-12 months implementation |
| Real-Time Team Collaboration | Yes — live multi-user editing ✅ | Limited (OneDrive co-authoring) | Yes |
| Mobile Access | Yes — Google Sheets app ✅ | Limited on mobile | Yes (enterprise app) |
| Customizable KPIs | Yes — add/edit any KPI ✅ | Yes (manual formula edits) | Requires IT configuration |
| Share with Link | One click ✅ | Email attachment or OneDrive | Role-based portal access |
| Year-1 Cost at 5 Users | $8.99 total ✅ | $420+ (5 × $6.99/mo × 12) | $50,000+ |
| Underwriting-Specific KPI Library | Yes — pre-built definitions ✅ | Build from scratch | Yes (enterprise-grade) |
For insurance teams that want underwriting KPI tracking without enterprise software costs, the Underwriting Efficiency KPI Dashboard in Google Sheets sits in the sweet spot.
👥 Who This Template Is For — and Who It’s Not For
✅ This template is built for:
- Underwriting managers at small to mid-size insurance companies (10-500 employees) tracking team performance monthly
- Insurance operations leads who report underwriting KPIs to leadership quarterly
- Actuarial analysts comparing actual underwriting results against targets and previous year benchmarks
- Insurance startups and MGAs needing a KPI framework without paying for Guidewire or Duck Creek
❌ This template is NOT for:
- Enterprise insurers needing API integration with policy administration systems like Guidewire or Majesco
- Teams requiring real-time automated data feeds from underwriting platforms
- Organizations needing SOC 2 compliance and audit trails on KPI data entry
⚙️ How to Use the Underwriting Efficiency KPI Dashboard
1️⃣ Make a Copy – Click the Google Sheets link from your download PDF to create your own editable copy in Google Drive.
2️⃣ Define Your KPIs – Go to the KPI Definition sheet. Enter your KPI names, groups, units, formulas, definitions, and type (LTB or UTB).
3️⃣ Enter Target Numbers – Open the Target Number Input sheet and fill in MTD and YTD targets for each KPI across all 12 months.
4️⃣ Enter Actual Numbers – Open the Actual Numbers Input sheet and enter your MTD and YTD actual figures as each month closes.
5️⃣ Enter Previous Year Data – Fill the Previous Year Number sheet with last year’s figures to enable year-over-year comparisons.
6️⃣ View the Dashboard – Go to the Dashboard sheet, select a month from the dropdown on D3, and review all KPIs with conditional formatting arrows.
7️⃣ Analyze Trends – Open the KPI Trend sheet, select any KPI from the dropdown on C3, and review MTD/YTD trend charts comparing Actual, Target, and Previous Year.
💼 Real-World Use Cases
David manages underwriting at a regional property insurer with 45 employees. He uses the Underwriting Efficiency KPI Dashboard to track loss ratios, quote-to-bind ratios, and average premium per policy monthly. Every quarter, he presents YTD trends to the CEO — without paying for Guidewire analytics or building custom Power BI reports.
Priya leads operations at an MGA handling specialty lines. Her team of 8 underwriters enters actual numbers weekly. She uses the conditional formatting arrows to spot which KPIs are falling below target mid-month and adjusts workflow assignments before the gap widens.
Carlos is an actuarial analyst at a health insurance startup. He uses the KPI Definition sheet to document each metric’s formula and type (LTB/UTB), ensuring every underwriter interprets loss ratios and expense ratios consistently across the team.
❓ Frequently Asked Questions
What KPIs does the Underwriting Efficiency KPI Dashboard track?
The Underwriting Efficiency KPI Dashboard tracks 15+ underwriting metrics including loss ratio, combined ratio, quote-to-bind ratio, average premium, expense ratio, and policy retention rate. All KPIs update automatically when you replace sample data with your own numbers.
Can I add custom KPIs to this template?
Yes. Open the KPI Definition sheet and add any new KPI with its name, group, unit, formula, definition, and type. The Dashboard and KPI Trend sheets will pick up the new metric automatically.
Does this work on Google Sheets mobile app?
Yes. The Underwriting Efficiency KPI Dashboard works on the Google Sheets mobile app for iOS and Android. You can view KPIs, check trends, and even enter actual numbers directly from your phone or tablet.
How does this compare to Guidewire InsuranceSuite analytics?
Guidewire costs $50,000+ annually and requires months of implementation. The Underwriting Efficiency KPI Dashboard in Google Sheets costs $8.99 one-time, sets up in under 10 minutes, and covers the same core KPI tracking for small to mid-size insurance teams.
Can multiple team members edit this at the same time?
Yes. Google Sheets supports real-time multi-user editing. Your underwriting team, actuarial analysts, and managers can all work in the same dashboard simultaneously without file conflicts.
How long does setup take?
Setup takes under 10 minutes. Make a copy in Google Drive, define your KPIs in the KPI Definition sheet, enter your target and actual numbers, and the Dashboard sheet displays your underwriting performance instantly.
Is there a money-back guarantee?
NextGenTemplates offers a satisfaction guarantee on all templates. If the dashboard does not meet your underwriting tracking needs, contact support within 7 days of purchase for assistance.
👤 About the Author
Built by PK — Microsoft Certified Professional with 15+ years of Excel, Google Sheets, and Power BI experience. Founder of NextGenTemplates, reaching 300K+ subscribers across YouTube channels (@PK-AnExcelExpert, @NextGenTemplates, @NeoTechNavigators). Every template is hand-built and tested before release.
🔗 Explore Related Templates
📌 Policy Performance and Risk Analysis Dashboard in Google Sheets – Track policy performance, risk exposure, and financial metrics across your insurance portfolio.
📌 Insurance KPI Scorecard in Google Sheets – A traffic-light scorecard format for monitoring insurance KPIs with actual vs target comparisons.
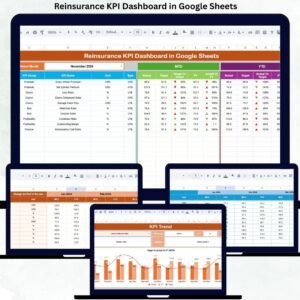
📌 Reinsurance KPI Dashboard in Google Sheets – Specialized KPI tracking for reinsurance operations including ceded premium ratios and treaty performance.
📌 Health Insurance Dashboard in Excel – Also available in Excel for teams preferring desktop-based analytics.
📌 Browse all Google Sheets Dashboard Templates on NextGenTemplates.
📖 Click here to read the Detailed Blog Post
🎥 Visit our YouTube channel for step-by-step video tutorials
👉 YouTube.com/@NextGenTemplates


Reviews
There are no reviews yet.