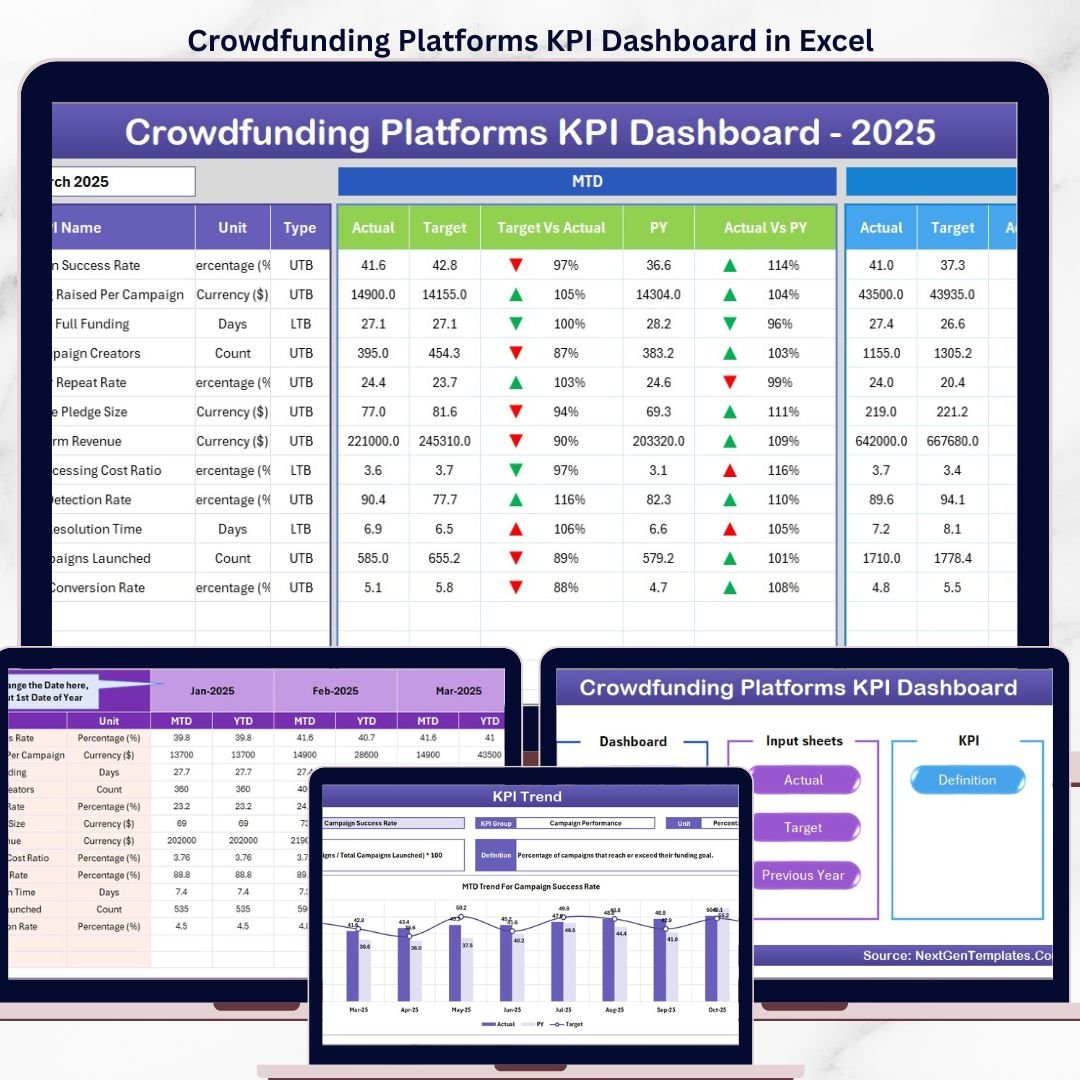

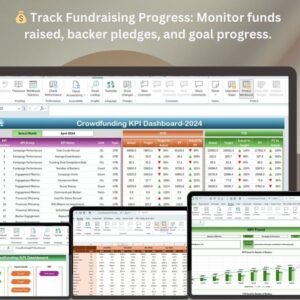
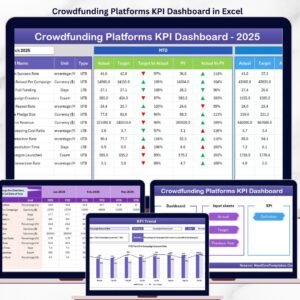
The Crowdfunding Platforms KPI Dashboard in Excel tracks crowdfunding campaign performance across 7 structured worksheets, with MTD and YTD comparisons against targets and previous-year data. Every metric updates automatically when you select a month from the dropdown — setup takes under 10 minutes. Just replace the sample data and the entire dashboard recalculates on its own.Crowdfunding Platforms KPI Dashboard in Excel
🌍 Join 8,400+ teams across 40+ countries using NextGenTemplates to monitor campaign health, backer growth, pledge conversion, and funding velocity without paying $29–$99/month for SaaS analytics tools like Fundly Pro, BackerKit Analytics, or Kickstarter Dashboard subscriptions.
✅ Instant download · One-time payment · No subscription · No per-user fees · Lifetime access
🔑 Key Features of Crowdfunding Platforms KPI Dashboard in Excel
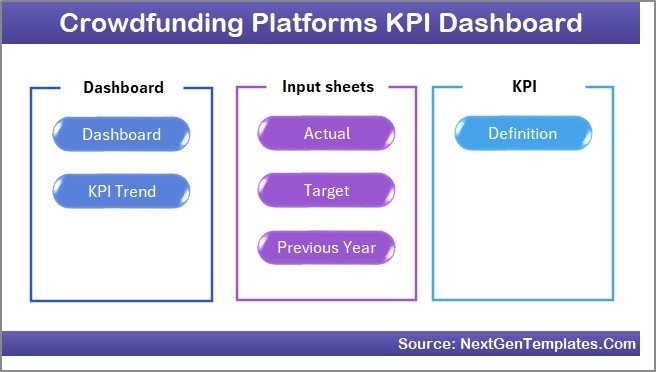
📌 7 Ready-to-Use Worksheets – Home, Dashboard, KPI Trend, Actual Numbers Input, Target Number Input, Previous Year Numbers, and KPI Definition. The Crowdfunding Platforms KPI Dashboard in Excel gives campaign managers a single workbook to enter, track, and visualize every fundraising metric month by month.
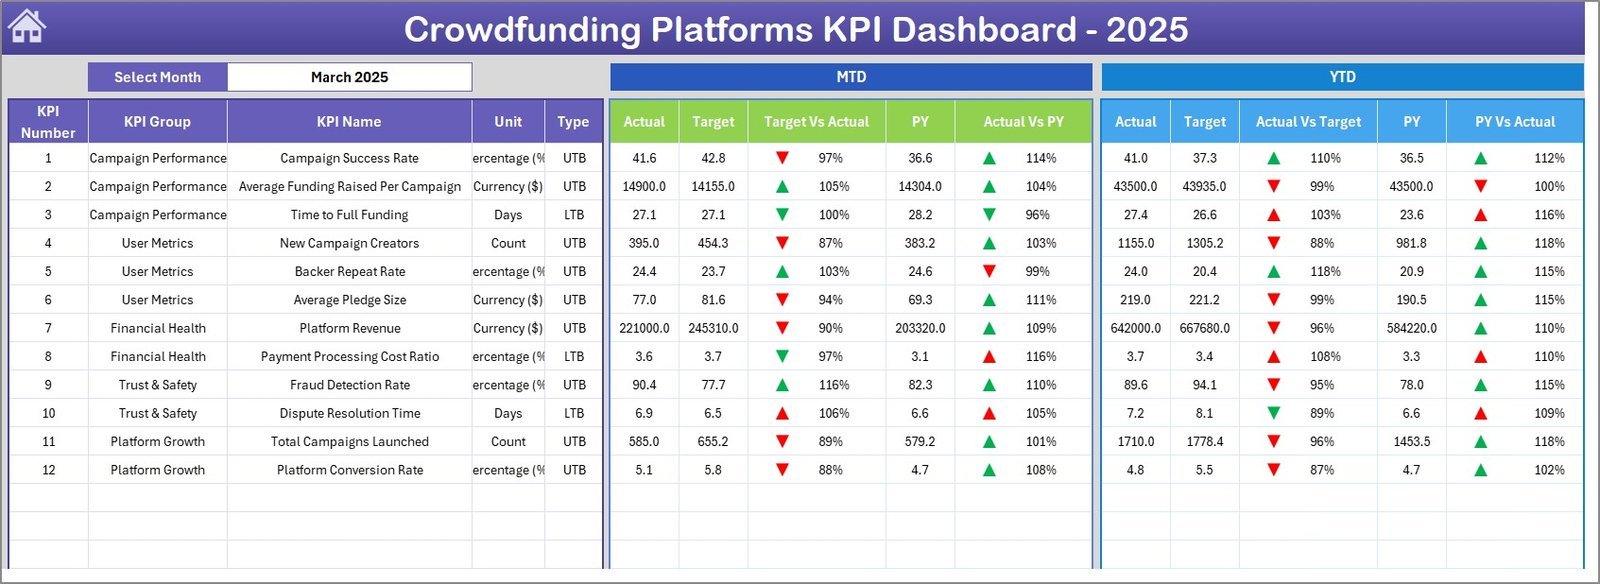
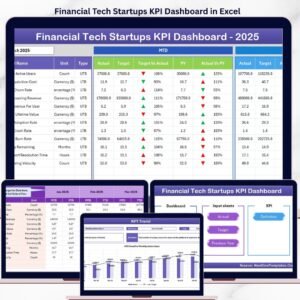
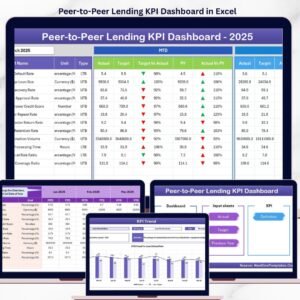
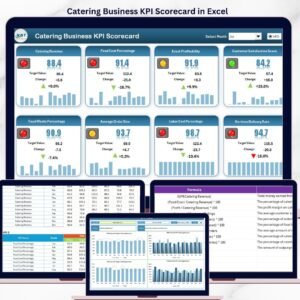
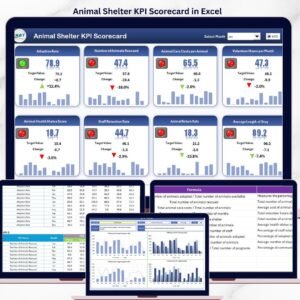
📌 MTD and YTD Tracking with Conditional Formatting – The Dashboard sheet displays MTD Actual, Target, and Previous Year values alongside YTD equivalents. Up/down arrows with conditional formatting instantly flag whether each KPI is on track, behind plan, or ahead of last year. This dashboard tracks metrics including pledge conversion rate, average pledge amount, backer retention, funding velocity, and campaign reach — all refreshing automatically when you switch months.
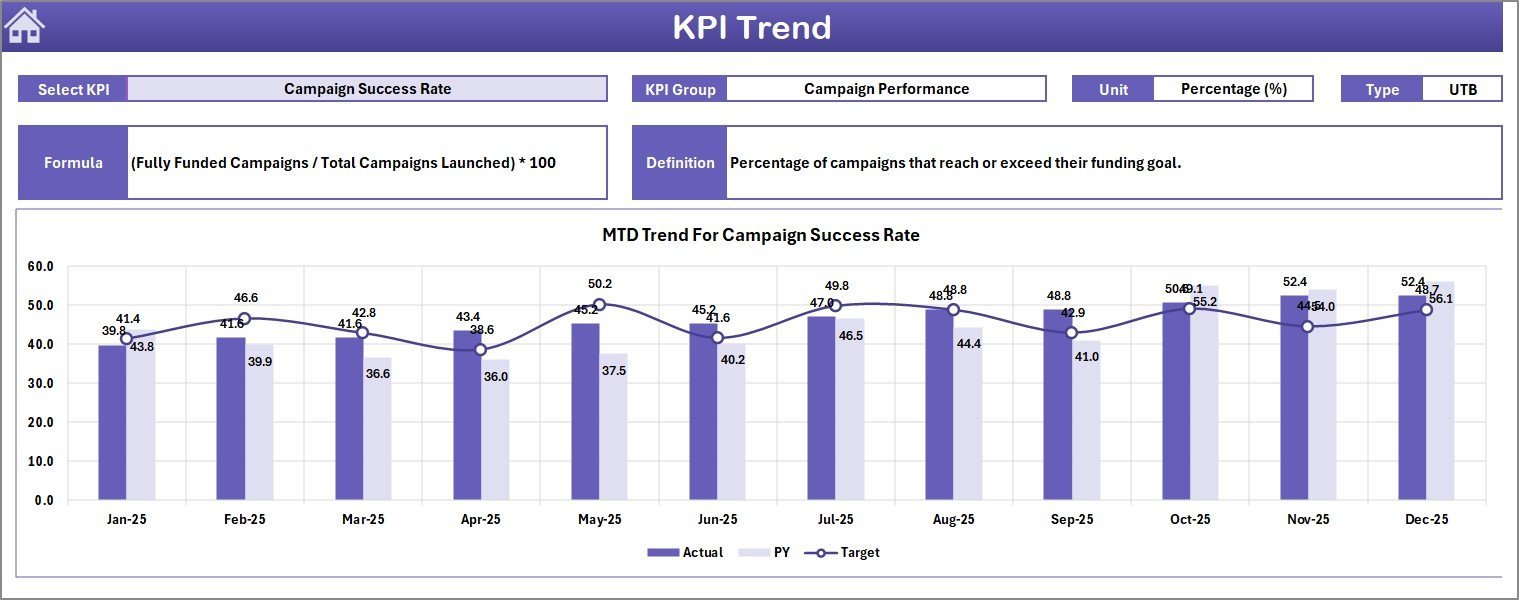
📌 Individual KPI Trend Analysis – Select any KPI from the dropdown on the KPI Trend sheet to see its 12-month MTD and YTD trend charts for Actual vs. Target vs. Previous Year. The sheet also displays KPI Group, Unit, Type (Lower the Better or Upper the Better), Formula, and Definition — so every team member understands exactly what they are measuring.
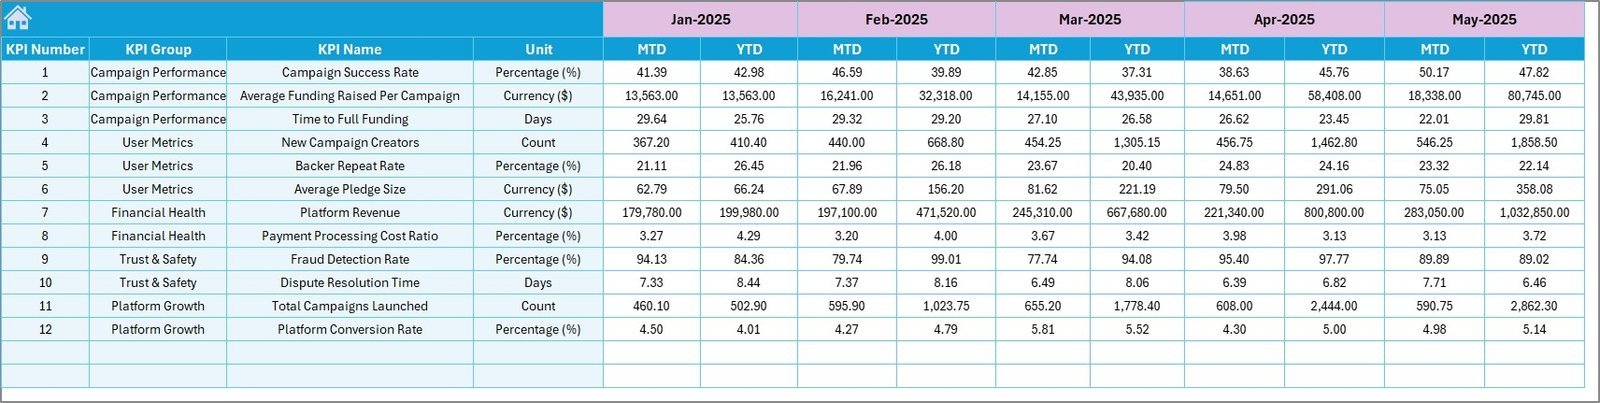
📌 Separate Input Sheets for Actuals, Targets, and PY – Three dedicated input sheets keep raw data clean and organized. Enter actual numbers, target numbers, and previous-year numbers independently. Change the starting month from cell E1 on the Actual sheet to align with your fiscal year.
📌 KPI Definition Sheet – Document every KPI’s name, group, unit, formula, definition, and type (LTB or UTB) in one reference table. New hires and stakeholders can look up any metric’s meaning without asking the dashboard owner.
📦 What’s Inside the Crowdfunding Platforms KPI Dashboard in Excel
📄 Home Sheet – An index page with 6 navigation buttons that jump directly to each worksheet. No scrolling through tabs — click and go.
 Home Page
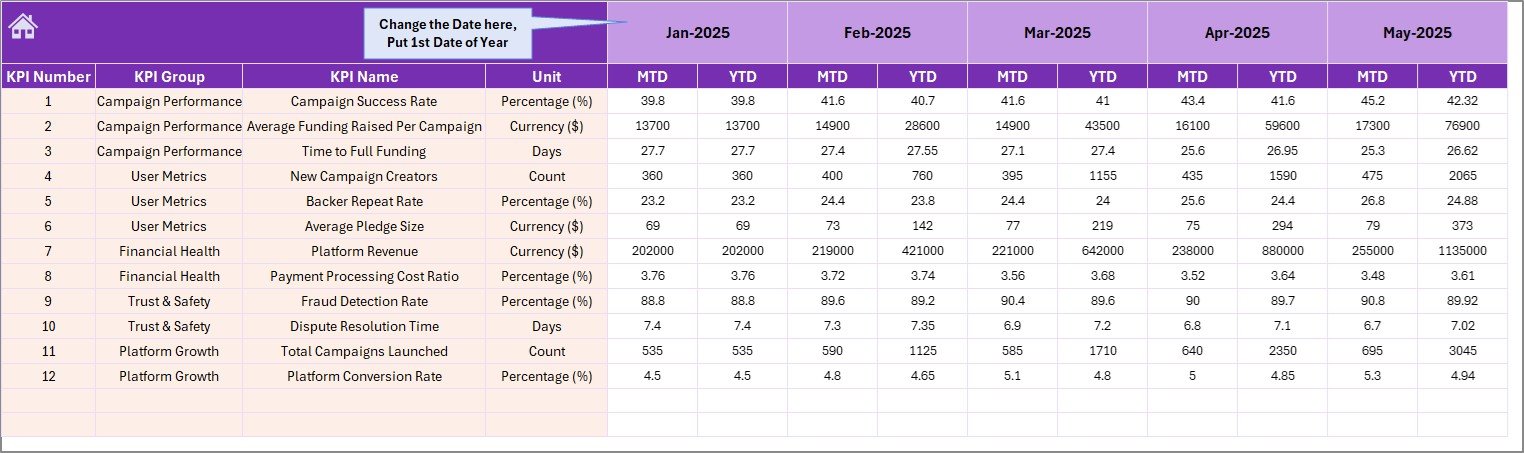
📄 Dashboard Sheet – The main reporting view. Select a month from the dropdown on cell D3 and the entire dashboard updates. MTD and YTD sections show Actual, Target, and Previous Year data with Target vs. Actual and PY vs. Actual variance columns — each color-coded with conditional formatting arrows.
 Crowdfunding Platforms KPI Dashboard
📄 KPI Trend Sheet – Pick a KPI from the dropdown on cell C3. The sheet shows KPI Group, Unit, Type, Formula, and Definition at the top, followed by MTD and YTD trend charts plotting Actual, Target, and Previous Year lines across 12 months.
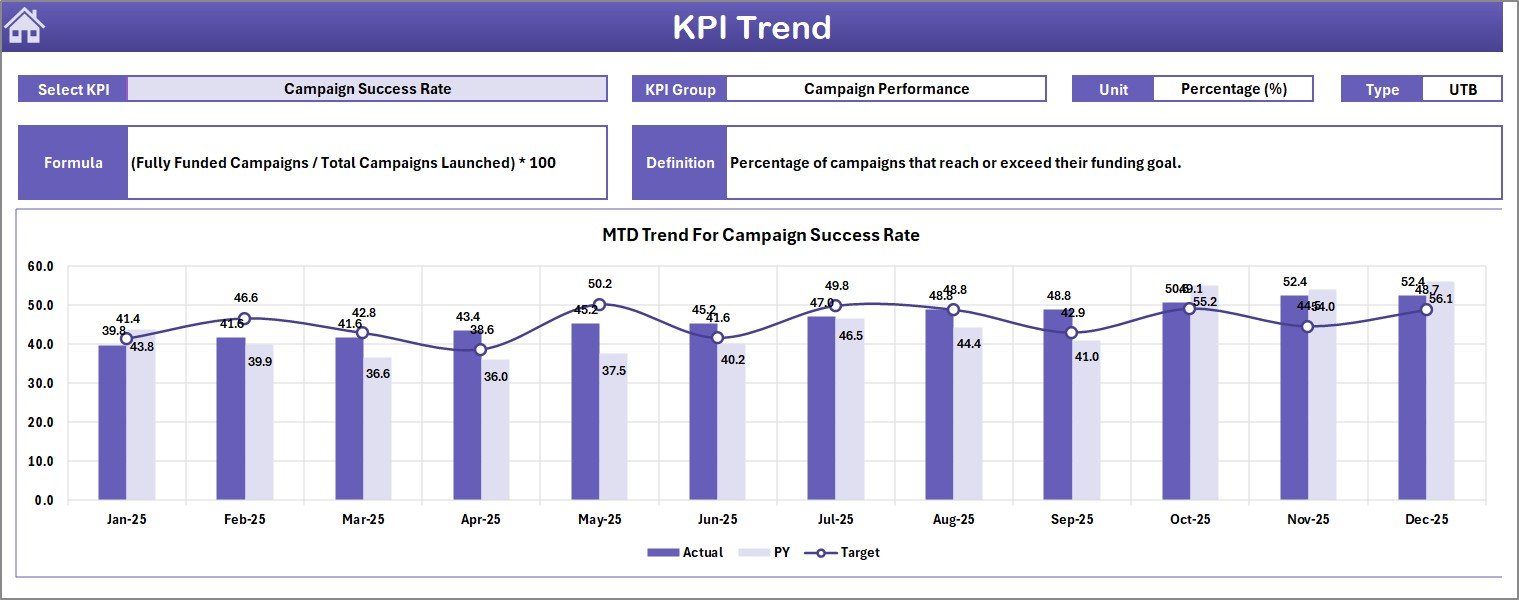 KPI Trend Sheet
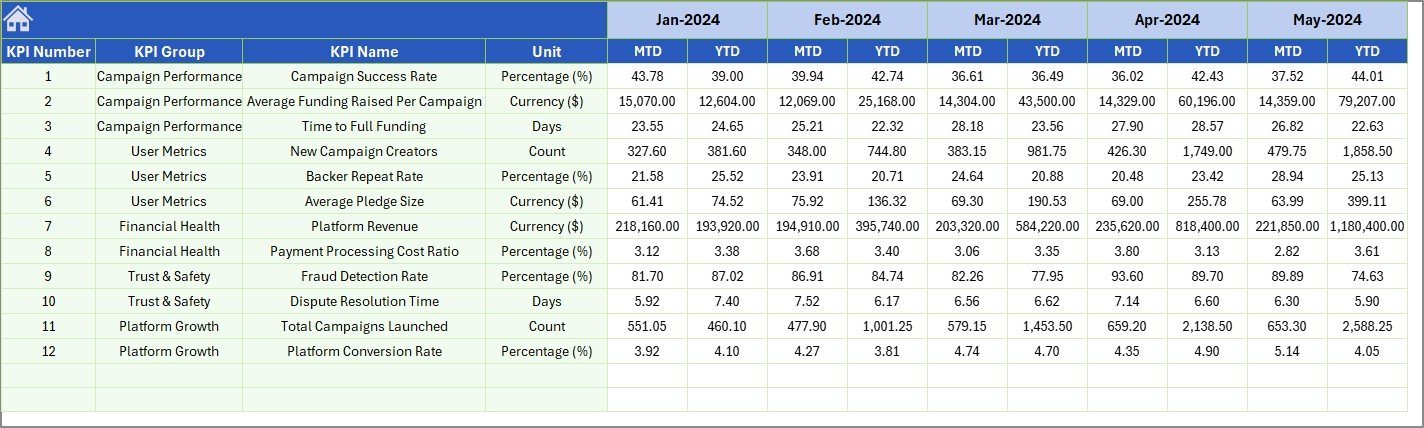
📄 Actual Numbers Input Sheet – Enter MTD and YTD actual numbers for each KPI per month. Set the first month of your year in cell E1 to align with your fiscal calendar.
 Actual Numbers Input Sheet
📄 Target Number Input Sheet – Enter monthly MTD and YTD targets for each KPI. The dashboard automatically pulls these values into the variance calculations on the Dashboard sheet.
 Target Number Input Sheet
📄 Previous Year Number Sheet – Enter previous-year data in the same format as your current-year actuals, enabling year-over-year comparisons across the dashboard.
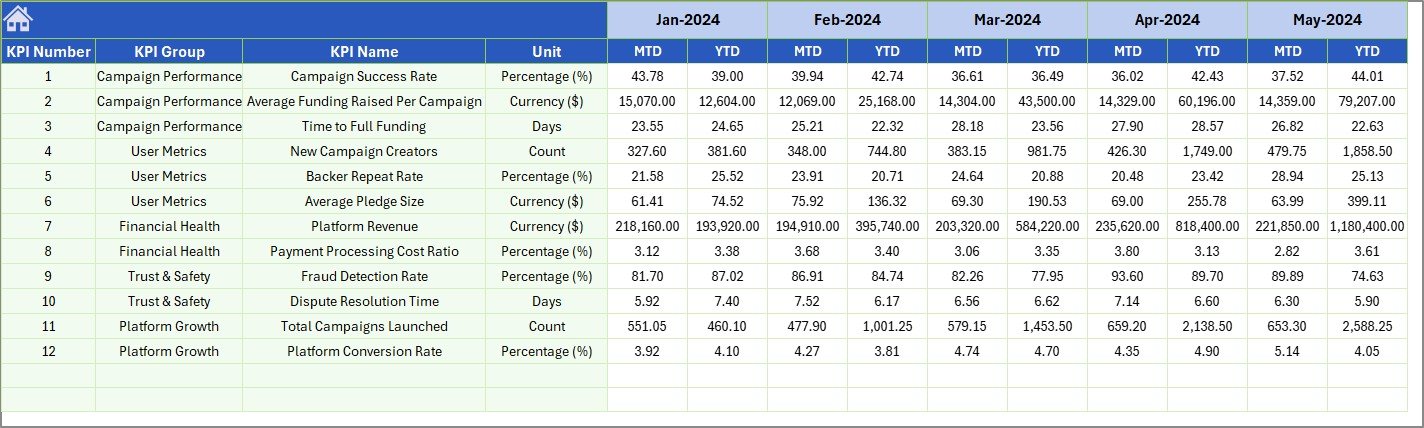 Previous Year Number Input Sheet
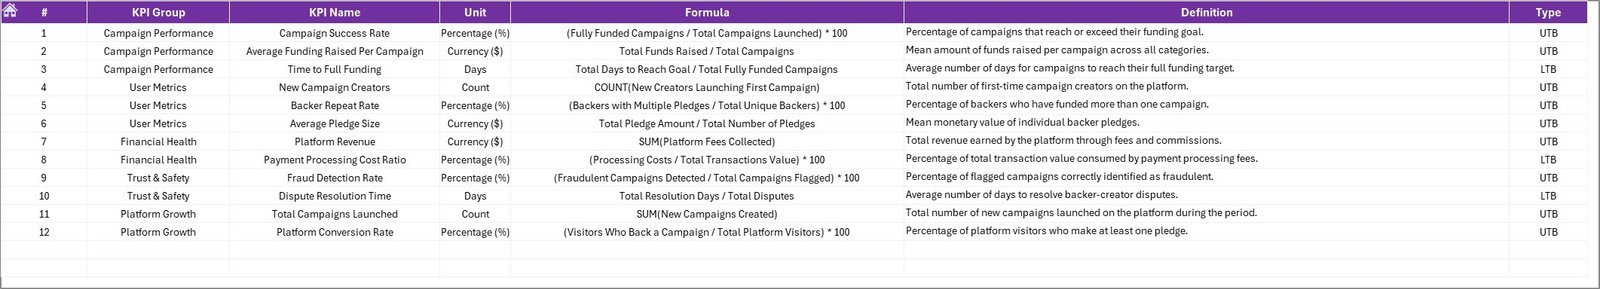
📄 KPI Definition Sheet – Enter KPI Name, KPI Group, Unit, Formula, Definition, and KPI Type (LTB or UTB). This sheet feeds the KPI Trend page’s metadata display and keeps all metric definitions in one place.
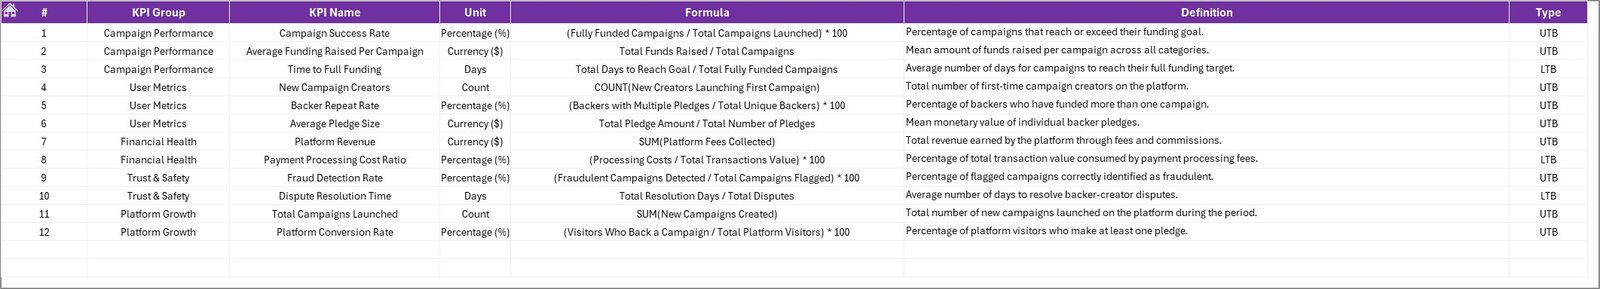 KPI Definition Sheet
📊 Crowdfunding Platforms KPI Dashboard vs. Google Sheets Equivalent vs. BackerKit Analytics — Where This Fits
| Feature | Crowdfunding Platforms KPI Dashboard (Excel) | Google Sheets KPI Template | BackerKit Analytics / Fundly Pro |
|---|---|---|---|
| Cost | $14.99 one-time | Free–$15 (limited) | $29–$99/month |
| Platform | Microsoft Excel (desktop + web) | Google Sheets (browser) | Cloud SaaS |
| Setup Time | Under 10 minutes | 30–60 minutes | 1–3 hours + onboarding |
| MTD + YTD Tracking | ✅ Built-in with PY comparison | Manual formulas | ✅ Automated |
| Conditional Formatting Arrows | ✅ Pre-built | Requires custom rules | ✅ Built-in |
| KPI Trend Charts | ✅ Auto-generated per KPI | Manual chart creation | ✅ Built-in |
| Offline Access | ✅ Full offline capability | ❌ Requires internet | ❌ Requires internet |
| Customizable KPI Definitions | ✅ Dedicated definition sheet | Varies by template | Limited customization |
| Year-1 Cost (5 Users) | $14.99 total | $0–$15 | $1,740–$5,940 |
For crowdfunding teams that want structured KPI tracking without monthly SaaS fees, the Crowdfunding Platforms KPI Dashboard in Excel sits in the sweet spot between free-but-manual spreadsheets and expensive analytics platforms.
👥 Who This Template Is For — and Who It’s Not For
✅ This template is built for:
- Crowdfunding platform managers tracking campaign performance across multiple projects
- Startup founders monitoring pledge conversion, backer growth, and funding velocity month by month
- Finance teams at crowdfunding companies comparing actuals against targets and previous-year benchmarks
- Consultants reporting crowdfunding KPIs to clients without licensing per-seat SaaS tools
❌ This template is NOT for:
- Enterprise crowdfunding platforms needing real-time API integrations with Kickstarter, Indiegogo, or GoFundMe data feeds
- Teams requiring multi-user concurrent editing — Excel works best as a single-editor file shared via OneDrive or email
⚙️ How to Use the Crowdfunding Platforms KPI Dashboard in Excel
1️⃣ Open the file in Microsoft Excel 2016 or later (desktop or Microsoft 365).
2️⃣ Go to the KPI Definition sheet and enter your crowdfunding KPI names, groups, units, formulas, definitions, and types (LTB or UTB).
3️⃣ Enter your Target numbers on the Target Number Input sheet for each KPI and each month (MTD and YTD).
4️⃣ Enter your Actual numbers on the Actual Numbers Input sheet as each month closes.
5️⃣ Enter Previous Year data on the Previous Year Number sheet to enable year-over-year comparisons.
6️⃣ Open the Dashboard sheet, select a month from the dropdown on cell D3, and review your MTD/YTD performance with variance arrows.
7️⃣ Use the KPI Trend sheet to drill into any individual KPI’s 12-month trend with Actual, Target, and PY plotted together.
💼 Real-World Use Cases
Amit manages platform analytics at a mid-size equity crowdfunding company. He uses the Crowdfunding Platforms KPI Dashboard in Excel to track 15 KPIs — including campaign success rate, average pledge size, backer churn, and platform fee revenue — across monthly board reports. Before switching to this template, his team spent 6 hours per month manually assembling charts in PowerPoint. Now the dashboard auto-updates in under 10 minutes.
Lisa runs a rewards-based crowdfunding consultancy. She customizes a copy of this dashboard for each client campaign, entering actual pledge data weekly and comparing it against the funding target. The KPI Trend sheet lets her show clients exactly where pledge momentum slowed — and the PY comparison proves whether the current campaign outperforms last year’s launch.
Carlos is the CFO of a donation-based crowdfunding platform. He tracks platform-level KPIs — total campaigns hosted, average funding percentage, donor retention rate, and processing fee revenue — and presents the Dashboard sheet directly in monthly leadership meetings. The conditional formatting arrows make it easy for non-technical board members to see which metrics need attention.
❓ Frequently Asked Questions
What KPIs does the Crowdfunding Platforms KPI Dashboard track?
The Crowdfunding Platforms KPI Dashboard in Excel tracks any crowdfunding metric you define — pledge conversion rate, average pledge amount, backer retention, funding velocity, campaign success rate, and more. You configure all KPIs on the KPI Definition sheet.
How long does setup take?
Setup takes under 10 minutes. Open the file in Excel, fill in your KPI definitions, enter target and actual numbers, and the dashboard generates all charts and variance calculations automatically.
Can I customize the KPIs for my specific crowdfunding platform?
Yes. The KPI Definition sheet lets you add, rename, or remove any KPI. Enter the KPI name, group, unit, formula, definition, and type (LTB or UTB). The dashboard adapts to whatever metrics you define.
How does this compare to BackerKit Analytics or Fundly Pro?
BackerKit Analytics costs $29–$99 per month with per-seat pricing. The Crowdfunding Platforms KPI Dashboard in Excel is a $14.99 one-time purchase with no recurring fees, no user limits, and full offline access. It lacks real-time API integrations but handles manual KPI tracking effectively.
Does this work on Mac?
Yes. The Crowdfunding Platforms KPI Dashboard works in Microsoft Excel for Mac 2016 or later. It uses standard Excel formulas, conditional formatting, and charts — no VBA macros required.
Can I track month-over-month and year-over-year trends?
Yes. The KPI Trend sheet plots 12-month trends for Actual, Target, and Previous Year data. The Dashboard sheet shows both MTD and YTD variances against targets and prior-year figures with conditional formatting arrows.
Is this template suitable for equity crowdfunding, rewards-based, or donation-based platforms?
Yes. Since you define your own KPIs on the KPI Definition sheet, the Crowdfunding Platforms KPI Dashboard in Excel works for any crowdfunding model — equity, rewards, donation, or debt-based. Just enter the metrics relevant to your platform.
👤 About the Author
Built by PK — Microsoft Certified Professional with 15+ years of Excel, Google Sheets, and Power BI experience. Founder of NextGenTemplates, reaching 300K+ subscribers across YouTube channels (@PK-AnExcelExpert, @NextGenTemplates, @NeoTechNavigators). Every template is hand-built and tested before release.
🔗 Explore Related Templates
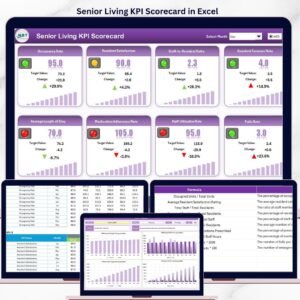
📌 Crowdfunding KPI Scorecard in Excel – A traffic-light scorecard format for tracking crowdfunding KPIs with Actual vs. Target status indicators.
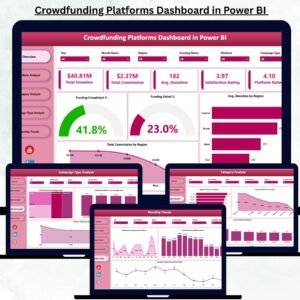
📌 Crowdfunding Platforms Dashboard in Power BI – The Power BI version with interactive slicers and drill-through pages for deeper crowdfunding analytics.
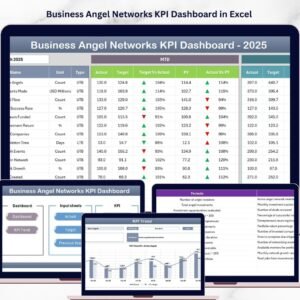
📌 Business Angel Networks KPI Dashboard in Excel – Track angel investment KPIs including deal flow, portfolio returns, and syndication metrics.
📌 Investor Relations Dashboard in Excel – Monitor shareholder communications, earnings metrics, and investor engagement KPIs.
📌 Also available as: Power BI version | KPI Scorecard version
Browse all KPI Dashboard templates on NextGenTemplates.
📖 Click here to read the Detailed Blog Post
🎥 Visit our YouTube channel for step-by-step video tutorials
👉 YouTube.com/@NextGenTemplates


Reviews
There are no reviews yet.