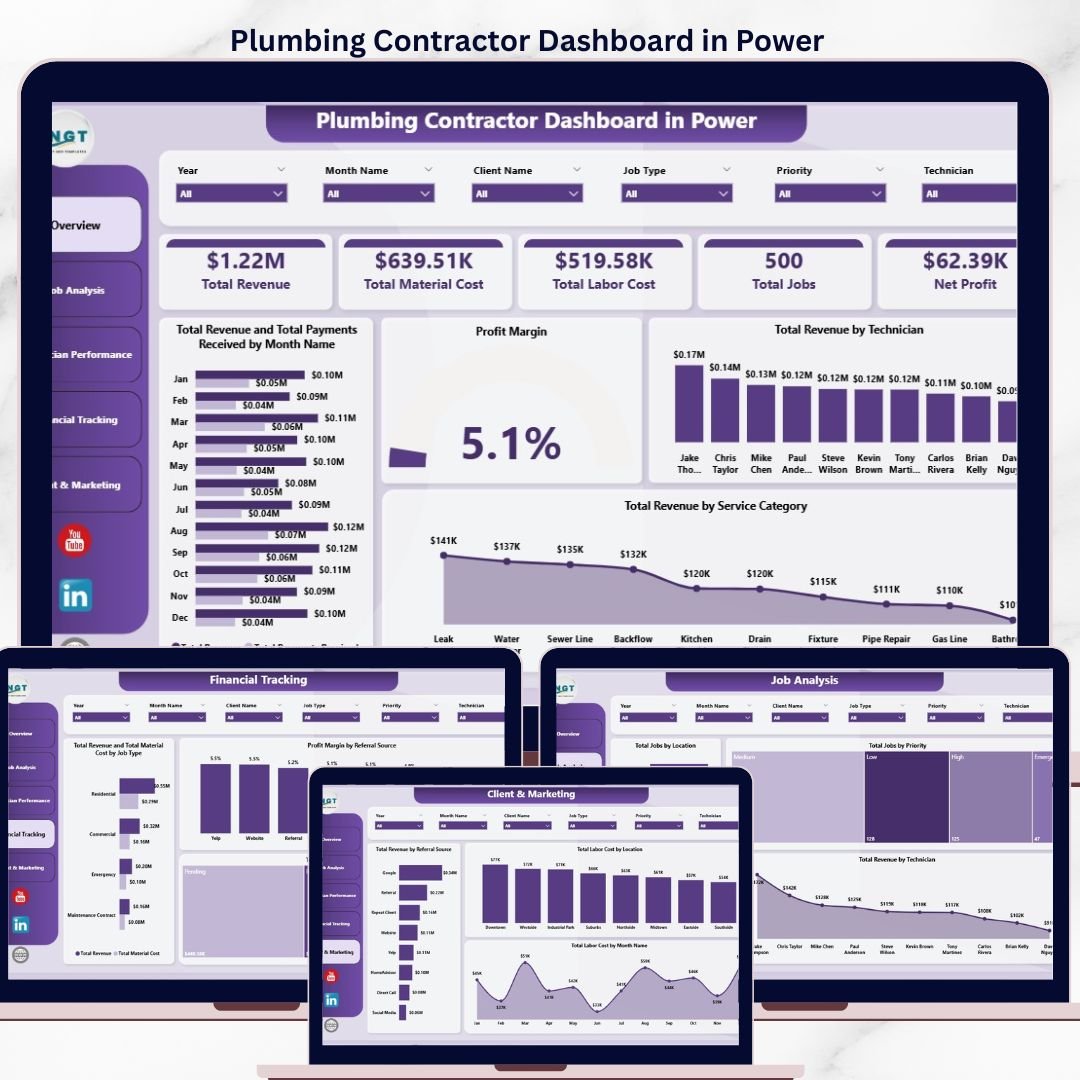


The Plumbing Contractor Dashboard in Power BI tracks 5 headline KPIs across 5 interactive report pages, with 12 DAX-driven visuals, multiple cross-page slicers, and a fully editable .pbix file. Setup takes under 10 minutes — point the data source at your job log, click Refresh, and every card, chart, and technician view rebuilds in free Power BI Desktop.
🌍 Join 8,400+ teams in 40+ countries using NextGenTemplates to replace paid SaaS tools with one-time-purchase Excel, Google Sheets, Power BI, and HTML templates.
✅ Instant download · One-time payment · No subscription · No per-user fees · Lifetime access
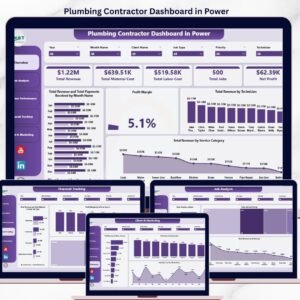
Plumbing Contractor Dashboard in Power BI — Overview Page
🔑 Key Features of the Plumbing Contractor Dashboard in Power BI
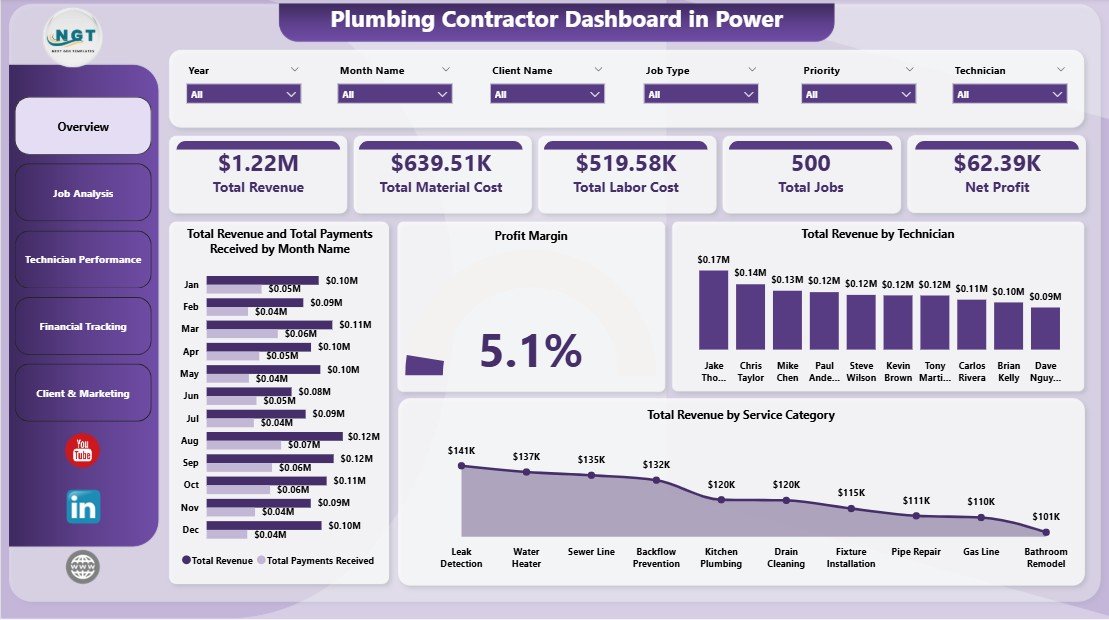
🚿 5 KPI cards on the Overview page — Total Revenue, Total Material Cost, Total Labor Cost, Total Jobs, and Net Profit. Every card is a DAX measure wired to the underlying job table, so the numbers recalculate the moment you click Refresh in Power BI Desktop. These are the same headline metrics plumbing business owners review weekly to brief office staff on revenue, cost control, job volume, and bottom-line profitability.
📊 12 DAX-driven visuals across 5 report pages covering Overview, Job Analysis, Technician Performance, Financial Tracking, and Client & Marketing. Each visual is anchored to a Power BI measure — refresh the model once and every chart rebuilds in one click, with no visual edits required.
🎯 Cross-page slicers for fast filtered views let you drill from a company-wide view down to a single technician, service category, location, or priority level in two clicks. Built for plumbing owners, dispatchers, and operations managers who need different slices of the same job log without rebuilding the report.
🗂️ Fully editable star-schema data model — connect the .pbix to your existing Excel, CSV, or SQL job log (technician, service category, job type, hours, revenue, material cost, payment status, customer rating, location, referral source). Add new rows or columns, refresh, and every visual updates against the new data automatically.
💵 Built-in profitability view — the Financial Tracking page compares Total Revenue and Total Material Cost by Job Type, plus Profit Margin by Referral Source and Total Revenue by Payment Status. Spot which job categories are margin-rich, which marketing channels actually pay back, and which invoices need same-week AR follow-up.
📦 What’s Inside the Plumbing Contractor Dashboard in Power BI
The .pbix file ships with 5 report pages — each answering a different operating question for a plumbing contractor — all powered by a single editable data model and a shared set of slicers.
Page 1 — Overview: Headline KPI cards (Total Revenue, Total Material Cost, Total Labor Cost, Total Jobs, Net Profit) sit at the top, followed by Total Revenue and Total Payments Received by Month Name, Profit Margin, Total Revenue by Technician, and Total Revenue by Service Category. Cross-page slicers filter every visual at once.
Overview Page
Page 2 — Job Analysis: Total Jobs by Location, Total Jobs by Priority, and Total Revenue by Technician. This view answers “where is the work coming from, which priority bucket is consuming capacity, and which technician is driving revenue?” in one glance.
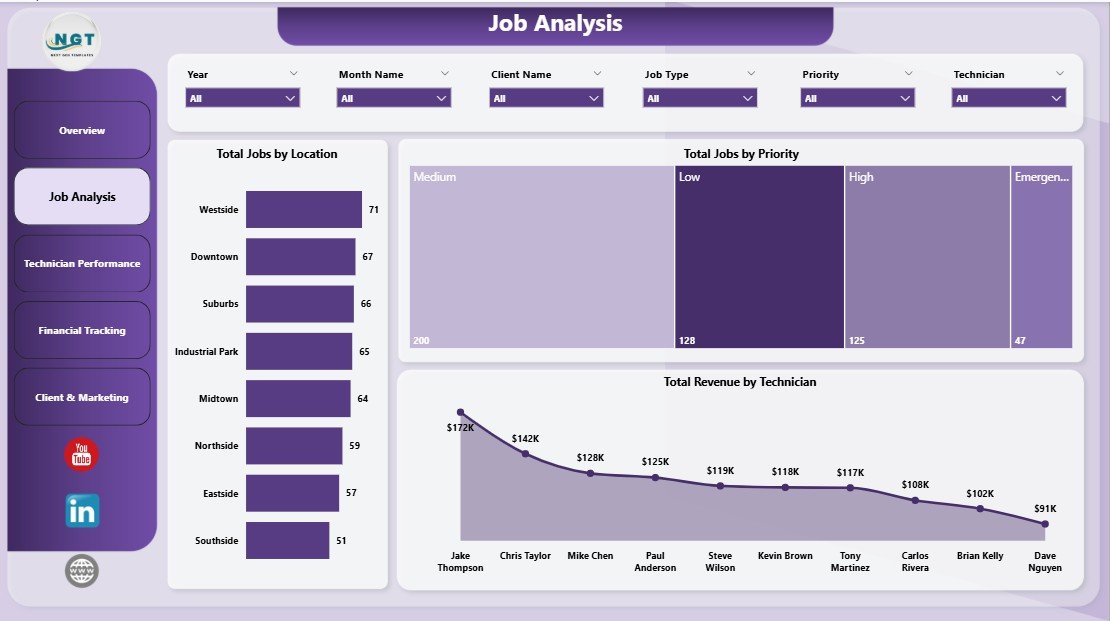
Job Analysis
Page 3 — Technician Performance: Avg. Customer Rating by Technician, Completed Jobs by Technician, and Net Profit by Month Name. Use this page for monthly 1-on-1s, quarterly bonus calculations, and identifying training or coaching needs across the crew.
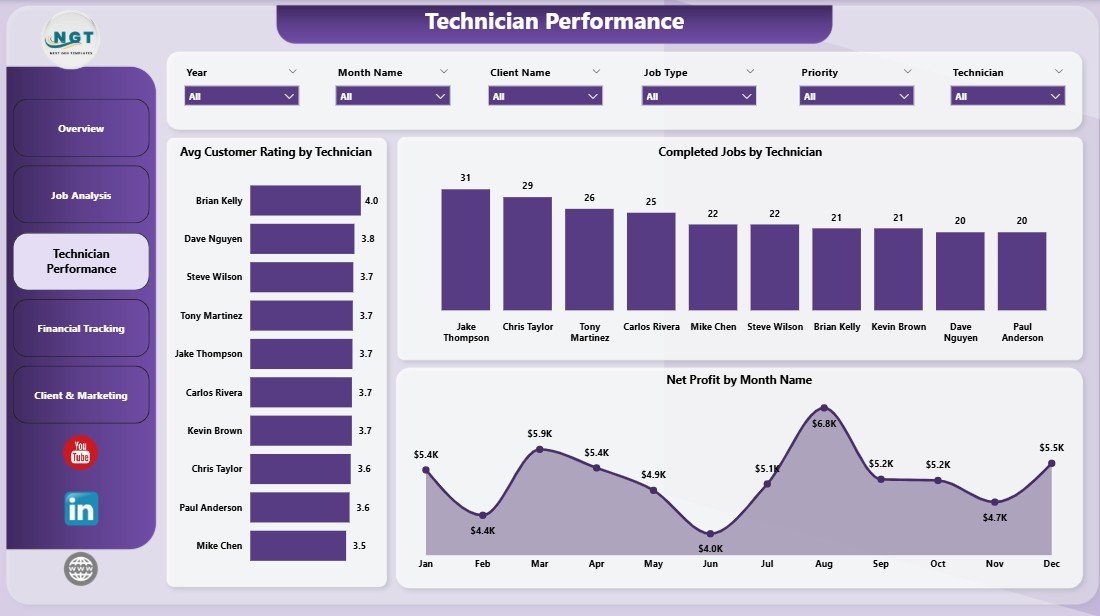
Technician Performance
Page 4 — Financial Tracking: Total Revenue and Total Material Cost by Job Type, Profit Margin by Referral Source, and Total Revenue by Payment Status. The Profit Margin chart exposes which marketing channels actually deliver profitable work; the Payment Status split is your weekly AR call list.
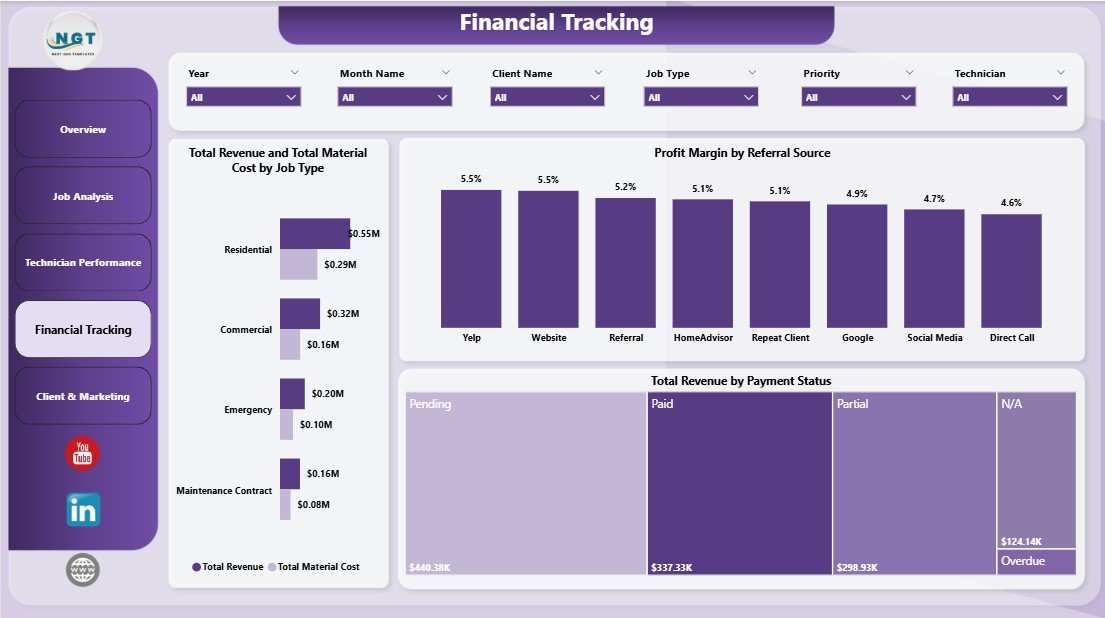
Financial Tracking
Page 5 — Client & Marketing: Total Revenue by Referral Source, Total Labor Cost by Location, and Total Labor Cost by Month Name. Use this page to decide where to spend the next marketing dollar and where labor cost is stacking up over time.
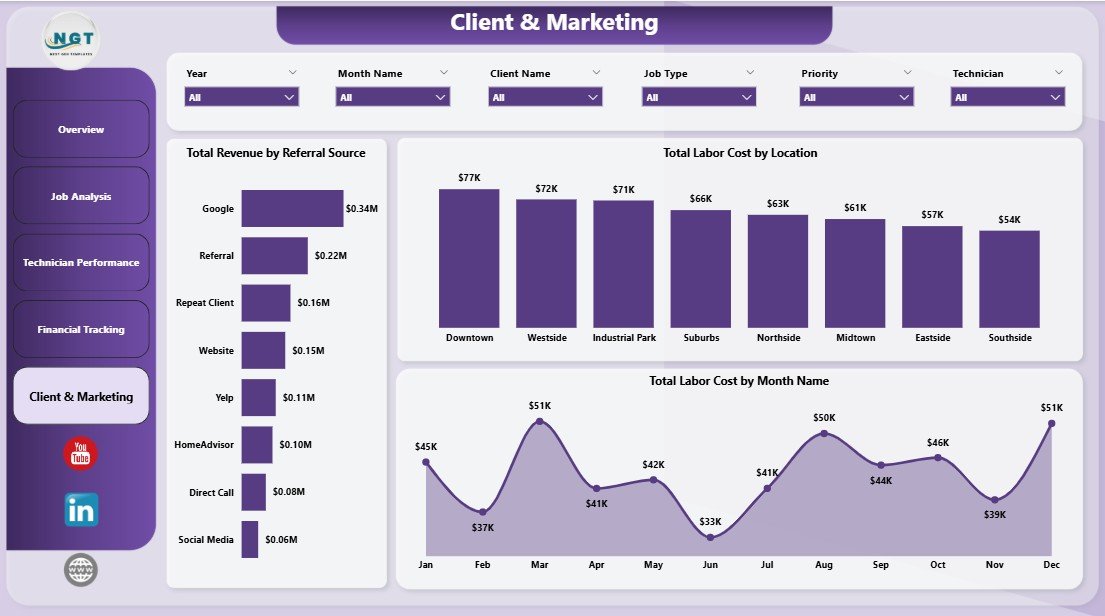
Client & Marketing
📊 Plumbing Contractor Dashboard in Power BI vs. Tableau / Qlik vs. ServiceTitan / Jobber — Where This Fits
| Feature | Plumbing Contractor Dashboard in Power BI | Tableau / Qlik Equivalent | ServiceTitan / Jobber / Housecall Pro |
|---|---|---|---|
| Cost | $17.99 one-time | $70–$120 / user / month + build cost | $49–$398 / user / month |
| Platform | Free Power BI Desktop | Tableau Desktop / Qlik Sense | Cloud SaaS |
| Setup time | Under 10 minutes | Days to weeks (consultant build) | 2–6 weeks onboarding |
| Customizable visuals | ✅ Fully editable DAX & visuals | ✅ Fully editable | Limited to vendor schema |
| Cross-page slicers | ✅ Native sync slicers | ✅ Filter actions | ✅ Built-in |
| Technician performance view | ✅ Dedicated page with 3 visuals | Custom build required | ✅ Available on higher tiers |
| Per-user fees | None — share the .pbix | $70–$120 per user / month | $49–$398 per technician / month |
| Year-1 cost at 5 users | $17.99 | $4,200–$7,200+ | $2,940–$23,880 |
| Mobile dispatch app | ❌ Power BI mobile (read-only) | ❌ Read-only mobile | ✅ Native iOS/Android |
For plumbing contractors who already work in Microsoft 365 and want owner-level Power BI visibility into revenue, technician performance, and AR — without paying $49–$398 per technician per month for a full field-service platform — the Plumbing Contractor Dashboard in Power BI sits in the sweet spot.
👥 Who This Template Is For — and Who It’s Not For
✅ This template is built for:
- Independent plumbing contractors and 2–25 technician shops who already log jobs in Excel, CSV, or QuickBooks
- Plumbing business owners who want a Power BI weekly KPI review without hiring a BI consultant
- Office managers and dispatchers who need to slice job data by technician, location, service category, or priority
- Trades-business consultants who need a client-ready Power BI reporting template for plumbing engagements
❌ This template is NOT for:
- Multi-location plumbing franchises that need real-time mobile dispatch with GPS routing
- Teams that need an integrated invoicing, payments, and customer messaging platform — that is what ServiceTitan and Jobber are built for
- Companies with no historical job records to load into the data model
⚙️ How to Use the Plumbing Contractor Dashboard in Power BI
- Download the .pbix file and open it in Power BI Desktop (free from Microsoft).
- Open the data model via Home → Transform Data and review the column structure. The fields define what every visual measures — keep names identical when you replace data.
- Replace the sample dataset with your own job records via Home → Get Data → Excel / CSV / SQL Server. Map the columns once and the model remembers the mapping.
- Click Refresh on the Home ribbon. Every DAX measure, KPI card, and visual on all 5 report pages updates instantly against the new data.
- Use the cross-page slicers at the top of each page to filter by technician, service category, location, priority, or referral source — visuals respond in real time.
- Publish to Power BI Service (optional) if you have a Pro license and want browser-based sharing with crew or accountants.
💼 Real-World Use Cases
Mark runs an 8-technician plumbing shop in Phoenix. He used to spend Sunday evenings building a job summary in Excel to brief his lead tech on Monday morning. With the Plumbing Contractor Dashboard in Power BI, he points the .pbix at his QuickBooks export, clicks Refresh, and walks into the Monday huddle with the Technician Performance page on a tablet. Total time from raw export to printed brief: about 3 minutes.
Lisa is the office manager at a 3-tech residential plumbing company in Denver. She needed a way to flag unpaid invoices without buying ServiceTitan at $300/month per seat. The Financial Tracking page’s “Total Revenue by Payment Status” visual now drives her Tuesday-morning AR follow-up call list, and the “Profit Margin by Referral Source” chart helped the owner kill a $400/month Yelp ad spend that wasn’t pulling its weight.
Raj consults for trades businesses across Texas. He uses the Plumbing Contractor Dashboard as a 30-minute discovery deliverable for new plumbing clients. He loads the client’s last 6 months of jobs into the data model, exports the Overview and Technician Performance pages to PDF, and the conversation about where to invest moves much faster.
❓ Frequently Asked Questions
What KPIs does the Plumbing Contractor Dashboard in Power BI track?
The Plumbing Contractor Dashboard in Power BI tracks 5 headline KPIs — Total Revenue, Total Material Cost, Total Labor Cost, Total Jobs, and Net Profit — plus 12 supporting visuals across job priority, service category, technician performance, payment status, and referral source. All KPIs and visuals update automatically when you click Refresh in Power BI Desktop.
Do I need a Power BI Pro license to use this dashboard?
No. The Plumbing Contractor Dashboard in Power BI runs in free Power BI Desktop. You only need Power BI Pro if you want to publish the report to Power BI Service for browser-based sharing. Local use, PDF export, and all 5 pages work fully in the free Desktop edition on Windows.
How long does setup take?
Setup takes under 10 minutes for the Plumbing Contractor Dashboard in Power BI. Open the .pbix in Power BI Desktop, point Get Data at your existing job log (Excel, CSV, or SQL), and click Refresh. Every KPI card, slicer, and visual across all 5 report pages rebuilds automatically — no DAX edits required.
How does this compare to ServiceTitan or Jobber?
ServiceTitan and Jobber are full-stack field-service platforms with mobile dispatch, payments, CRM, and customer messaging at $49–$398 per technician per month. The Plumbing Contractor Dashboard in Power BI is a $17.99 one-time analytics layer for plumbing owners who already track jobs elsewhere and want a clean weekly KPI view they fully own and customize.
Can I add custom fields to the Plumbing Contractor Dashboard?
Yes. Add new columns to your source dataset, refresh the Power BI model, and drag the new fields into any visual via the Fields pane. The Plumbing Contractor Dashboard in Power BI is fully customizable — every DAX measure, visual, and slicer is editable in Power BI Desktop.
Is this a one-time purchase or a subscription?
The Plumbing Contractor Dashboard in Power BI is a one-time purchase of $17.99 with lifetime access. There are no subscriptions, no per-user fees, and no recurring charges. Download the .pbix, share it with your office team, and use it forever — even on multiple workstations.
Does this work on Mac?
Power BI Desktop runs on Windows only, so the .pbix file requires a Windows machine to edit. Mac users can still view published reports through the Power BI web service or mobile app once the dashboard is published from a Windows desktop. For Mac-native editing, see the Plumbing Contractor Dashboard in Excel or Google Sheets.
👤 About the Author
Built by PK — Microsoft Certified Professional with 15+ years of Excel, Google Sheets, and Power BI experience. Founder of NextGenTemplates, reaching 300K+ subscribers across YouTube channels (@PK-AnExcelExpert, @NextGenTemplates, @NeoTechNavigators). Every template is hand-built and tested before release.
🔗 Explore Related Templates
If you’re a trades or field-service business, these templates pair naturally with the Plumbing Contractor Dashboard in Power BI:
- 👉 Plumbing Contractor Dashboard in Excel — same template, Excel platform. Use this if your office team prefers Excel pivots and slicers over the Power BI data model.
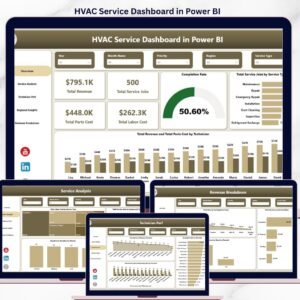
- 👉 HVAC Service Dashboard in Power BI — sister trade. Same DAX architecture, different equipment categories. Useful if you also offer HVAC service or partner with one.
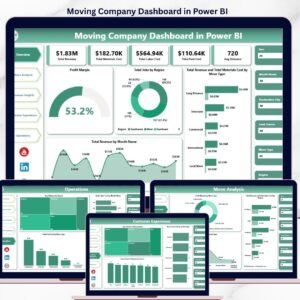
- 👉 Moving Company Dashboard in Power BI — another field-service vertical with similar revenue, crew, and customer rating analytics.
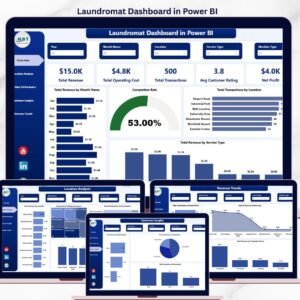
- 👉 Laundromat Dashboard in Power BI — small-business operations dashboard if you run an adjacent service business.
Browse the full Power BI Dashboard Templates library for 600+ ready-to-use Power BI dashboards across every industry.
📖 Click here to read the Detailed Blog Post
🎥 Visit our YouTube channel for step-by-step video tutorials
👉 YouTube.com/@NextGenTemplates
📅 Last updated: April 2026
Watch the step-by-step video tutorial:


Reviews
There are no reviews yet.