

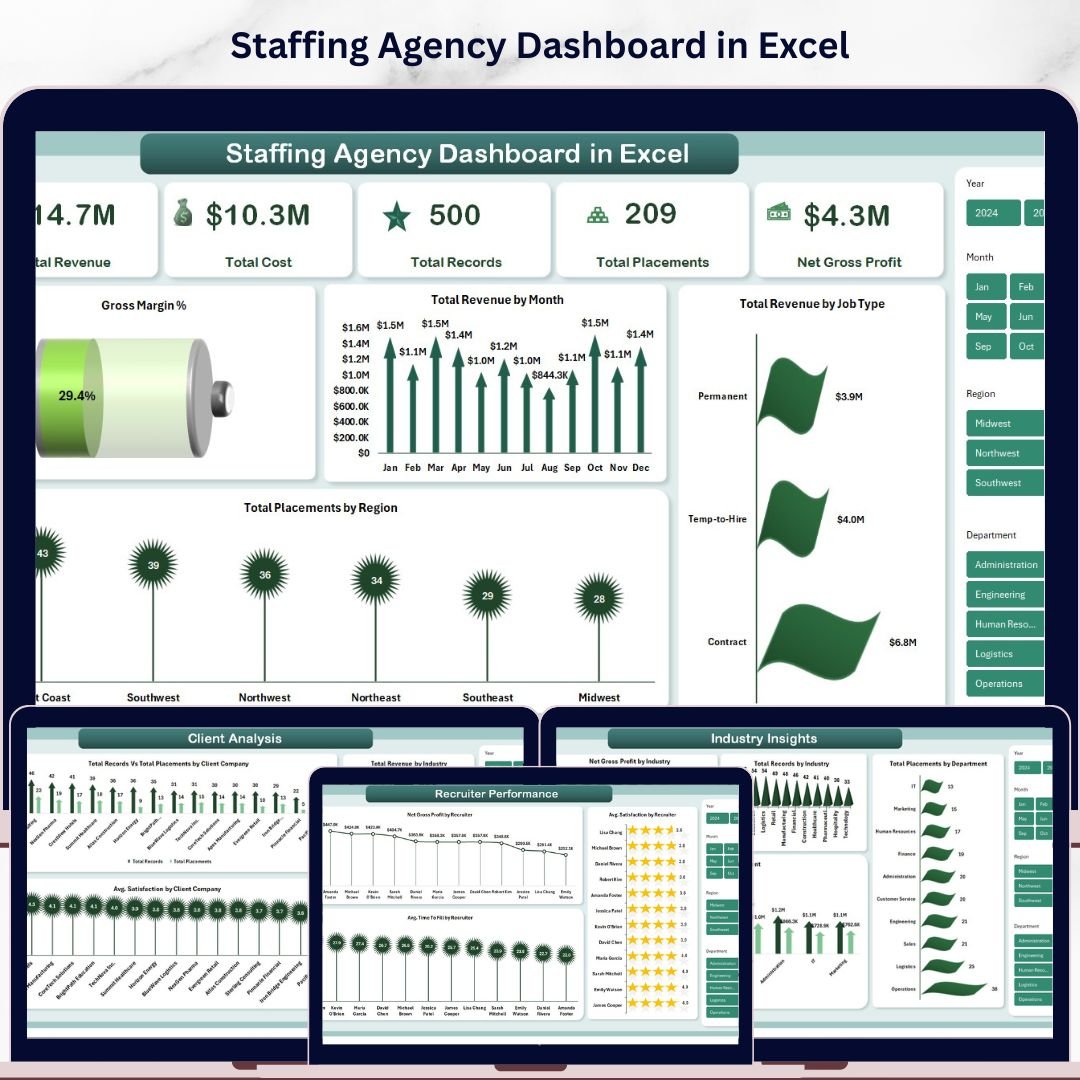



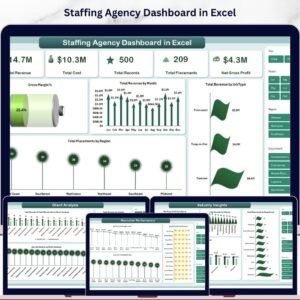
Staffing Agency Dashboard in Excel is a powerful, ready-to-use analytics template built specifically for staffing and recruitment agencies that need to track placements, revenue, recruiter performance, client relationships, and industry trends — all inside Microsoft Excel. This interactive dashboard includes 5 analysis pages, 5 KPI cards, multiple dynamic charts, and slicers for real-time filtering, making it one of the most comprehensive Excel dashboard templates available for the staffing industry. 🚀
Whether you run a boutique staffing firm or a large-scale recruitment operation, this template consolidates all your critical staffing data into a single workbook. Track Total Revenue, Total Cost, Net Gross Profit, Total Placements, and Total Records at a glance — then drill deeper into recruiter-level, client-level, and industry-level analytics using the dedicated dashboard pages. If you’ve been looking for the best HR & Payroll template to streamline your staffing agency’s reporting, this is it.
🔑 Key Features of Staffing Agency Dashboard in Excel
✨ 5 Interactive Dashboard Pages — Overview, Recruiter Performance, Client Analysis, Industry Insights, and Placement Pipeline
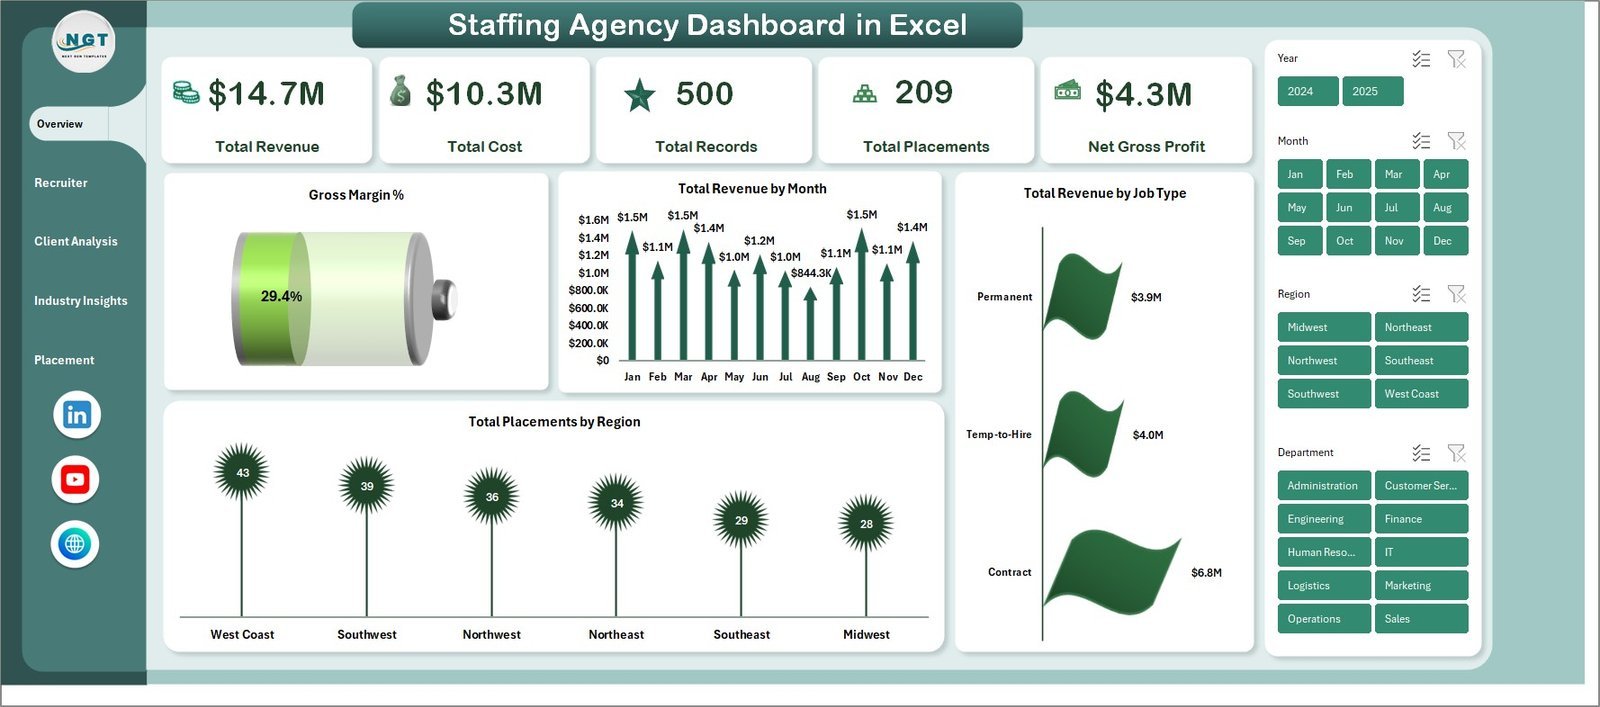
📊 5 KPI Cards on the Overview page — Total Revenue, Total Cost, Total Records, Total Placements, and Net Gross Profit
📈 Multiple dynamic charts including Gross Margin%, Total Revenue by Month, Total Revenue by Job Type, and Total Placements by Region
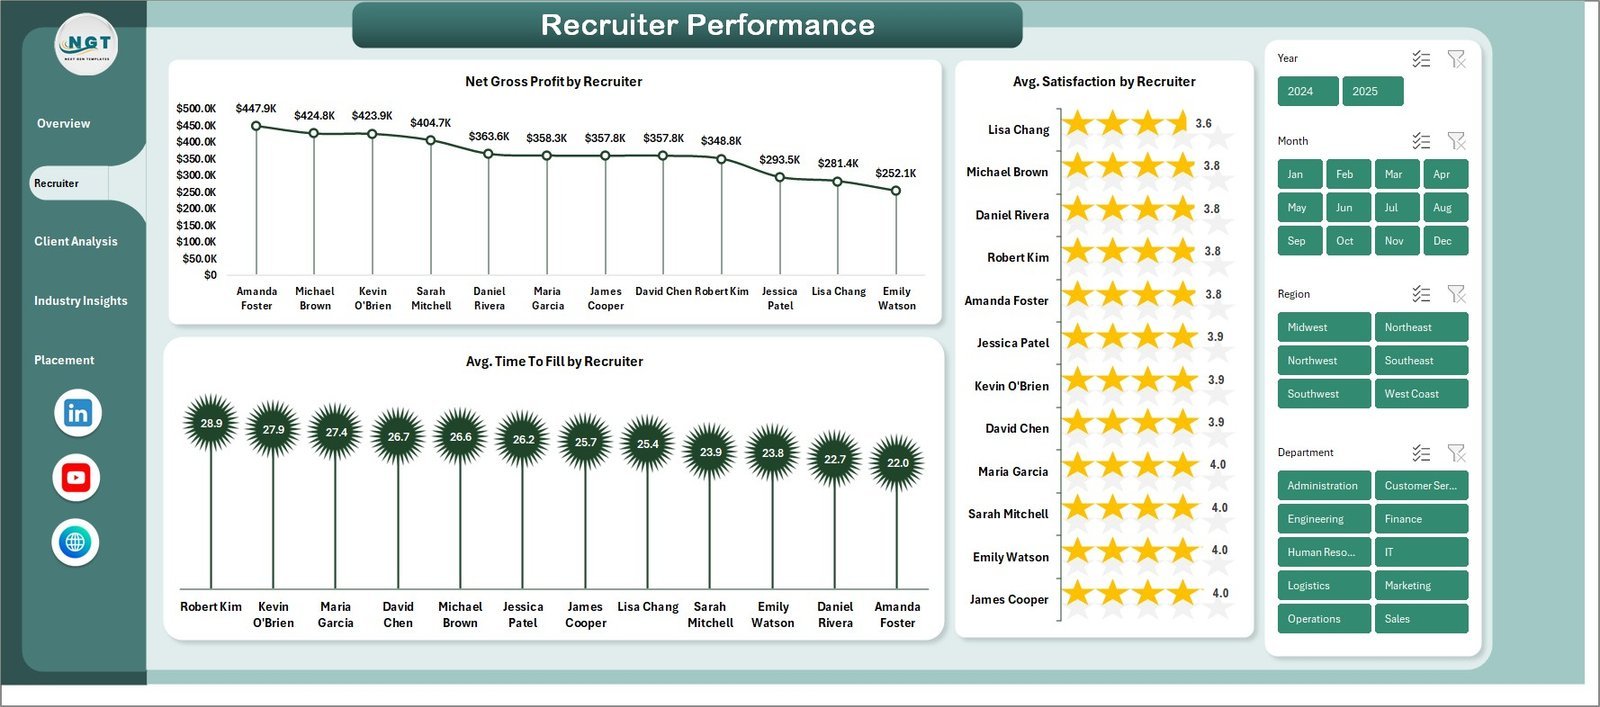
🔍 Recruiter Performance analysis with Net Gross Profit by Recruiter, Avg. Satisfaction by Recruiter, and Avg. Time To Fill by Recruiter
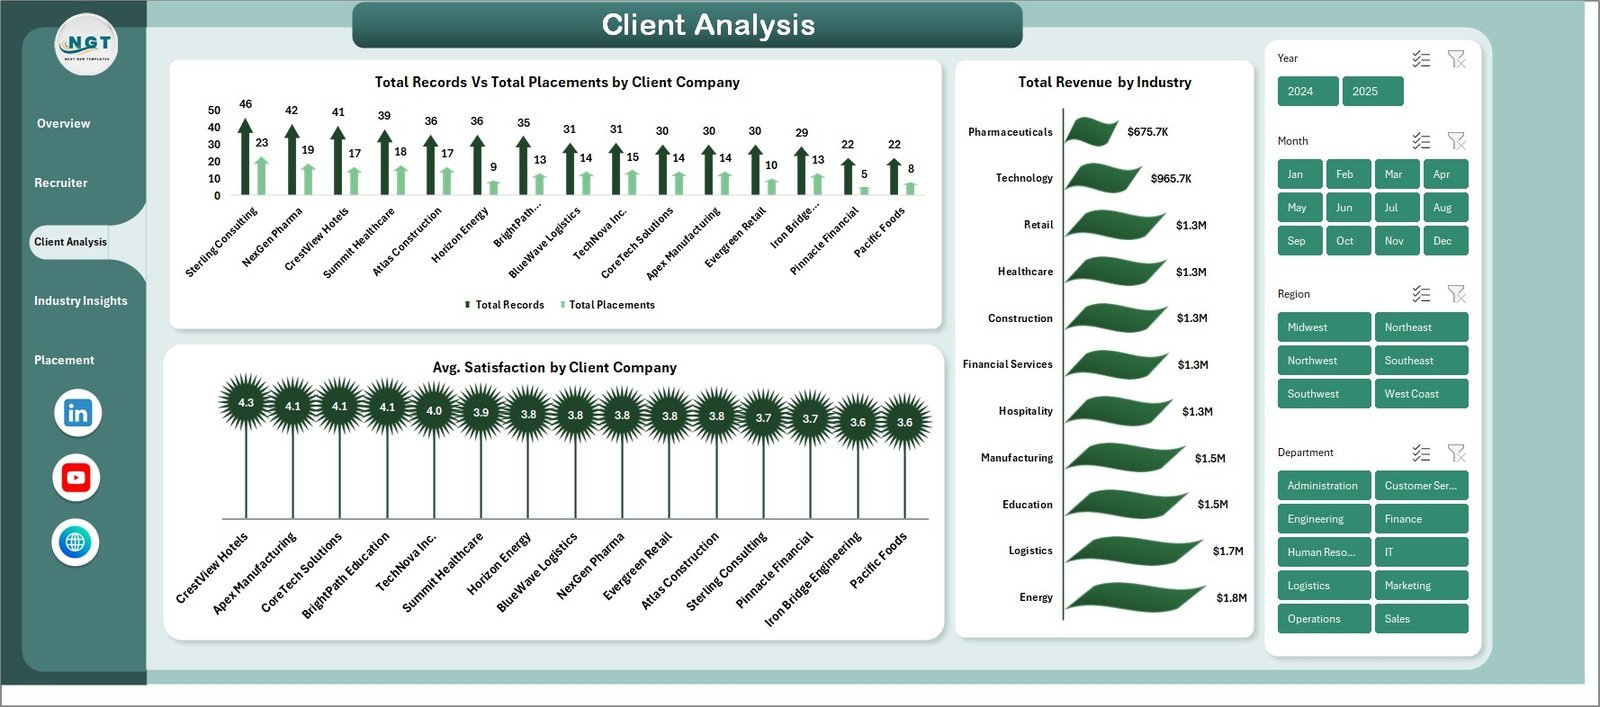
🏢 Client Analysis page showing Total Records vs Total Placements by Client Company, Total Revenue by Industry, and Avg. Satisfaction by Client Company
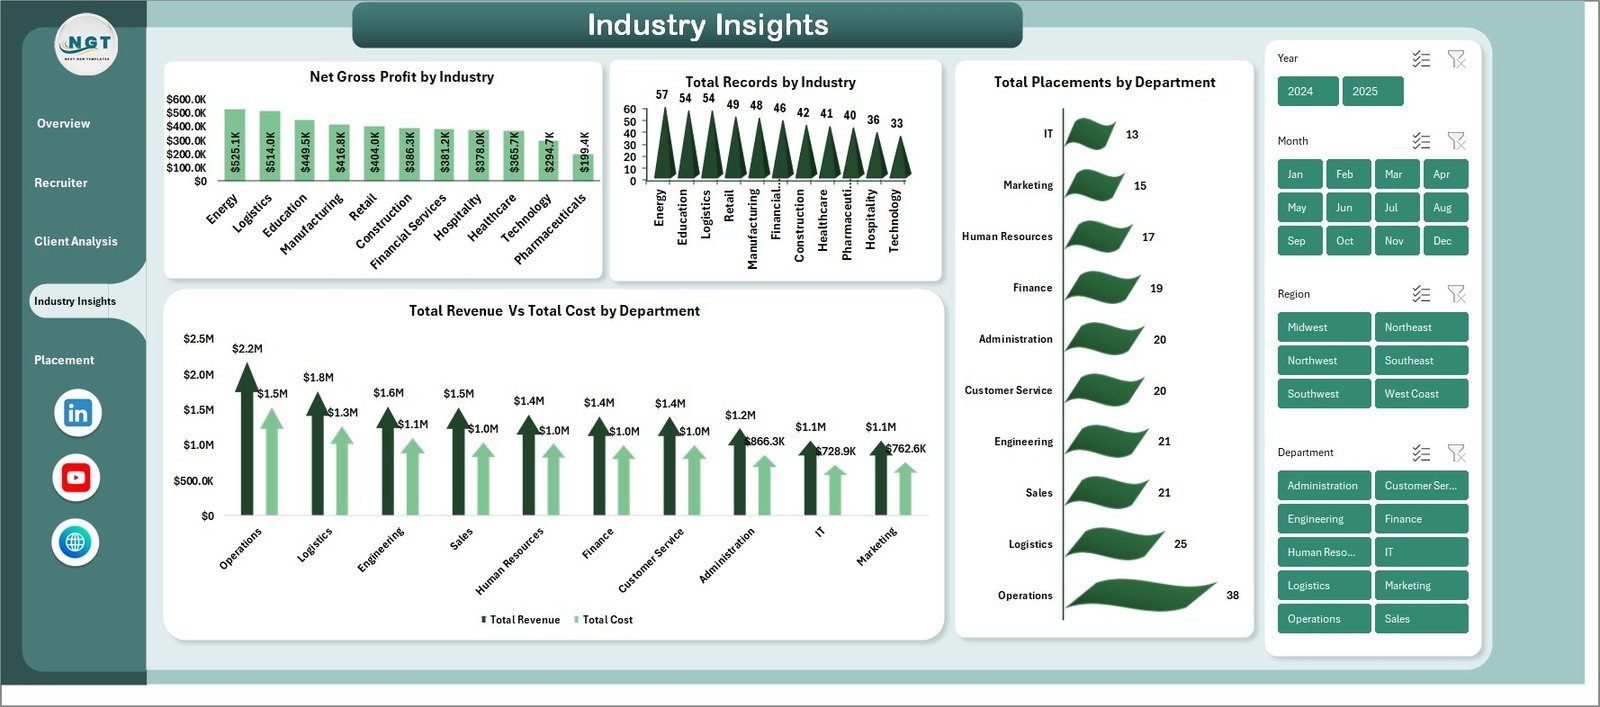
🏭 Industry Insights with Net Gross Profit by Industry, Total Records by Industry, Total Placements by Department, and Total Revenue vs Total Cost by Department
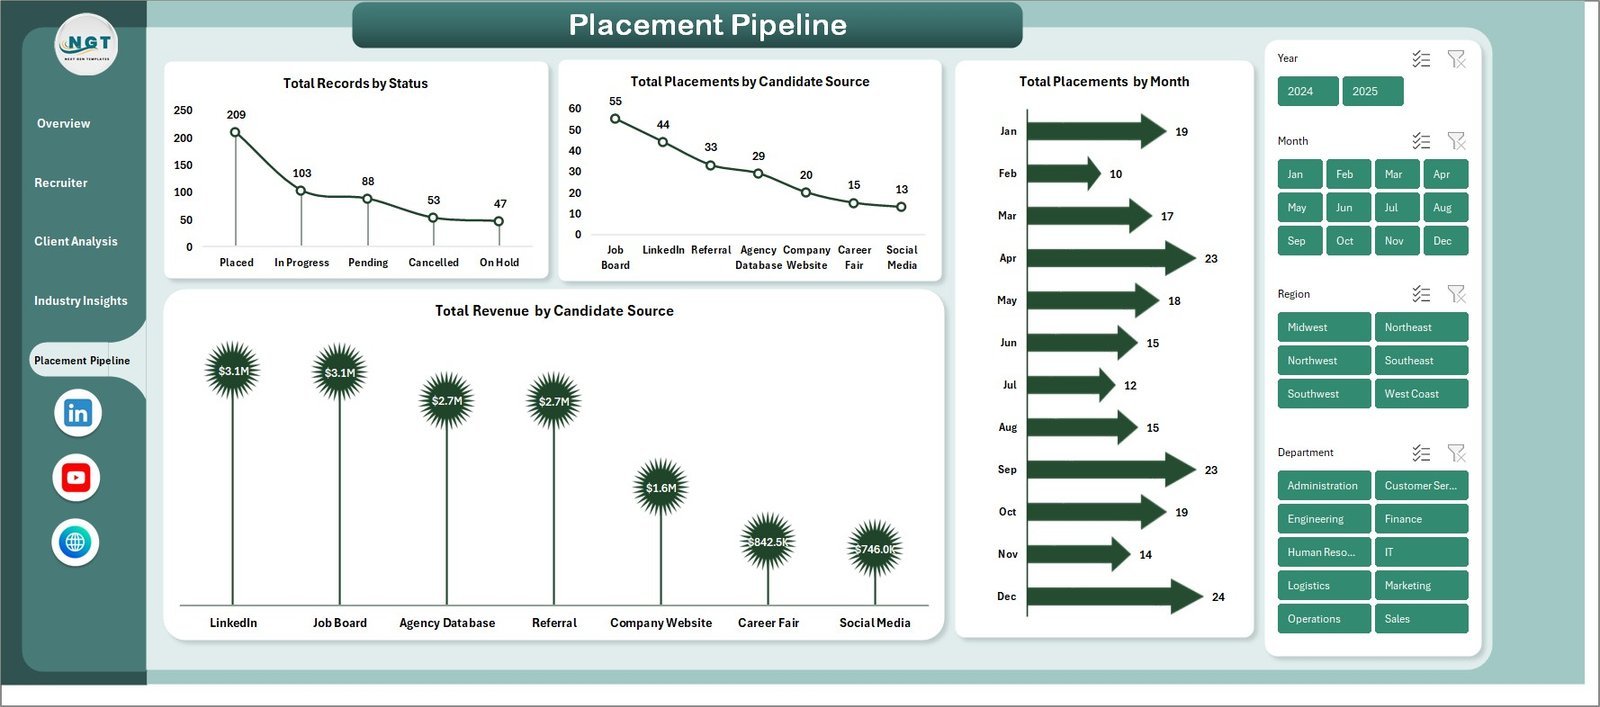
📋 Placement Pipeline tracking Total Records by Status, Total Placements by Candidate Source, Total Placements by Month, and Total Revenue by Candidate Source
🔄 Pivot-table-driven Support Sheet — refresh all data with one click from the Data tab in the Excel Ribbon
Staffing Agency Dashboard in Excel
📦 What’s Inside the Staffing Agency Dashboard in Excel
This template includes 7 sheet tabs designed to give you full visibility into your staffing agency operations:
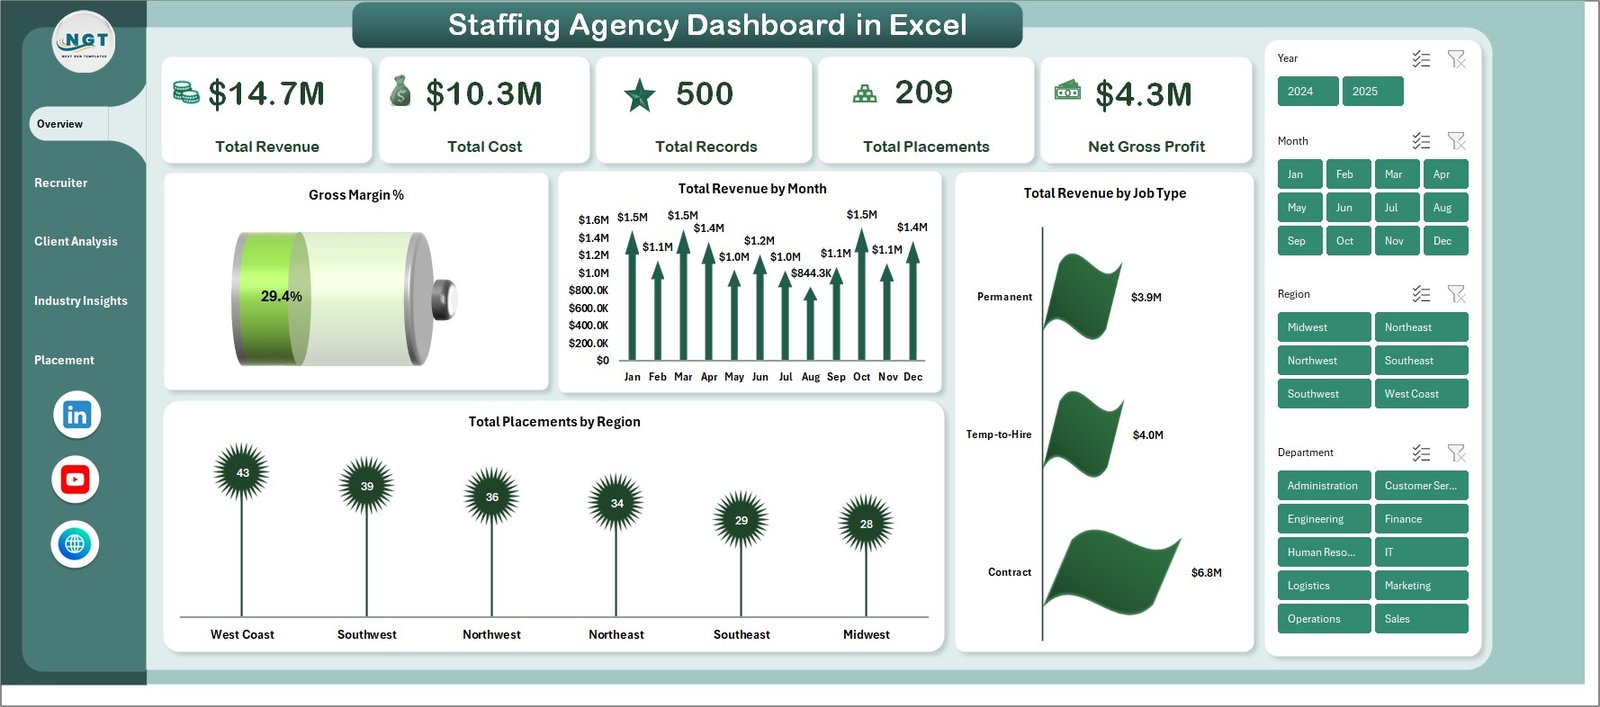
📌 Overview Page — Displays 5 high-level KPI cards (Total Revenue, Total Cost, Total Records, Total Placements, Net Gross Profit) along with charts for Gross Margin%, Total Revenue by Month, Total Revenue by Job Type, and Total Placements by Region. Multiple slicers allow you to filter the entire dashboard instantly.
📌 Recruiter Performance — Breaks down recruiter-level metrics including Net Gross Profit by Recruiter, Average Satisfaction by Recruiter, and Average Time To Fill by Recruiter so you can identify your top performers and coaching opportunities.
📌 Client Analysis — Compares Total Records vs Total Placements by Client Company, visualizes Total Revenue by Industry, and tracks Average Satisfaction by Client Company to help you prioritize your most profitable relationships.
📌 Industry Insights — Analyzes Net Gross Profit by Industry, Total Records by Industry, Total Placements by Department, and Total Revenue vs Total Cost by Department for strategic market positioning.
📌 Placement Pipeline — Tracks Total Records by Status, Total Placements by Candidate Source, Total Placements by Month, and Total Revenue by Candidate Source to optimize your sourcing strategy.
📌 Data Sheet — The central data entry point. Add your staffing records in the provided format and all dashboard pages update automatically.
📌 Support Sheet — Contains all pivot tables powering the dashboard. After updating data, simply click Refresh All from the Data tab. You can keep this sheet hidden.
⚙️ How to Use the Staffing Agency Dashboard in Excel
1️⃣ Download and Open — Unzip the file and open it in Microsoft Excel (2016 or later recommended).
2️⃣ Go to the Data Sheet — Replace the sample data with your own staffing records in the same column format.
3️⃣ Refresh the Dashboard — Navigate to the Data tab in the Excel Ribbon and click “Refresh All” to update all pivot tables and charts.
4️⃣ Explore Each Page — Use the sheet tabs to navigate between Overview, Recruiter Performance, Client Analysis, Industry Insights, and Placement Pipeline.
5️⃣ Apply Slicers — Use the built-in slicers to filter by region, job type, industry, recruiter, or any other available dimension.
👥 Who Can Benefit from This Staffing Agency Dashboard in Excel
🔹 Staffing Agency Owners & Directors
🔹 Recruitment Operations Managers
🔹 Account Managers & Client Relationship Leads
🔹 HR Directors overseeing outsourced recruitment
🔹 Finance Teams tracking staffing revenue and margins
🔹 Business Development Professionals in staffing firms
🔹 Freelance Recruiters managing their own placement data
❓ Frequently Asked Questions
What KPIs does the Staffing Agency Dashboard in Excel track?
The Staffing Agency Dashboard in Excel tracks 5 key performance indicators on the Overview page: Total Revenue, Total Cost, Total Records, Total Placements, and Net Gross Profit. Additional metrics like Gross Margin%, Average Satisfaction, and Average Time To Fill are tracked across the Recruiter Performance, Client Analysis, Industry Insights, and Placement Pipeline pages.
Do I need advanced Excel skills to use this staffing dashboard?
No. Simply replace the sample data in the Data Sheet with your own records and click Refresh All from the Data tab. All charts, KPI cards, and pivot tables update automatically. No VBA or macros required.
Can I filter the dashboard by recruiter, client, or industry?
Yes. The dashboard includes multiple slicers on the Overview page that let you filter data by region, job type, industry, recruiter, and more. Each analysis page also provides focused breakdowns for recruiter-level, client-level, and industry-level insights.
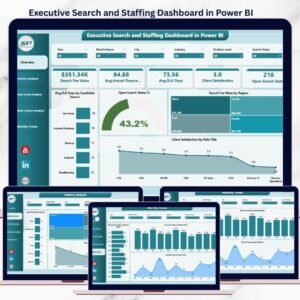
What is the difference between this template and the Executive Search and Staffing Dashboard?
This Staffing Agency Dashboard focuses on agency-wide placement pipeline, revenue tracking, recruiter performance, and client analysis with 5 dedicated pages. The Executive Search and Staffing Dashboard offers a different analytical perspective. Both complement each other for comprehensive staffing analytics.
Is this template compatible with Google Sheets?
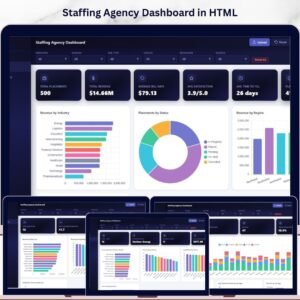
This template is designed for Microsoft Excel and uses pivot tables and slicers which work best in Excel 2016 or later. For a browser-based alternative, check out the Staffing Agency Dashboard in HTML which runs directly in any web browser.
🔗 Explore Related Templates
🔹 Staffing Agency Dashboard in HTML — Browser-based staffing analytics with interactive filters and CSV export
🔹 Recruitment Agencies KPI Dashboard in Excel — Focused KPI scorecard for recruitment agencies
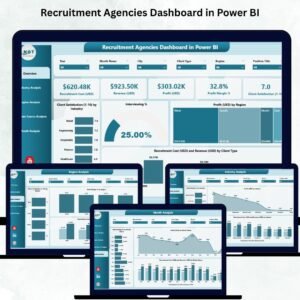
🔹 Recruitment Agencies Dashboard in Excel — Comprehensive recruitment analytics with placement tracking
📖 Click here to read the Detailed Blog Post<
Watch the step-by-step video tutorial:
/h3>











Reviews
There are no reviews yet.