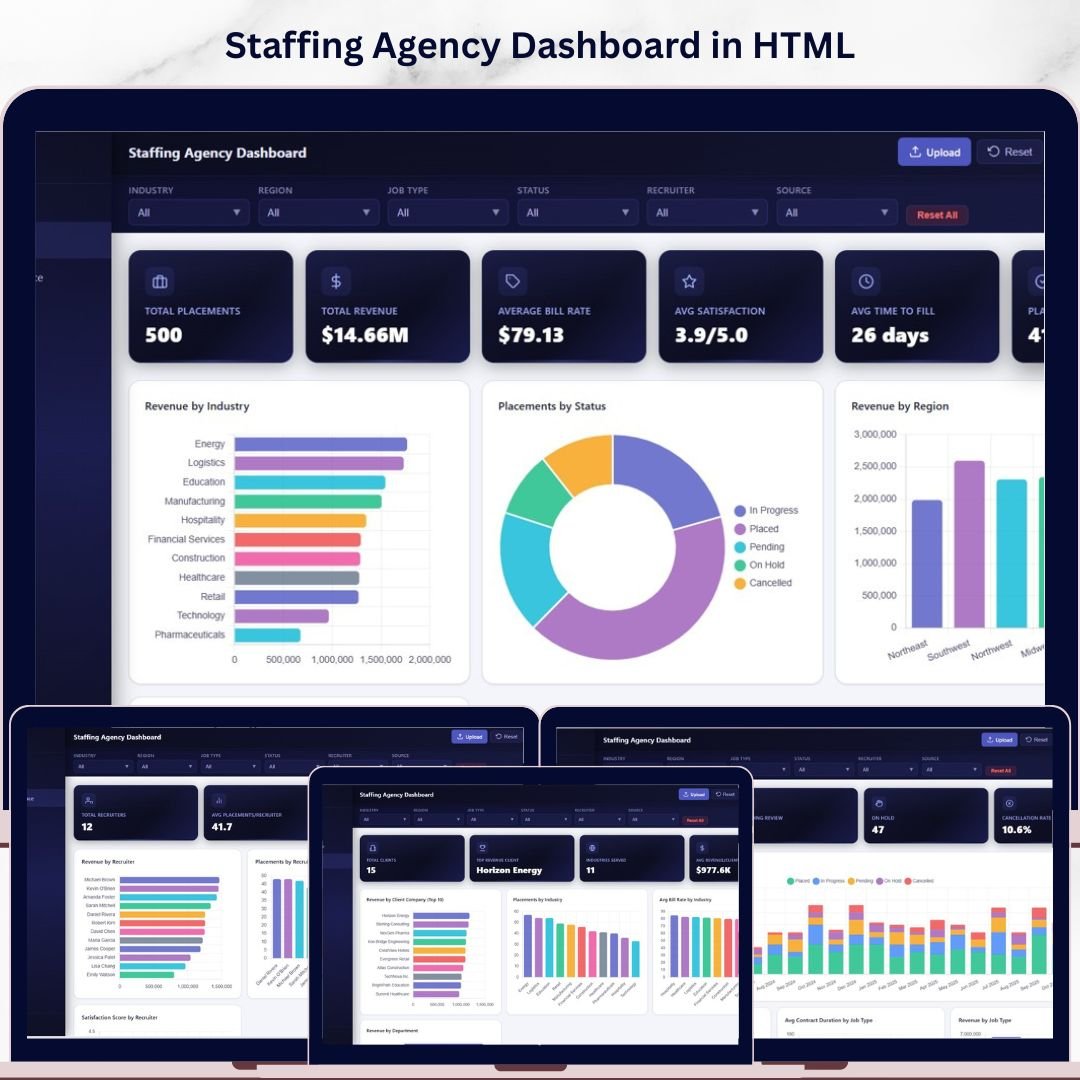
Staffing Agency Dashboard in HTML is the ultimate browser-based analytics solution designed specifically for staffing and recruitment agencies that want instant visibility into placements, revenue, recruiter performance, and client pipelines — without installing any software. This self-contained HTML dashboard runs directly in your web browser, making it one of the fastest and most accessible ways to analyze your agency’s key metrics in real time. 🚀
Whether you manage a small boutique staffing firm or a large-scale recruitment operation, this dashboard consolidates critical data points like total placements, average bill rate, placement rate, and average satisfaction into 5 interactive pages. With built-in slicers and filters, you can drill into the data by recruiter, industry, region, job type, and candidate source — helping you uncover hidden patterns and make smarter hiring decisions every day. If you’ve been searching for a professional HTML dashboard template tailored for staffing agencies, your search ends here.
🔑 Key Features of Staffing Agency Dashboard in HTML
✨ 5 Interactive Dashboard Pages covering Overview, Recruiter Performance, Client & Industry Analysis, Placement Pipeline, and Data View
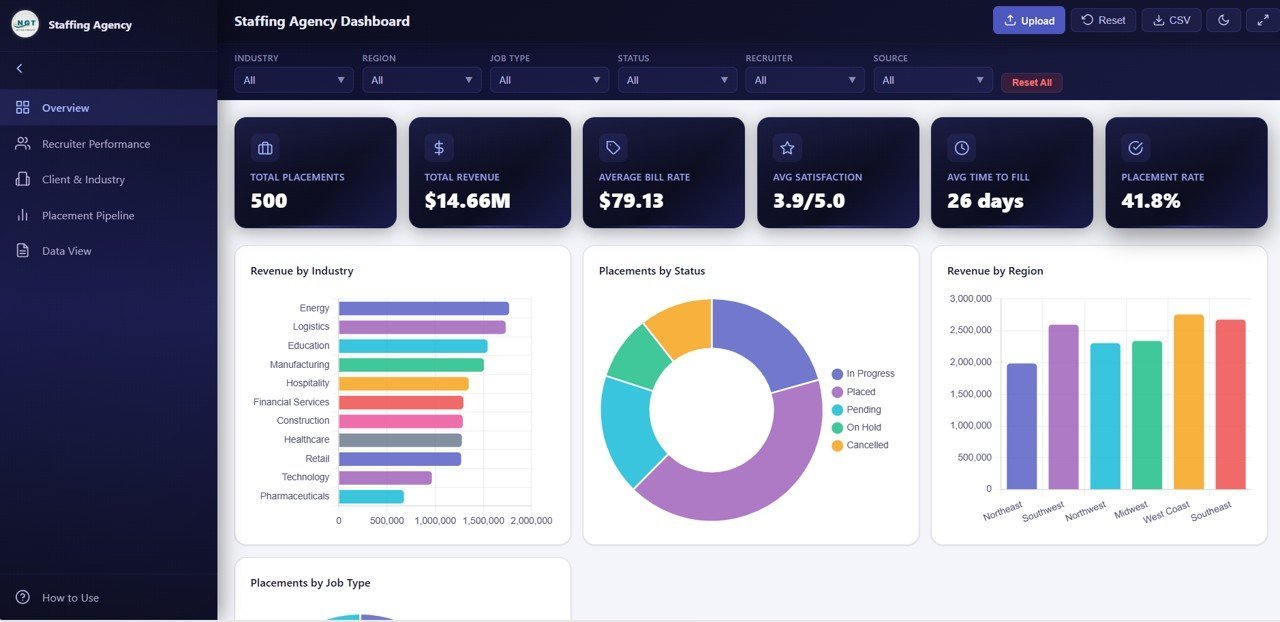
📊 6 KPI Cards on the Overview page — Total Placements, Total Revenue, Average Bill Rate, Avg Satisfaction, Avg Time to Fill, and Placement Rate
📈 Multiple dynamic charts including Revenue by Industry, Placements by Status, Revenue by Region, Placements by Job Type, and Monthly Revenue Trend
🔍 Advanced filtering with slicers to quickly analyze data by recruiter, industry, region, and time period
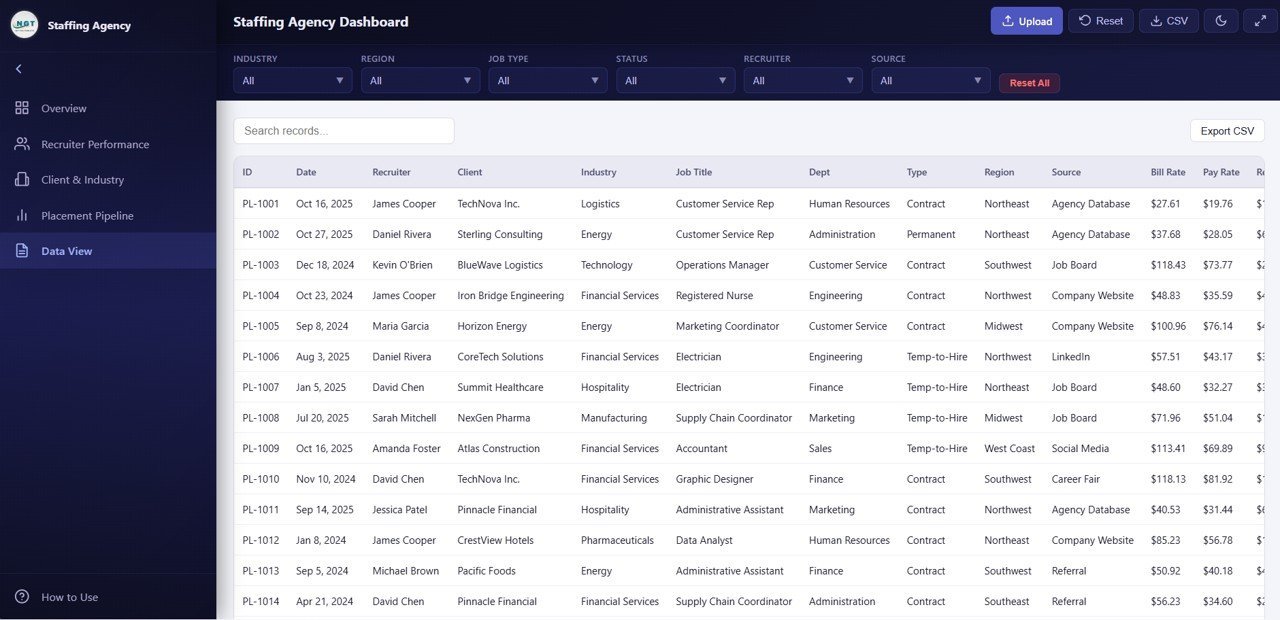
📋 Detailed Data View page with search, sort, pagination, and CSV export functionality
🌐 Runs 100% in-browser — no installation, no dependencies, just open and analyze
🎨 Clean, modern SaaS-style design with professional color schemes and responsive layout
 Overview
📦 What’s Inside the Staffing Agency Dashboard in HTML
This dashboard includes 5 professionally designed pages, each built to deliver specific analytical insights for staffing agency operations:
📌 Overview Page — The central command center of the dashboard. It displays 6 KPI cards at the top showing Total Placements, Total Revenue, Average Bill Rate, Avg Satisfaction, Avg Time to Fill, and Placement Rate. Below the cards, you’ll find 5 charts: Revenue by Industry, Placements by Status, Revenue by Region, Placements by Job Type, and Monthly Revenue Trend. Multiple slicers let you filter the entire dashboard instantly.
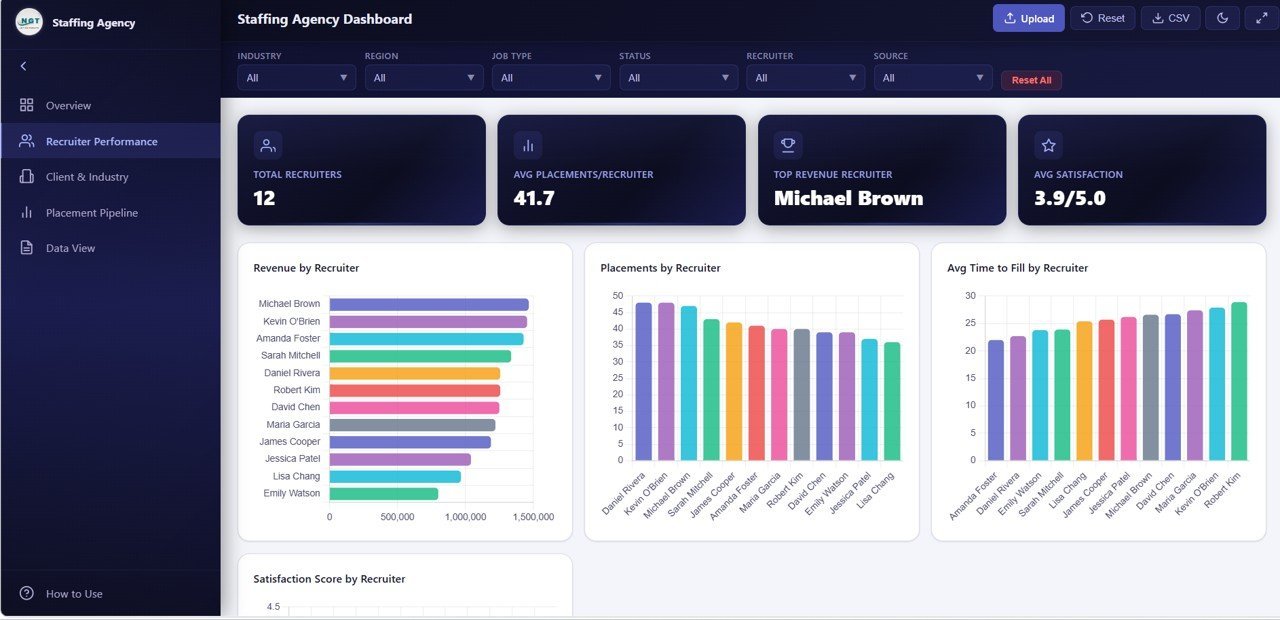
📌 Recruiter Performance Page — Evaluate individual recruiter contributions with 4 detailed charts: Revenue by Recruiter, Placements by Recruiter, Avg Time to Fill by Recruiter, and Satisfaction Score by Recruiter. This page helps agency managers identify top performers and those who need coaching — all backed by data.
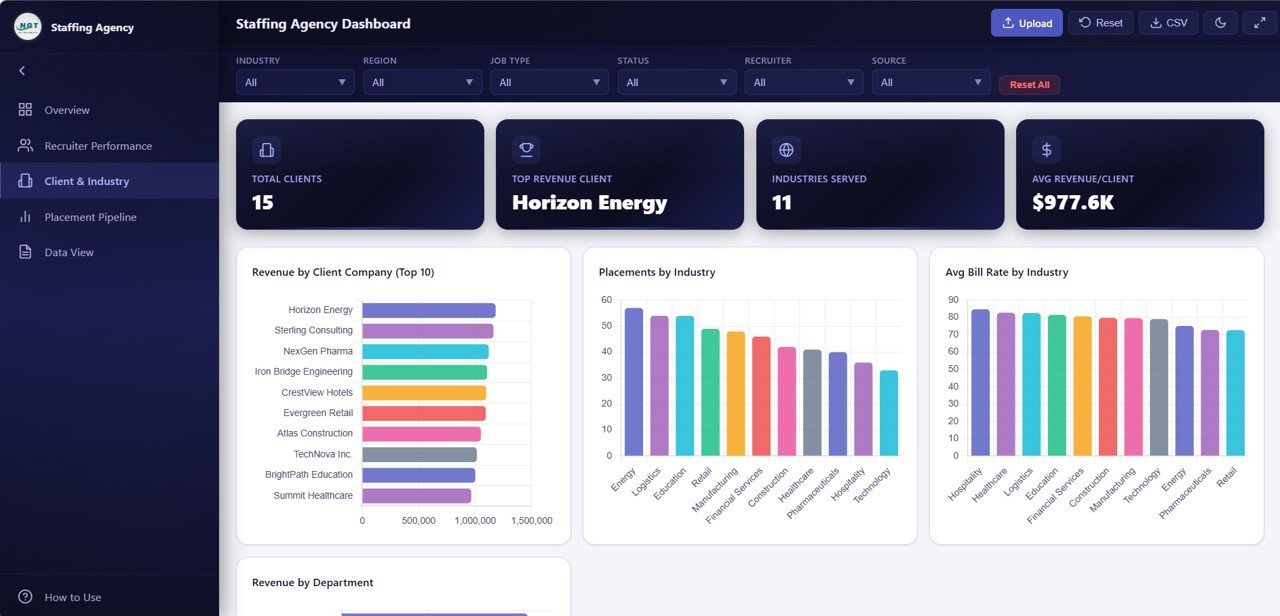
📌 Client and Industry Analysis Page — Understand revenue distribution and placement patterns across your client base and industries. This page features 4 charts: Revenue by Client Company, Placements by Industry, Avg Bill Rate by Industry, and Revenue by Department. Agencies can use this to identify their most profitable clients and high-demand industry sectors.
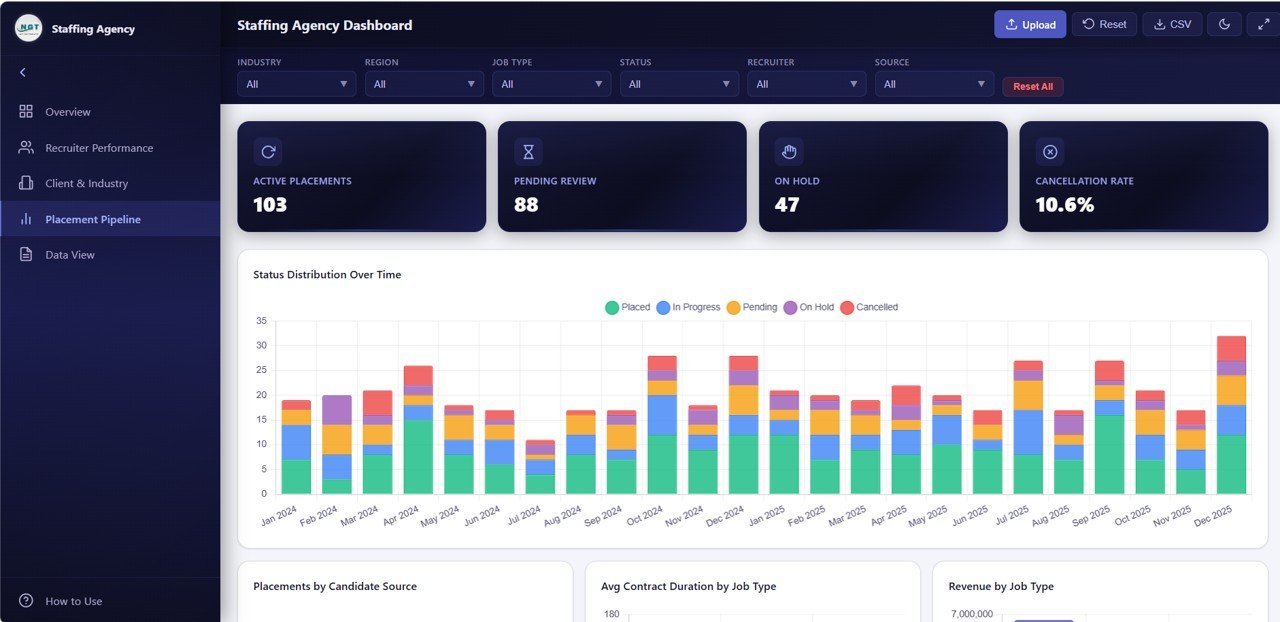
📌 Placement Pipeline Page — Track your placement funnel with 4 insightful charts: Status Distribution Over Time, Placements by Candidate Source, Avg Contract Duration by Job Type, and Revenue by Job Type. This page is essential for understanding which sourcing channels deliver the best candidates and which job types generate maximum revenue.
📌 Data View Page — This is the detailed data table page where you can see all records with search, sort, and pagination features. You can also export the filtered data to CSV for further analysis in Excel or other tools. It provides complete transparency into every placement record in your dataset.
This staffing analytics dashboard includes a total of 5 pages with over 20 charts and visualizations, 6 KPI summary cards, interactive slicers, and a full data table view — making it one of the most comprehensive HTML staffing templates available. If you need a similar solution in Excel, check out the Recruitment Agencies KPI Dashboard in Excel or the Executive Search & Staffing KPI Dashboard in Power BI.
⚙️ How to Use the Staffing Agency Dashboard in HTML
1️⃣ Unzip the downloaded file to a folder on your computer
2️⃣ Open the index.html file in any modern web browser (Chrome, Edge, Firefox)
3️⃣ Replace the sample data in the data file with your agency’s actual placement data
4️⃣ Use the slicers and filters to explore data by recruiter, industry, region, or time period
5️⃣ Navigate between the 5 pages using the tab navigation at the top
6️⃣ Export filtered data from the Data View page as CSV for offline analysis
No coding skills are required. The dashboard is fully self-contained and works offline — simply update your data and open the file to see instant results.
👥 Who Can Benefit from This Staffing Agency Dashboard in HTML
🏢 Staffing & Recruitment Agencies — Track placements, revenue, and recruiter performance in one view
👔 HR Consultants & Talent Firms — Present data-driven insights to clients professionally
📊 Agency Operations Managers — Monitor pipeline health and identify bottlenecks
💼 Business Development Teams — Analyze client profitability and industry trends
🧑💻 Freelance Recruiters — Track personal performance and placement metrics
📈 Staffing Company Owners — Get complete financial and operational visibility
❓ Frequently Asked Questions
What metrics does the Staffing Agency Dashboard in HTML track?
The Staffing Agency Dashboard in HTML tracks 6 key metrics including Total Placements, Total Revenue, Average Bill Rate, Average Satisfaction, Average Time to Fill, and Placement Rate. It also provides detailed analysis through over 20 charts across 5 dashboard pages covering recruiter performance, client and industry analytics, placement pipeline, and raw data views.
Do I need any special software to use this HTML dashboard?
No. This dashboard runs entirely in your web browser. Simply unzip the file, open index.html in Chrome, Edge, or Firefox, and start analyzing. No installation, no plugins, and no internet connection required after download.
Can I customize the data in this staffing dashboard?
Yes. The dashboard reads data from an included data file. You can replace the sample records with your own staffing data — including recruiter names, client companies, industries, bill rates, and placement statuses — and the charts will update automatically when you refresh the page.
What is the best dashboard template for staffing agencies?
The Staffing Agency Dashboard in HTML by NextGenTemplates is one of the best options available. It includes 5 interactive pages, 6 KPI cards, 20+ charts, advanced filtering, and CSV export — all running in a browser with zero dependencies. For agencies preferring desktop tools, the Recruitment Agencies Dashboard in Excel and Power BI versions are also available.
Is this template suitable for small staffing firms?
Absolutely. Whether you have 5 recruiters or 50, the dashboard scales with your data. The slicer-based filtering lets you drill into specific recruiters, industries, and time periods regardless of data volume.
🔗 Explore Related Templates
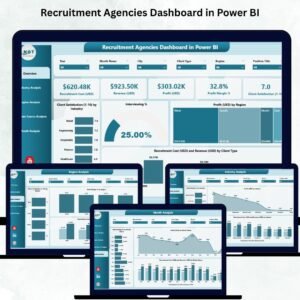
🔹 Recruitment Agencies Dashboard in Power BI — 5-page Power BI version with industry, region, and candidate source analysis
🔹 Recruitment Agencies Dashboard in Excel — Excel version with pivot-based analysis and dynamic slicers
🔹 Recruitment Agencies KPI Dashboard in Power BI — MTD and YTD KPI tracking with target vs actual comparison
📖 Click here to read the Detailed Blog Post<
Watch the step-by-step video tutorial:
/h3>


Reviews
There are no reviews yet.