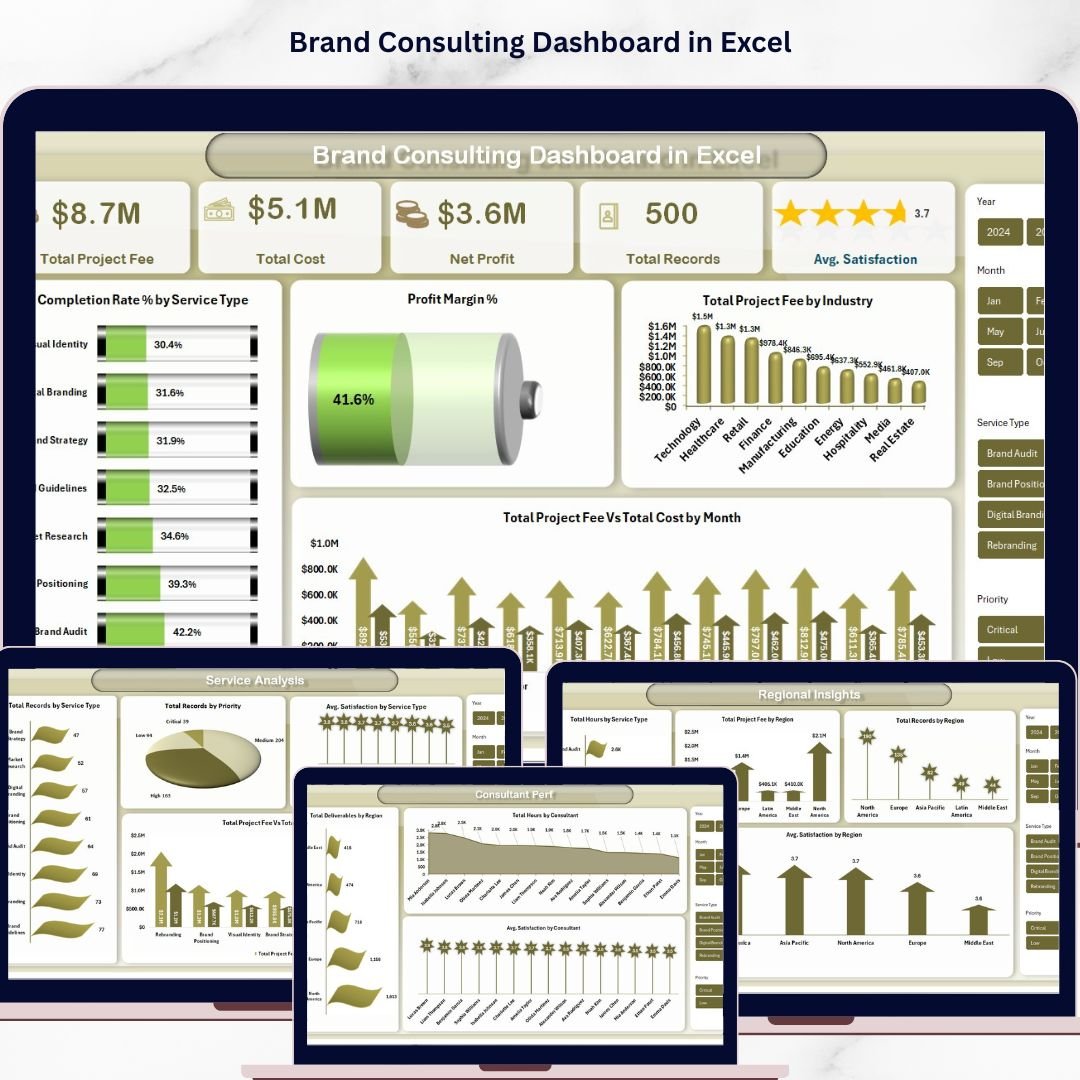


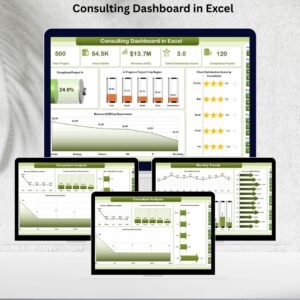
Brand Consulting Dashboard in Excel is a powerful, pivot-driven analytics tool built for brand consultants, marketing agency owners, and strategy professionals who need instant visibility into project fees, profitability, service analysis, regional insights, and consultant performance. This interactive Excel dashboard includes 5 dedicated analysis pages plus a Data Sheet and Support Sheet — giving you a complete 360-degree picture of your brand consulting operations.
Whether you are a Brand Consultant, Marketing Director, Agency Owner, or Strategy Lead, this ready-to-use template lets you analyze completion rates by service type, track profit margins, compare project fees across industries, and monitor consultant satisfaction scores — all from a single Excel workbook that auto-updates with pivot tables. Explore more Excel Dashboard Templates from our collection.
🔑 Key Features of Brand Consulting Dashboard in Excel
📊 5 Interactive Dashboard Pages + Data & Support Sheets — Overview, Service Analysis, Regional Insights, Consultant Performance, and Project Tracking for comprehensive brand consulting analytics
📈 5 High-Level KPI Cards — Total Project Fee, Total Cost, Net Profit, Total Records, and Avg. Satisfaction displayed prominently on the overview page for instant business insights
🔍 15+ Dynamic Charts & Visualizations — Including Completion Rate % by Service Type, Profit Margin %, Total Project Fee by Industry, Total Project Fee vs Total Cost by Month, and many more across all pages
🎛️ Multiple Slicer Filters — Apply quick filters across the dashboard to drill down into specific service types, regions, consultants, or time periods
📋 Pivot-Driven Architecture — All charts are powered by pivot tables in the Support Sheet. Simply update data and click Refresh All to update the entire dashboard dynamically
🌐 Works in Microsoft Excel — Compatible with Excel 2016 and later. No macros or VBA required — pure pivot table and chart functionality
🎨 Professional Design — Clean, modern interface with consistent color scheme and well-organized layouts across all dashboard pages
📦 What’s Inside the Brand Consulting Dashboard in Excel
This dashboard template contains 5 fully interactive analysis pages plus a Data Sheet and Support Sheet designed for brand consulting professionals:
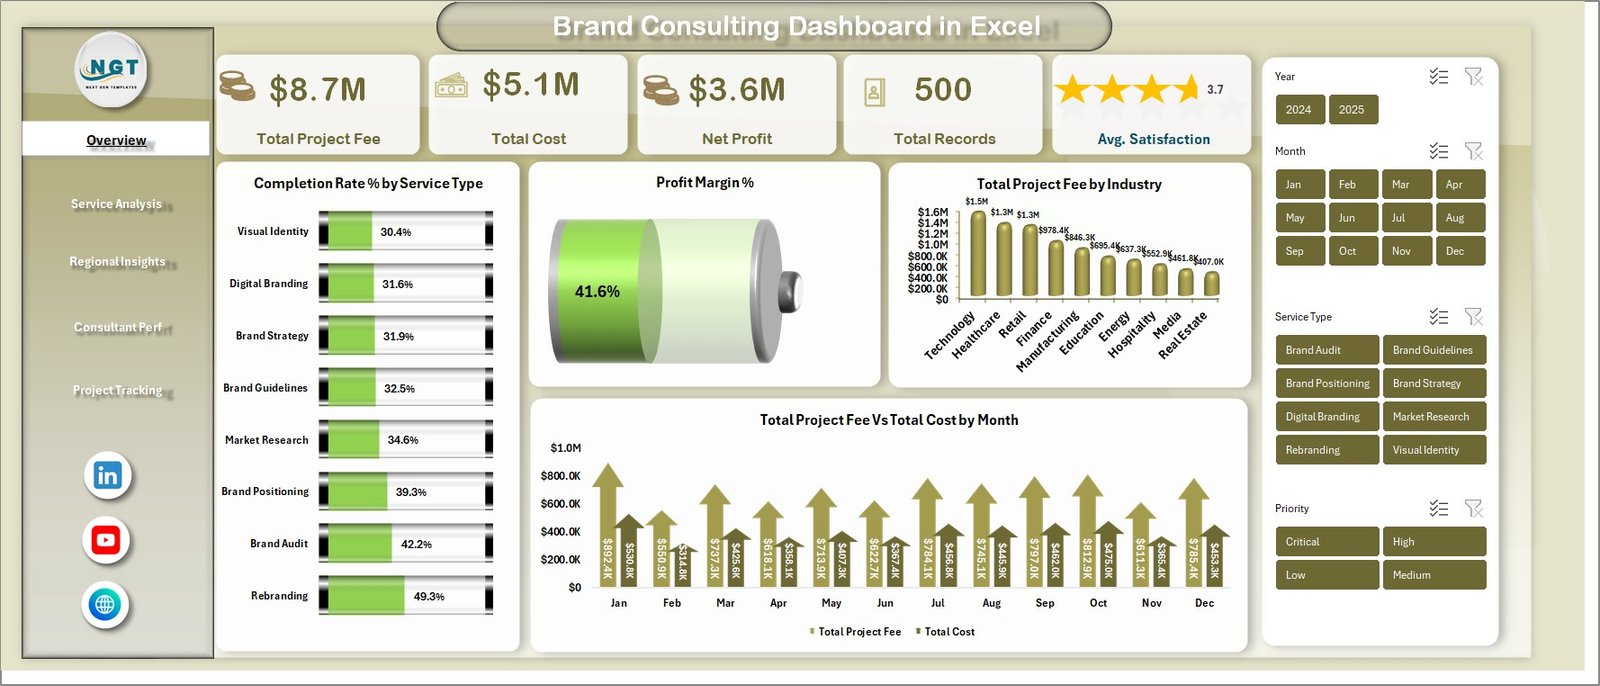
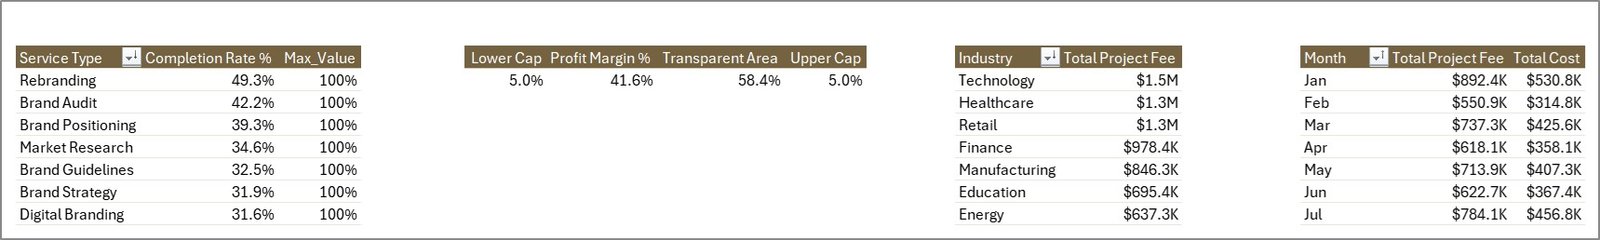
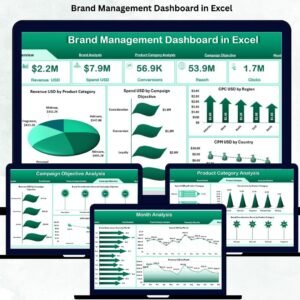
📌 1 — Overview Page — Displays all high-level KPI cards including Total Project Fee, Total Cost, Net Profit, Total Records, and Avg. Satisfaction. Features charts showing Completion Rate % by Service Type, Profit Margin %, Total Project Fee by Industry, and Total Project Fee vs Total Cost by Month. Multiple slicers let you filter the entire dashboard instantly.
 Brand Consulting Dashboard in Excel – Overview Page
📌 2 — Service Analysis — Deep dive into service-level metrics showing Total Records by Service Type, Total Records by Priority, Avg. Satisfaction by Service Type, and Total Project Fee vs Total Cost by Service Type.
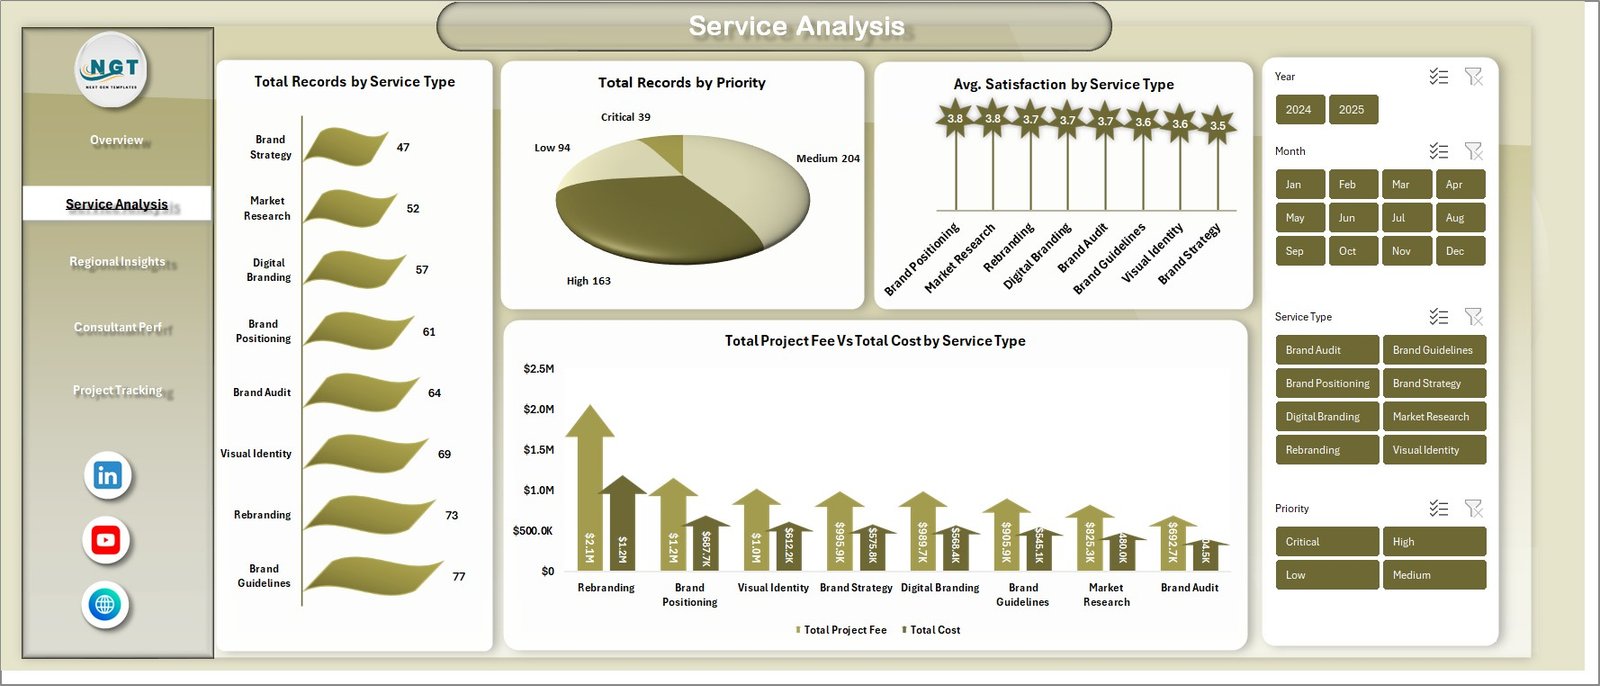 Service Analysis Page
📌 3 — Regional Insights — Geographic performance analysis featuring Total Hours by Service Type, Total Project Fee by Region, Total Records by Region, and Avg. Satisfaction by Region.
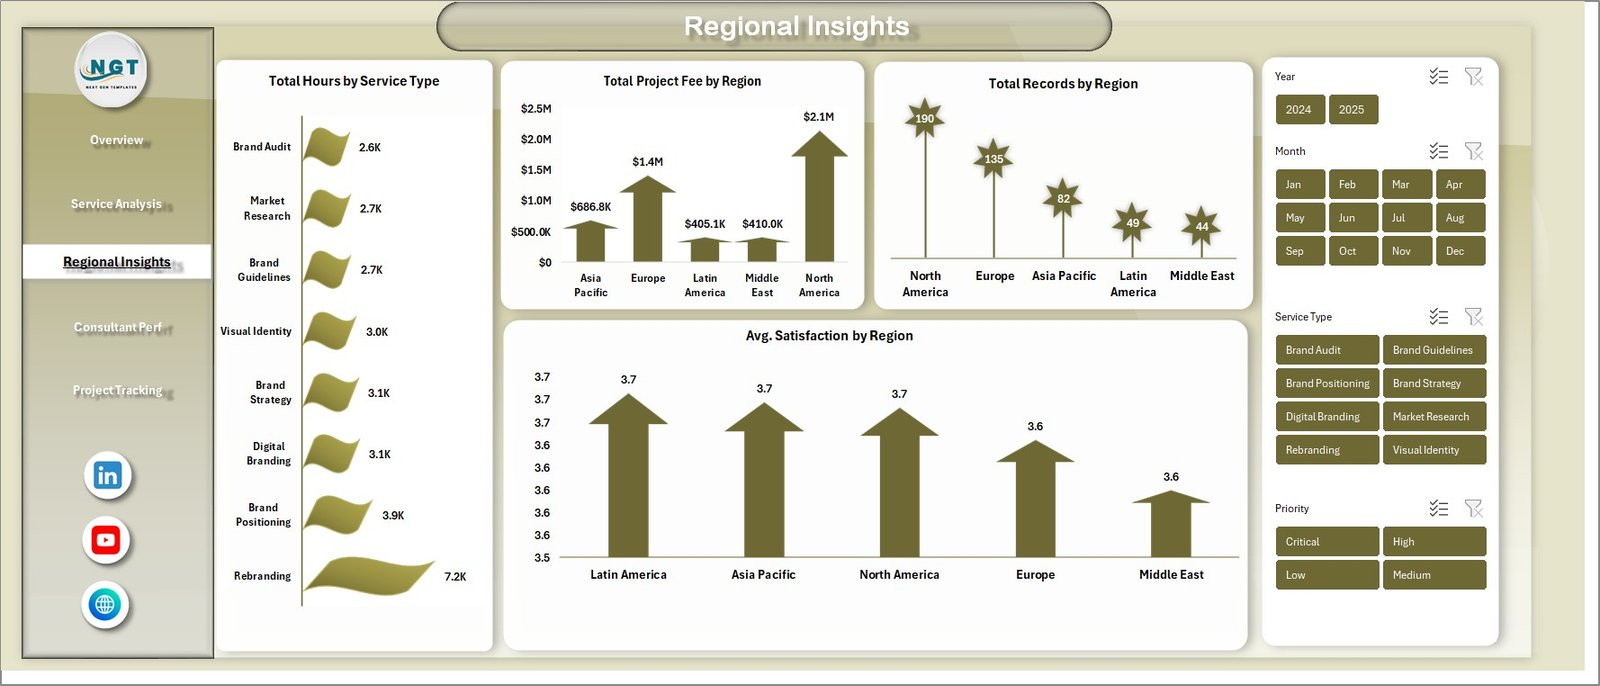 Regional Insights Page
📌 4 — Consultant Performance — Track team productivity with Total Deliverables by Region, Total Hours by Consultant, and Avg. Satisfaction by Consultant.
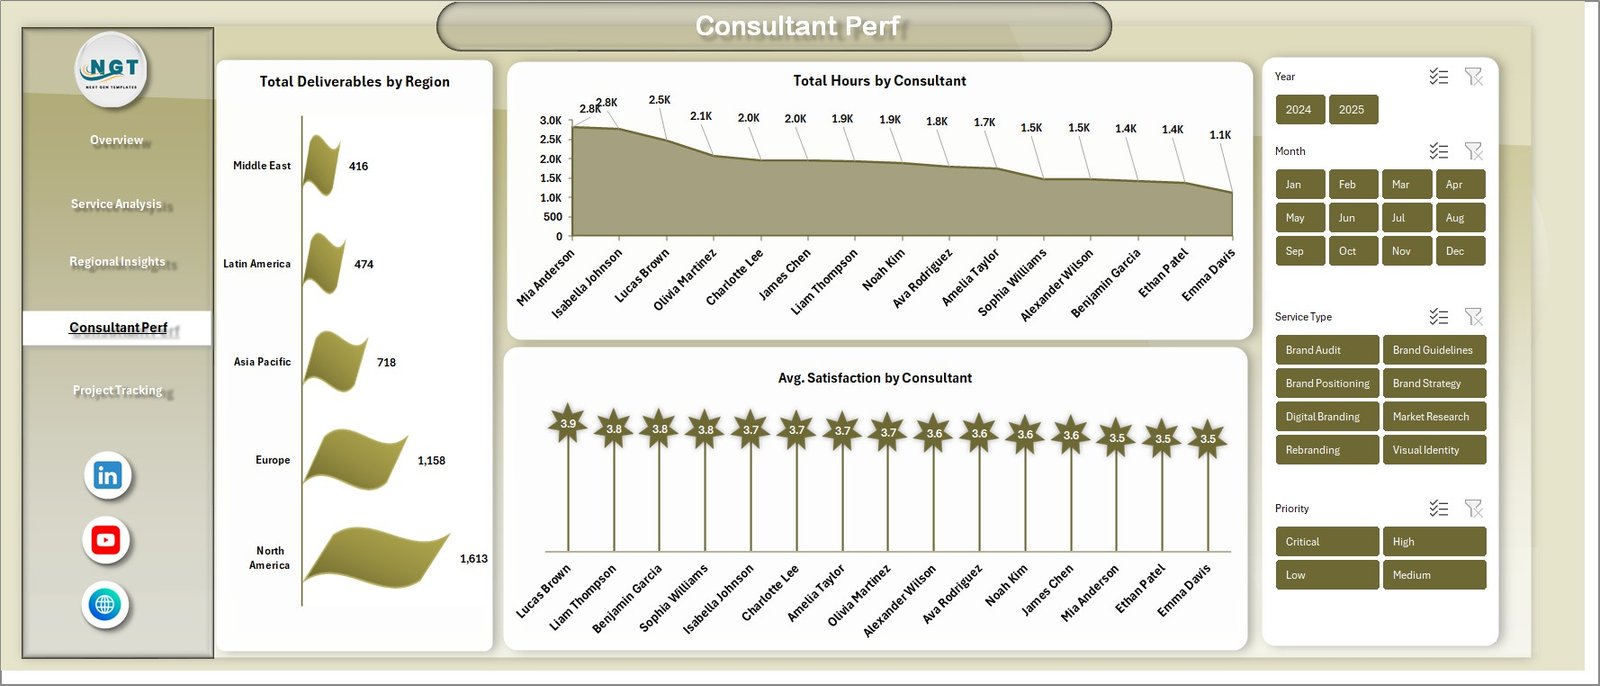 Consultant Performance Page
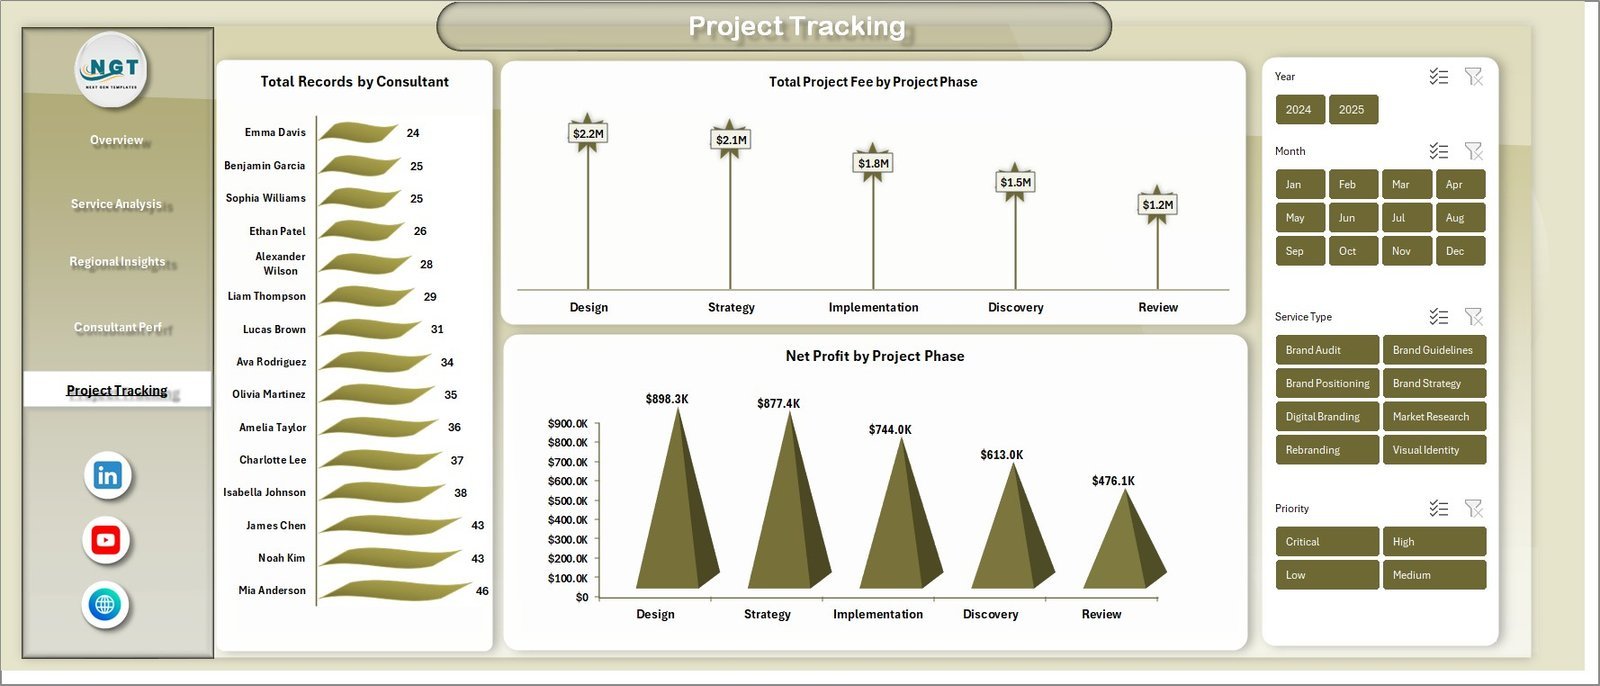
📌 5 — Project Tracking — Monitor project lifecycle metrics including Total Records by Consultant, Total Project Fee by Project Phase, and Net Profit by Project Phase.
 Project Tracking Page
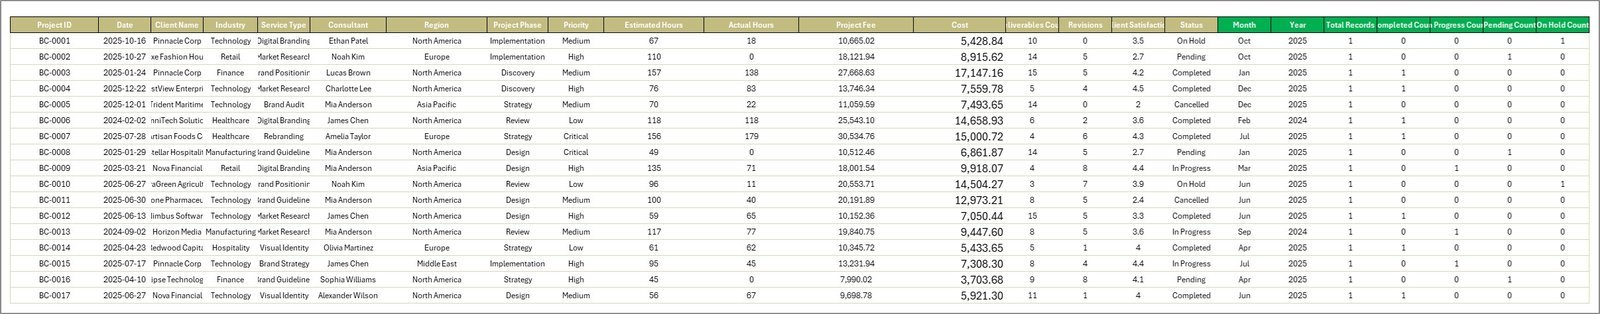
📌 6 — Data Sheet Tab — This is the Data Sheet where you add your consulting engagement data in the same format. Replace the sample data with your own records and the entire dashboard updates automatically.
 Data Sheet Tab
📌 7 — Support Sheet — Contains multiple pivot tables that power the entire dashboard dynamically. Go to the Data tab in the Excel Ribbon and click on Refresh All after updating the data. All pivots and charts will be refreshed. You can keep this sheet hidden.
 Support Sheet Tab
⚙️ How to Use the Brand Consulting Dashboard in Excel
1️⃣ Download and Open — Download the template and open the Excel file in Microsoft Excel 2016 or later
2️⃣ Explore the Dashboard — Navigate through all 5 analysis pages using the sheet tabs to explore different analytics views
3️⃣ Apply Slicer Filters — Use the slicers on the Overview page to filter by service type, region, consultant, or time period
4️⃣ Replace Sample Data — Go to the Data Sheet tab and replace the sample data with your own consulting engagement data in the same format
5️⃣ Refresh All — Go to the Data tab in the Excel Ribbon and click Refresh All to update all pivot tables and charts automatically
6️⃣ Hide Support Sheet — Right-click the Support Sheet tab and select Hide to keep the workbook clean for presentations
👥 Who Can Benefit from This Brand Consulting Dashboard
🔹 Brand Consultants — Track project fees, profitability, and client satisfaction across all engagements
🔹 Marketing Agency Owners — Monitor agency performance, regional revenue, and consultant utilization
🔹 Marketing Directors — Get a high-level overview of service performance and project phase profitability
🔹 Strategy Leads — Analyze completion rates, profit margins, and satisfaction scores by service type
🔹 Project Managers — Track project phases, consultant hours, and deliverables across regions
🔹 Freelance Brand Strategists — Manage multiple client engagements and monitor project fee vs cost analysis
❓ Frequently Asked Questions
What KPIs does the Brand Consulting Dashboard in Excel track?
The Brand Consulting Dashboard in Excel tracks 5 key performance indicators on the overview page: Total Project Fee, Total Cost, Net Profit, Total Records, and Avg. Satisfaction. Additional metrics across 5 analysis pages include Completion Rate by Service Type, Profit Margin %, Project Fee by Industry, Fee vs Cost by Month, Records by Priority, Satisfaction by Region, Hours by Consultant, Deliverables by Region, and Net Profit by Project Phase.
Do I need VBA or macros to use this Excel dashboard?
No. This dashboard is built entirely on pivot tables and standard Excel charts. No macros or VBA are required. Simply open the file, update the Data Sheet with your records, and click Refresh All in the Data tab to update all charts automatically.
Can I customize this brand consulting dashboard with my own data?
Yes. Go to the Data Sheet tab and replace the sample data with your own consulting engagement records in the same column format. Then go to the Data tab in the Excel Ribbon and click Refresh All. All pivot tables in the Support Sheet will refresh and all charts across all 5 dashboard pages will update automatically.
Is this template suitable for marketing agencies managing multiple clients?
Absolutely. The Brand Consulting Dashboard includes dedicated pages for Service Analysis, Regional Insights, and Consultant Performance that let you track metrics across multiple clients, regions, and team members simultaneously. The slicer filters make it easy to isolate data for specific service types or consultants.
What is the best Excel dashboard template for brand consulting?
The Brand Consulting Dashboard in Excel from NextGenTemplates is the best Excel dashboard template for brand consulting professionals. It includes 5 interactive analysis pages, 15+ charts, 5 KPI cards, pivot-driven architecture, slicer filters, and dedicated Data and Support sheets — all in a professional Excel workbook that requires no macros.
🔗 Explore Related Templates
🔹 E-commerce Dashboard in HTML — Interactive HTML dashboard for tracking online store performance, sales analytics, and customer metrics
🔹 Customer Satisfaction Dashboard in HTML — Browser-based dashboard for monitoring customer feedback, NPS scores, and satisfaction trends
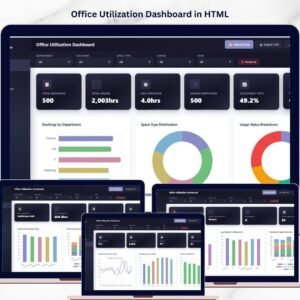
🔹 Office Utilization Dashboard in HTML — Comprehensive HTML dashboard for tracking workspace usage, team productivity, and resource optimization
📖 Click here to read the Detailed Blog Post
Watch the step-by-step video tutorial:


Reviews
There are no reviews yet.