



Key Features of Luxury Retail KPI Scorecard
Introducing the Luxury Retail KPI Scorecard – a comprehensive, ready-to-use digital template designed specifically to help luxury retail businesses track, analyze, and optimize their key performance indicators (KPIs) with precision and ease. This scorecard offers a streamlined approach to performance management, enabling retailers to focus on what truly drives success.
With a clean and intuitive interface, the scorecard provides dynamic dropdown menus to select monthly, Month-to-Date (MTD), or Year-to-Date (YTD) performance views, allowing you to monitor trends and make informed decisions quickly. It visually compares actual results against targets, with color-coded indicators to highlight areas of success or concern at a glance. This ensures that managers and executives can easily spot performance gaps or achievements without sifting through complex data.
The scorecard goes beyond mere numbers by offering a comprehensive overview of all relevant KPIs-displaying MTD and YTD comparisons side-by-side, so you can evaluate both short-term and long-term performance effectively.
What’s Inside the Luxury Retail KPI Scorecard
This template includes four fully functional worksheets designed for seamless KPI management:
🛍️ Scorecard Sheet: This is the main dashboard where you can view KPI performance using dropdown menus to select month, MTD, or YTD data. It features actual vs target comparisons and clear visual indicators for quick performance assessment.

Luxury Retail KPI Scorecard
📊 KPI Trend Sheet: Select any KPI from a dropdown menu to view detailed information such as KPI group, unit, whether it’s better to be lower or higher, the formula used, and its definition. It also displays trend charts for Actual, Target, and Previous Year (PY) data for MTD and YTD.

KPI Trend Sheet
📝 Input Data Sheet: The heart of your scorecard where you enter all KPI data, including actual values, targets, and other related metrics. This sheet offers flexibility to update data regularly, ensuring your scorecard remains accurate and up-to-date.

Input Data Sheet
📚 KPI Definition Sheet: Here you define each KPI by entering its name, group, unit of measurement, formula, and a detailed description. This ensures clarity and consistency across your performance tracking.

KPI Definition sheet tab
How to Use the Luxury Retail KPI Scorecard
Getting started with the Luxury Retail KPI Scorecard is quick and effortless. Begin by entering your KPI definitions in the KPI Definition Sheet to customize the scorecard to your business metrics. Then, input actual performance data along with your targets in the Input Data Sheet.
Navigate to the Scorecard Sheet to monitor performance across various time periods using the dropdown menus. Use the visual indicators to instantly identify high-performing areas or those requiring attention. For deeper analysis, switch to the KPI Trend Sheet to examine detailed trends and comparisons for each KPI.
This digital product is designed to be user-friendly, requiring no advanced technical skills. It’s perfect for managers, analysts, and executives who want to make data-driven decisions without hassle.
Who Can Benefit from This Luxury Retail KPI Scorecard
🎯 Retail Managers looking to oversee daily and monthly store performance efficiently.
🎯 Business Analysts who need a reliable tool for tracking and interpreting KPI trends.
🎯 Executives and Owners aiming for quick insights into overall business health.
🎯 Marketing Teams monitoring campaign impact on sales and customer engagement.
🎯 Finance Departments tracking revenue and cost-related KPIs for profitability.
🎯 Consultants providing strategic recommendations based on up-to-date data.
🎯 Luxury Retail Chains seeking standardized KPI monitoring across multiple locations.
🎯 Anyone involved in luxury retail business performance looking for a professional and easy-to-use KPI tracking solution.
Click here to read the Detailed blog post.
Visit our YouTube channel to learn step-by-step video tutorials
Compatibility and Requirements
- Works in Microsoft Excel desktop (Excel 2016 or later, or Microsoft 365).
- The month, MTD and YTD views are chosen from drop-down menus. Microsoft explains these lists in Create a drop-down list.
Frequently Asked Questions
What sheets are in the Luxury Retail KPI Scorecard?
Four sheets: Scorecard, KPI Trend, Input Data and KPI Definition.
How do I see MTD and YTD results?
Pick month, MTD or YTD from the dropdown menus on the Scorecard sheet. Actual and target values sit side by side with color-coded indicators.
What does the KPI Trend sheet show?
Select a KPI to see its group, unit, type (lower or higher is better), formula and definition, with trend charts for actual, target and previous year.
Can I use my own retail KPIs?
Yes. Define each KPI on the KPI Definition sheet, then enter actual and target values on the Input Data sheet.
Is there a dashboard version?
Yes. The Luxury Retail KPI Dashboard comes in Excel, Power BI and Google Sheets.
Related Luxury Retail Templates
- Luxury Retail KPI Dashboard in Excel: a full dashboard for the same KPIs.
- Luxury Retail KPI Dashboard in Power BI: the Power BI edition.
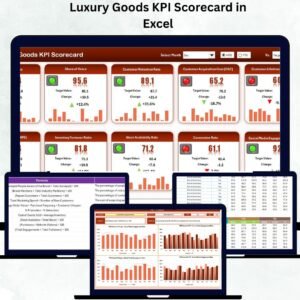
- Luxury Goods KPI Scorecard in Excel: a scorecard for luxury goods brands.
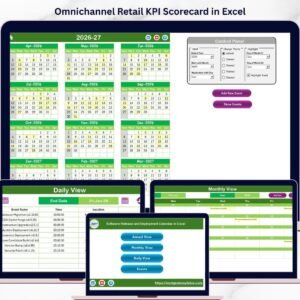
- Omnichannel Retail KPI Scorecard in Excel: for stores that also sell online.
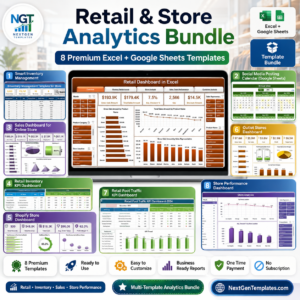
- Retail & Store Analytics Bundle: 8 retail templates in Excel and Google Sheets.
Browse all Excel KPI dashboards or the Excel sales and marketing templates.











Reviews
There are no reviews yet.