Infrastructure projects require strong planning, continuous monitoring, and data-driven decision-making. Organizations responsible for infrastructure development—such as construction companies, engineering firms, utilities providers, and government agencies—must track performance indicators regularly to ensure projects remain efficient, cost-effective, and on schedule.
However, many organizations still rely on multiple spreadsheets and manual reporting systems to track infrastructure performance. Because of this fragmented approach, project managers often struggle to identify delays, monitor operational efficiency, evaluate maintenance performance, and analyze project outcomes in real time.
Therefore, organizations increasingly adopt KPI scorecards to track infrastructure performance using structured metrics and visual indicators.
This is exactly where the Infrastructure KPI Scorecard in Google Sheets becomes extremely valuable.
The Infrastructure KPI Scorecard in Google Sheets is a ready-to-use performance monitoring template designed to help organizations track infrastructure project performance using key metrics. Instead of reviewing multiple reports, managers can monitor KPIs in a centralized and visually structured scorecard.
This powerful Google Sheets template includes automated KPI calculations, traffic-light performance indicators, trend analysis charts, and structured KPI definitions. These features transform raw operational data into meaningful insights that support better decision-making.
Because the scorecard is built in Google Sheets, teams can easily update KPI data, collaborate in real time, and monitor infrastructure performance from anywhere. Whether you manage infrastructure construction, maintenance operations, or public service projects, this scorecard helps you track performance indicators quickly and efficiently
🚀 Key Feature of Infrastructure KPI Scorecard in Google Sheets
📊 Centralized KPI Monitoring System
Track all infrastructure performance metrics in one structured KPI scorecard.
📅 Interactive Month Selection
Choose any month from the dropdown menu and instantly update the entire scorecard.
📈 MTD and YTD KPI Analysis
Evaluate both Month-to-Date and Year-to-Date performance to analyze short-term and long-term trends.
🚦 Traffic Light Performance Indicators
Green, Yellow, and Red indicators instantly highlight KPI performance levels.
📉 Performance Trend Analysis
Analyze KPI performance trends using visual charts and structured historical data.
⚡ Automated KPI Calculations
The template automatically calculates KPI performance and percentage changes.
📋 Structured KPI Definition Framework
Maintain consistent KPI definitions including formulas, units, and KPI categories.
☁️ Cloud-Based Collaboration
Google Sheets allows teams to update and monitor infrastructure KPIs from anywhere.
📦 What’s Inside the Infrastructure KPI Scorecard in Google Sheets
This ready-to-use template includes multiple structured worksheets designed to manage KPI monitoring efficiently.
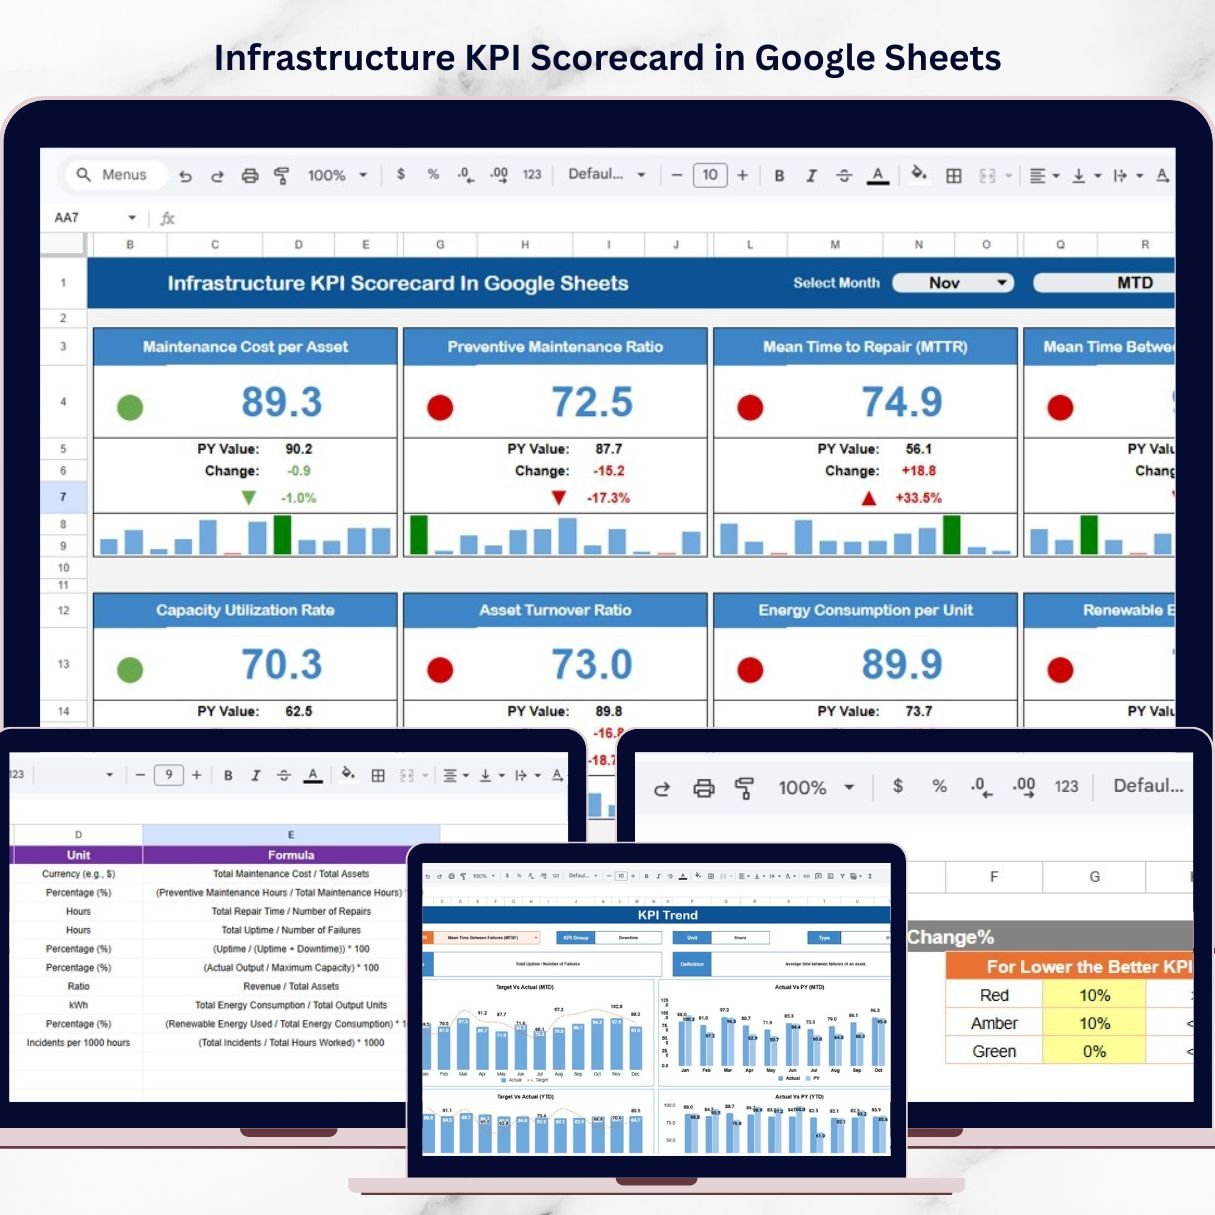
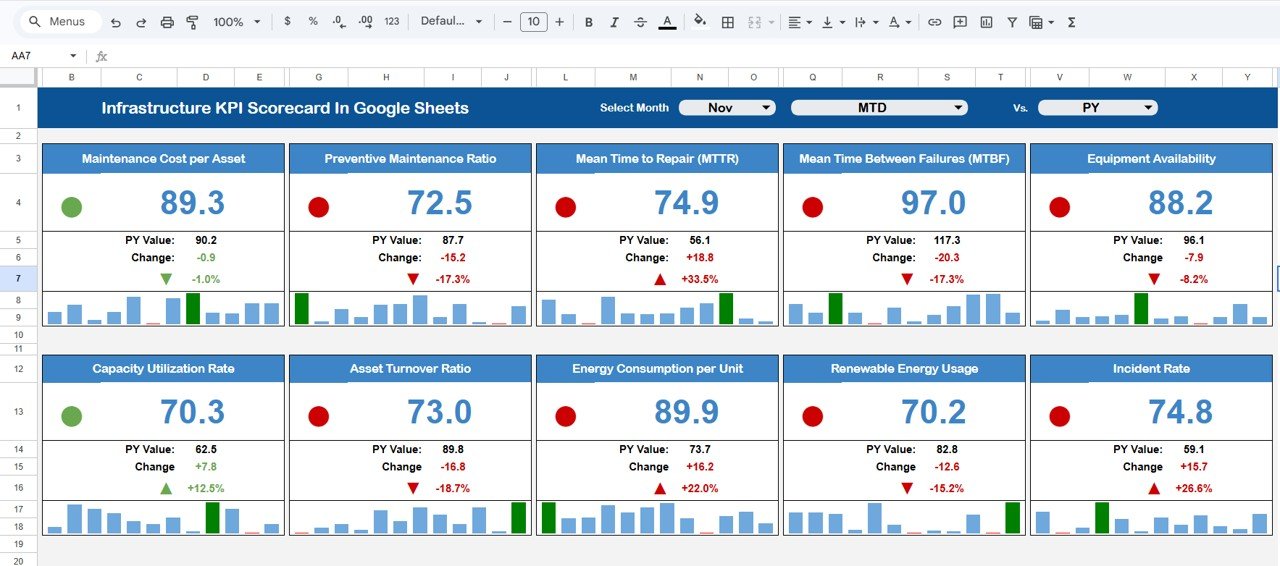
1️⃣ Scorecard Sheet
The Scorecard Sheet is the main interface where users can monitor infrastructure performance.
At the top of the dashboard, users can select a month from a dropdown list. Once the month changes:
-
KPI values automatically update
-
Traffic-light indicators refresh
-
Performance arrows update
Each KPI row displays key information such as:
-
KPI Name
-
KPI Group
-
KPI Unit
-
Actual Performance
-
Target Value
-
Percentage Change
-
Performance Indicator
Users can also switch between MTD and YTD views to evaluate different reporting periods.
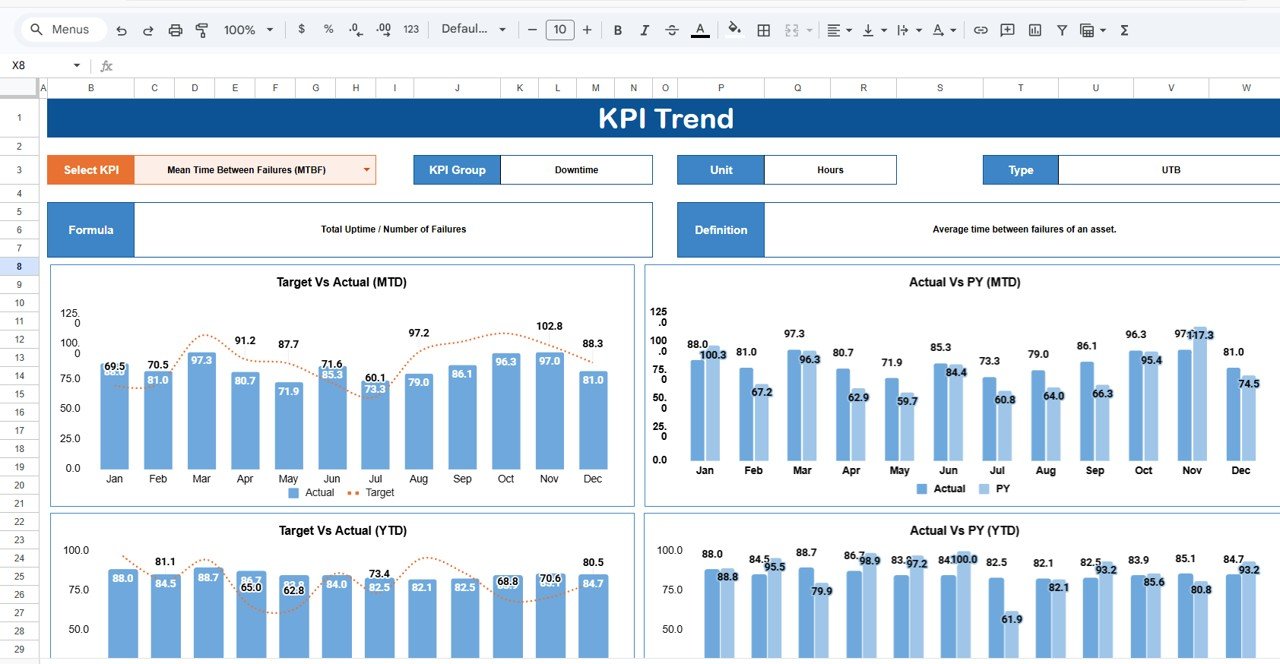
2️⃣ Trend Sheet
The Trend Sheet allows users to analyze KPI performance over time.
At cell C3, users can select a KPI from the dropdown list. Once selected, the sheet displays:
-
KPI Group
-
KPI Unit
-
KPI Type (Lower the Better or Upper the Better)
-
KPI Formula
-
KPI Definition
Additionally, visual charts display monthly KPI performance trends.
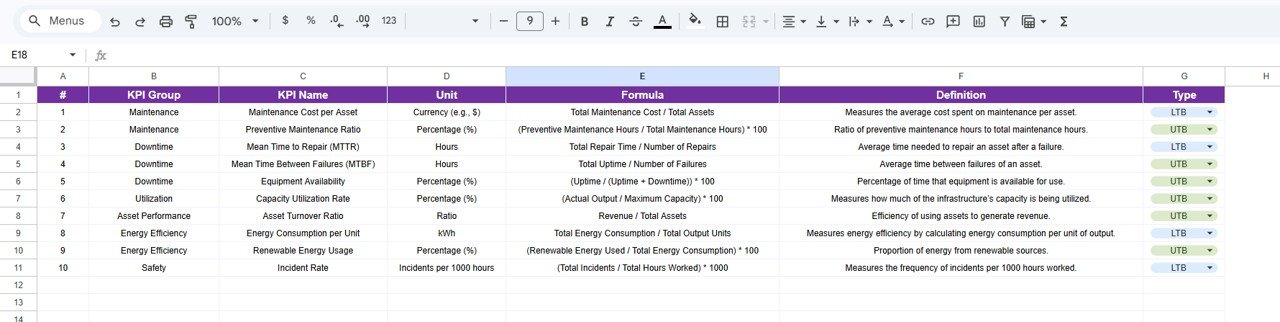
3️⃣ KPI Definition Sheet
The KPI Definition Sheet stores detailed KPI information including:
-
KPI Name
-
KPI Group
-
Unit of Measurement
-
KPI Formula
-
KPI Definition
-
KPI Type
This structured framework ensures consistent KPI reporting across teams.
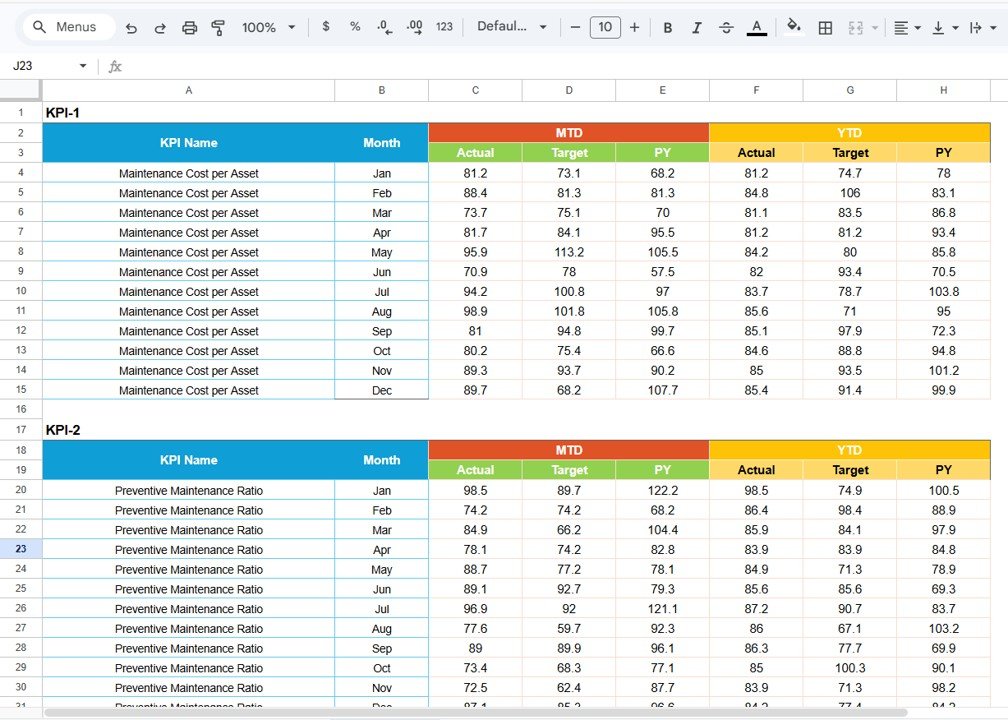
4️⃣ Data Input Sheet
The Data Input Sheet stores raw KPI data. Users enter monthly KPI values and target numbers. Once entered, the scorecard automatically updates KPI results and visual indicators.
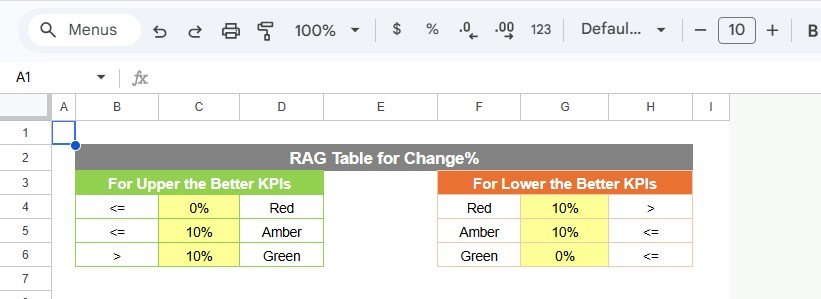
5️⃣ Colour Settings Sheet
This sheet controls traffic-light performance indicators. Organizations can customize KPI thresholds based on their performance strategy.
⚙️ How to Use the Infrastructure KPI Scorecard in Google Sheets
Using the scorecard is simple and does not require advanced technical skills.
Step 1: Enter KPI data in the Data Input Sheet.
Step 2: Define KPI targets and formulas in the KPI Definition Sheet.
Step 3: Select a month from the dropdown on the Scorecard Sheet.
Step 4: Analyze KPI performance using visual indicators and trend charts.
Within seconds, the scorecard generates clear performance insights.
👨💼 Who Can Benefit from This Infrastructure KPI Scorecard in Google Sheets
This KPI scorecard is ideal for organizations involved in infrastructure development and project management.
It is especially useful for:
🏗 Infrastructure Project Managers – Monitor project performance and progress.
🏢 Construction Companies – Track operational efficiency and project completion metrics.
🏛 Government Infrastructure Departments – Monitor public infrastructure performance indicators.
⚙ Engineering Firms – Evaluate project productivity and operational efficiency.
🚆 Transportation Authorities – Track service reliability and infrastructure maintenance metrics.
🔌 Utilities Companies – Monitor infrastructure reliability and operational KPIs.
Any organization responsible for managing infrastructure projects can benefit from this template.
Click here to read the Detailed blog post
Watch the step-by-step video tutorial: