Managing logistics operations today is no longer simple. Businesses must handle shipments, warehouses, carriers, fuel costs, and delivery timelines simultaneously. Without a centralized system, logistics data becomes scattered across multiple files, making analysis slow and inefficient.
The Logistics Dashboard in Excel is designed to solve this problem by transforming complex logistics data into clear, interactive, and actionable insights. Instead of spending hours reviewing spreadsheets, you can instantly monitor logistics costs, delivery performance, regional efficiency, and shipment trends from a single professional dashboard.
This ready-to-use Excel solution helps businesses gain full operational visibility while improving decision-making and cost control. Whether you manage transportation, supply chains, or warehouse operations, this dashboard enables smarter logistics management without expensive software.
✨ Key Feature of Logistics Dashboard in Excel
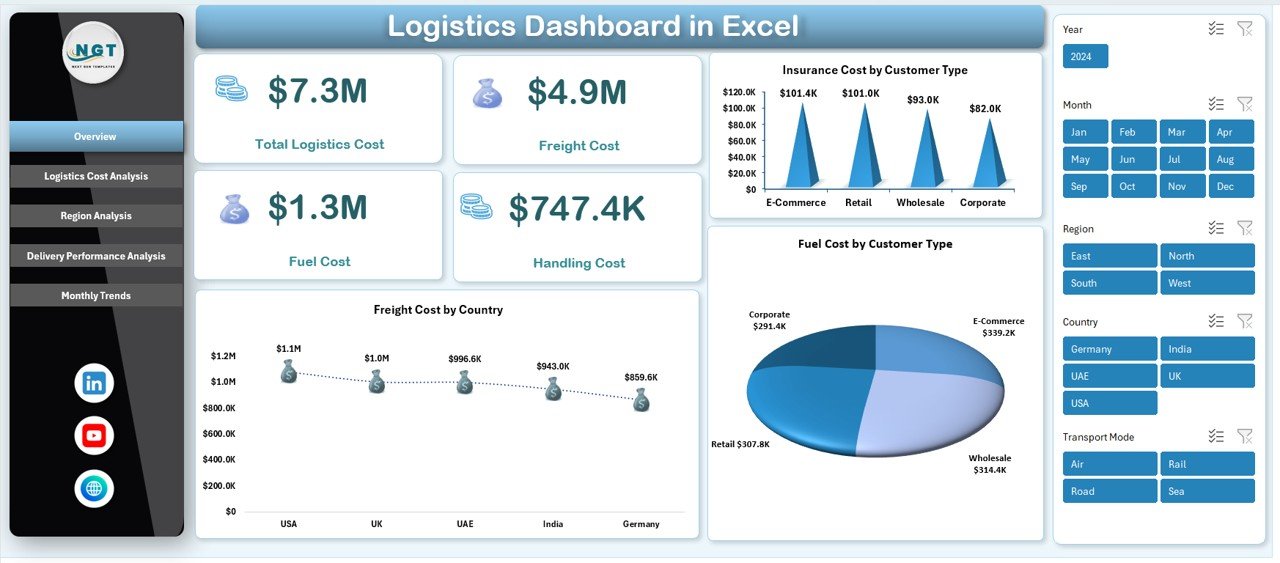
🚚 Centralized Logistics Overview – Track total logistics cost, freight cost, fuel expenses, handling charges, and insurance costs in one place.
📊 Interactive Visual Dashboard – Dynamic charts and slicers allow instant filtering and analysis without complex formulas.
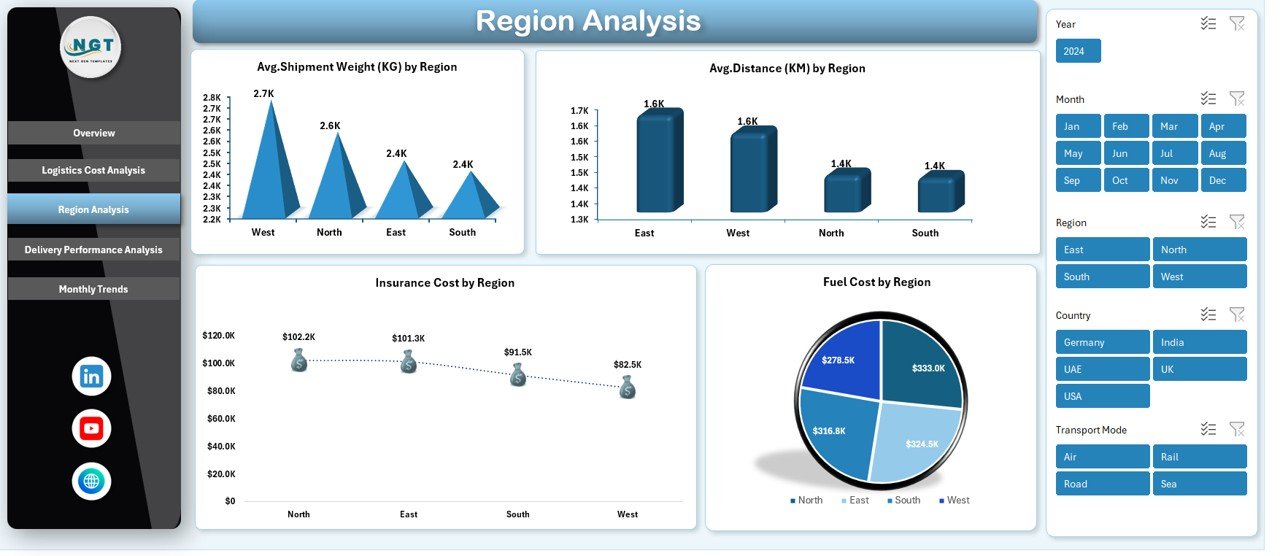
🌍 Regional Performance Analysis – Compare shipment distance, fuel usage, and insurance expenses across regions.
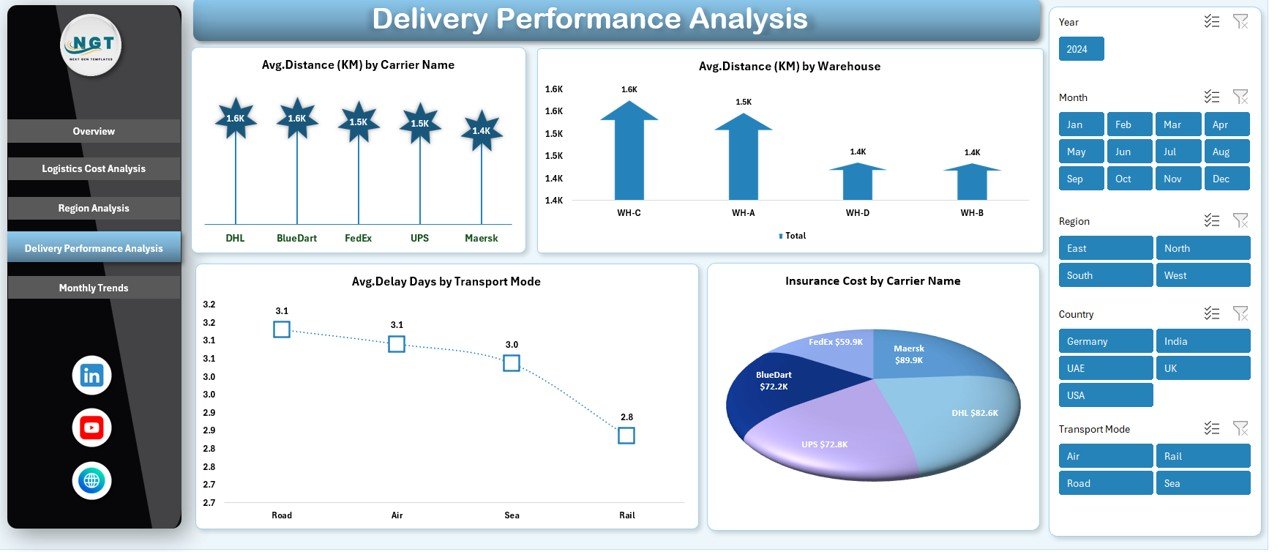
📦 Delivery Performance Monitoring – Identify delays, evaluate transport modes, and analyze carrier efficiency quickly.
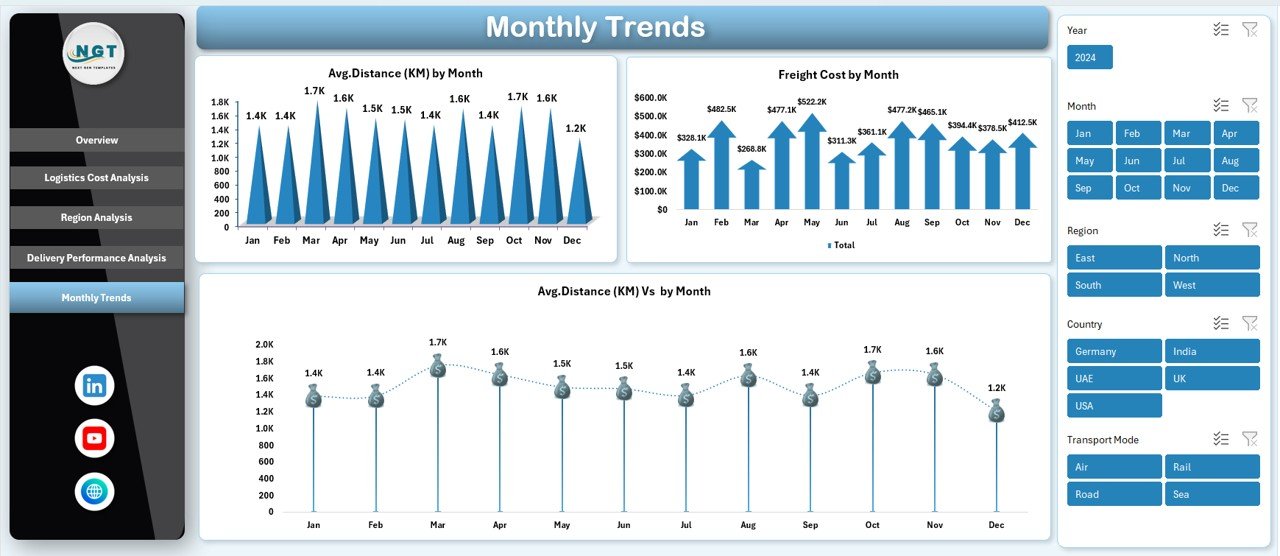
📈 Monthly Trend Tracking – Monitor logistics performance trends and detect seasonal cost variations.
⚡ Automated Calculations – Built-in formulas and pivot tables automatically update KPIs after data refresh.
🔎 Cost Breakdown Insights – Understand where logistics spending occurs and identify cost-heavy operations.
💡 User-Friendly Interface – Designed for beginners and professionals with easy navigation and filtering options.
📦 What’s Inside the Logistics Dashboard in Excel
This digital product includes a professionally structured Excel dashboard with multiple analytical sheets:
✅ Overview Sheet – Displays major logistics KPIs and cost summaries for quick performance evaluation.
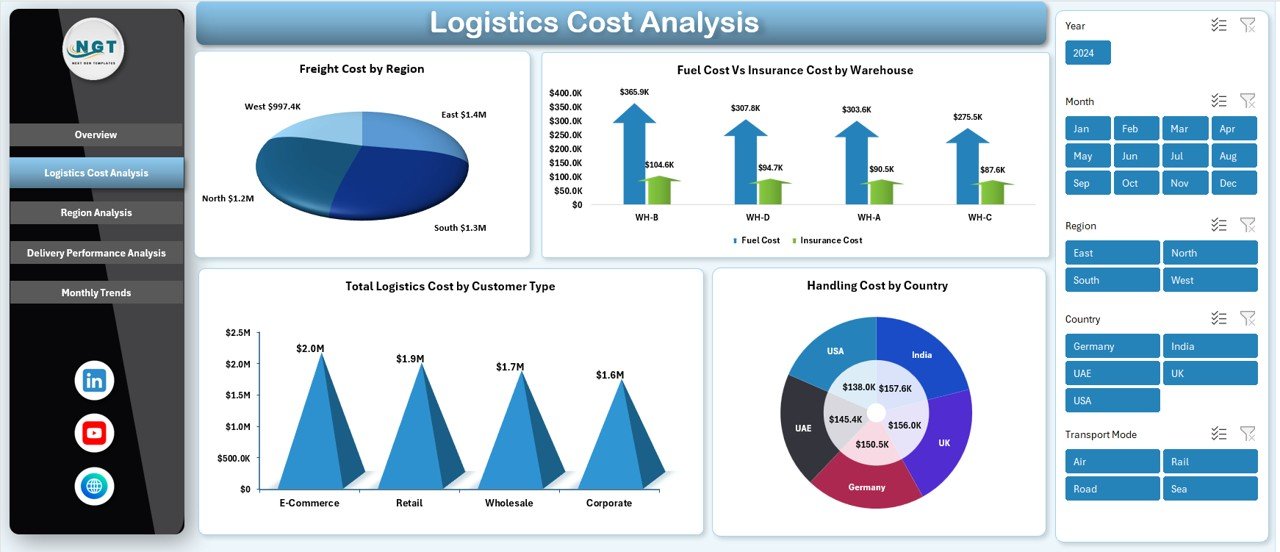
✅ Logistics Cost Analysis – Deep breakdown of freight, fuel, handling, and insurance expenses.
✅ Region Analysis – Compare logistics efficiency and shipment metrics across locations.
✅ Delivery Performance Analysis – Evaluate transport modes, carriers, and delivery delays.
✅ Monthly Trends Sheet – Visualize performance changes and logistics cost patterns over time.
Each section is carefully designed to provide meaningful insights that support faster and smarter decisions.
🚀 How to Use the Logistics Dashboard in Excel
Using the dashboard is simple and requires no advanced technical skills:
1️⃣ Enter logistics data into the provided data sheet.
2️⃣ Update shipment, cost, and delivery details regularly.
3️⃣ Refresh pivot tables or dashboard connections.
4️⃣ Use slicers to filter by region, customer type, or carrier.
5️⃣ Instantly analyze charts, KPIs, and trends.
Because calculations are automated, you save time while gaining accurate insights immediately.
🎯 Who Can Benefit from This Logistics Dashboard in Excel
This dashboard is ideal for organizations that rely on transportation and supply chain operations, including:
✔️ Logistics Managers
✔️ Supply Chain Analysts
✔️ Warehouse Managers
✔️ Transportation Companies
✔️ E-commerce Businesses
✔️ Manufacturing Firms
✔️ Distribution Companies
✔️ Operations Teams
Any business handling shipments or logistics expenses can use this dashboard to improve efficiency and reduce operational costs.
By using this dashboard, businesses gain better visibility into logistics operations, identify inefficiencies faster, and make data-driven decisions confidently. Instead of manual reporting, you get automated insights that enhance productivity and operational performance.
The Logistics Dashboard in Excel is more than a reporting tool — it becomes a strategic solution for optimizing logistics performance, controlling costs, and improving delivery outcomes.
Click hare to read the Detailed blog post
Watch the step-by-step video tutorial: