
Online education is growing faster than ever. EdTech platforms, virtual schools, coaching institutes, and online universities serve thousands of learners daily. But as enrollments increase, so does complexity. Online Education KPI Scorecard in Excel Without structured performance tracking, leaders struggle to measure engagement, completion rates, instructor performance, and platform efficiency.
Scattered spreadsheets. Delayed insights. Unclear performance gaps.
What if you could monitor your entire online education performance in one structured, professional, and automated Excel system?
Online Education KPI Scorecard in Excel That’s exactly what the Online Education KPI Scorecard in Excel delivers. 🚀
This ready-to-use Excel scorecard helps online education teams track Actual vs Target performance, monitor MTD (Month-to-Date) and YTD (Year-to-Date) results, analyze trends, and document KPI definitions — all inside one organized workbook.
No expensive analytics software. No complex setup. Just smart, data-driven monitoring.
🚀 Key Feature of Online Education KPI Scorecard in Excel
This powerful template includes 4 fully structured worksheets designed for complete KPI management.
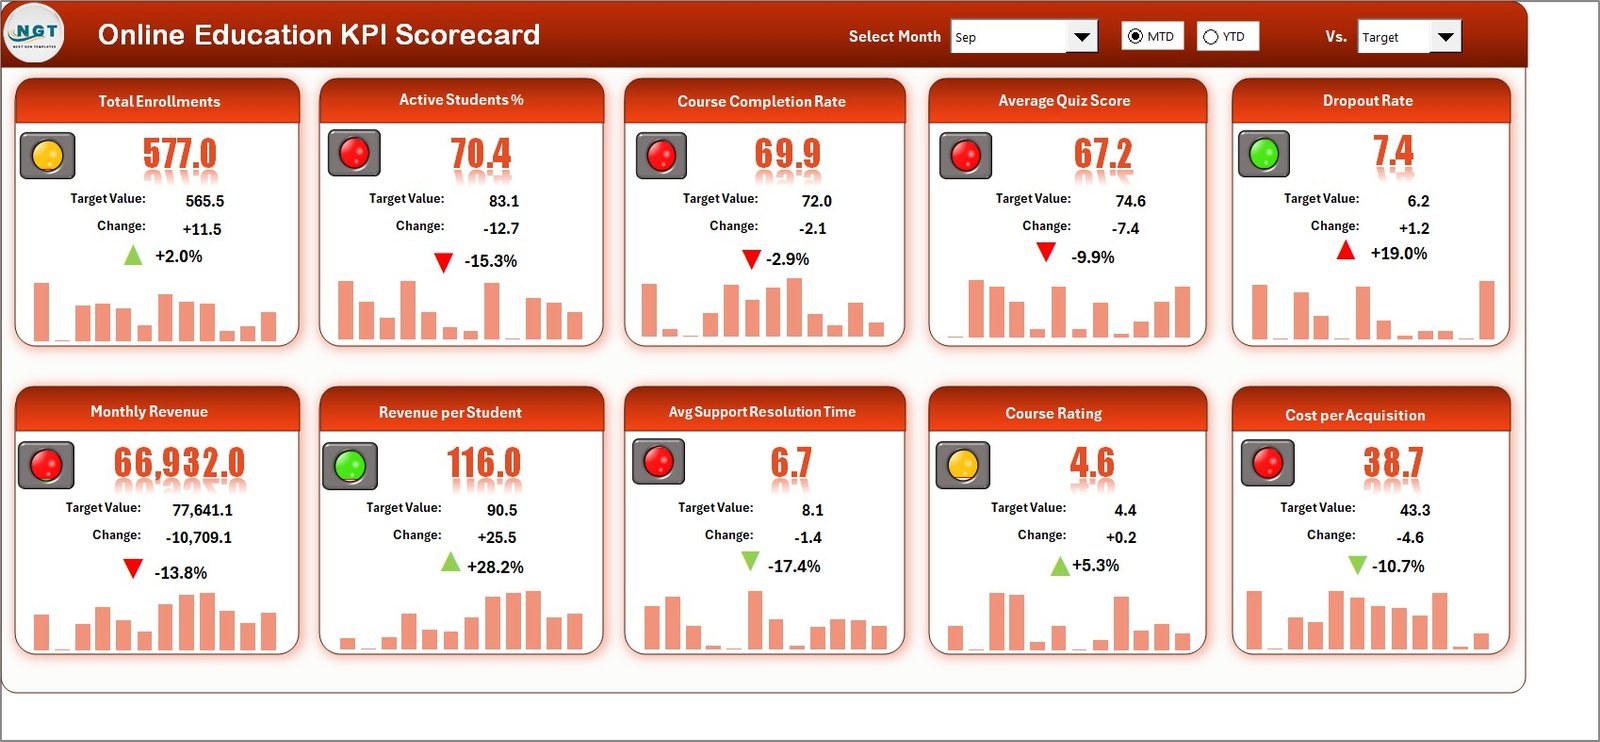
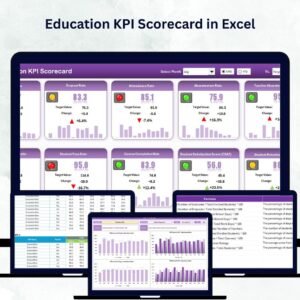
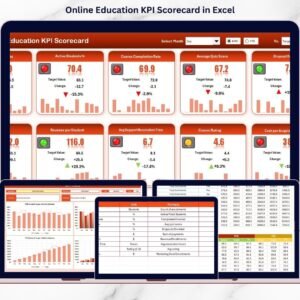
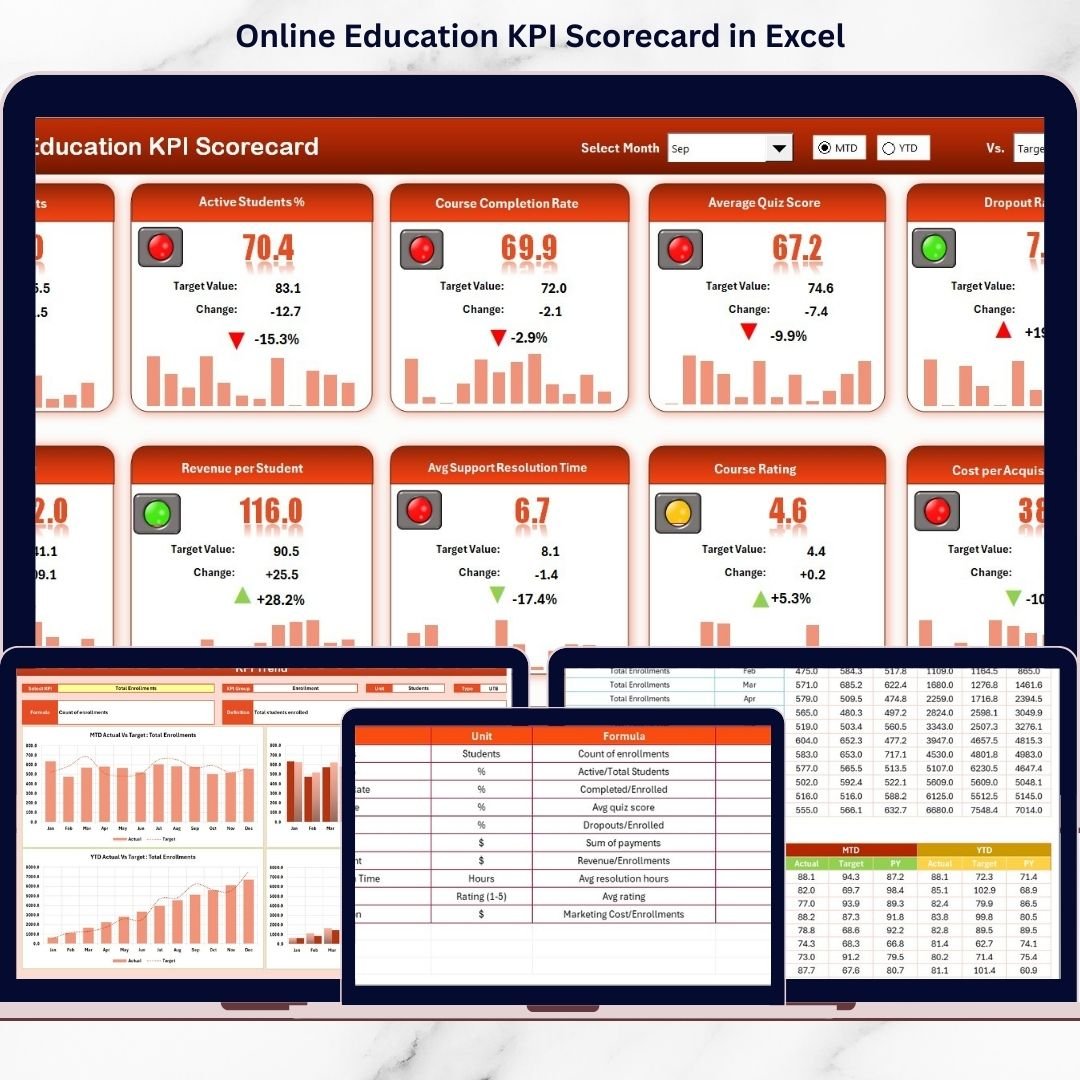
📊 Scorecard Sheet – Main Performance Dashboard
Select Month and switch between MTD or YTD view using dropdown menus.
✔ Actual MTD vs Target MTD
✔ Actual YTD vs Target YTD
✔ Color-coded performance indicators
✔ KPI Group and Unit visibility
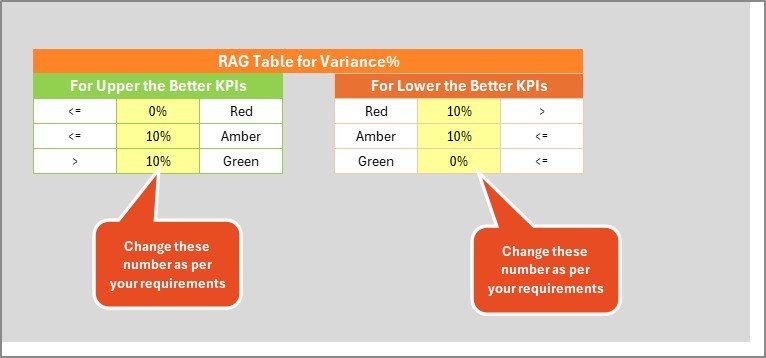
🟢 Visual Performance Indicators
Green = KPI meets or exceeds target
Red = KPI underperforms
This allows instant performance evaluation.
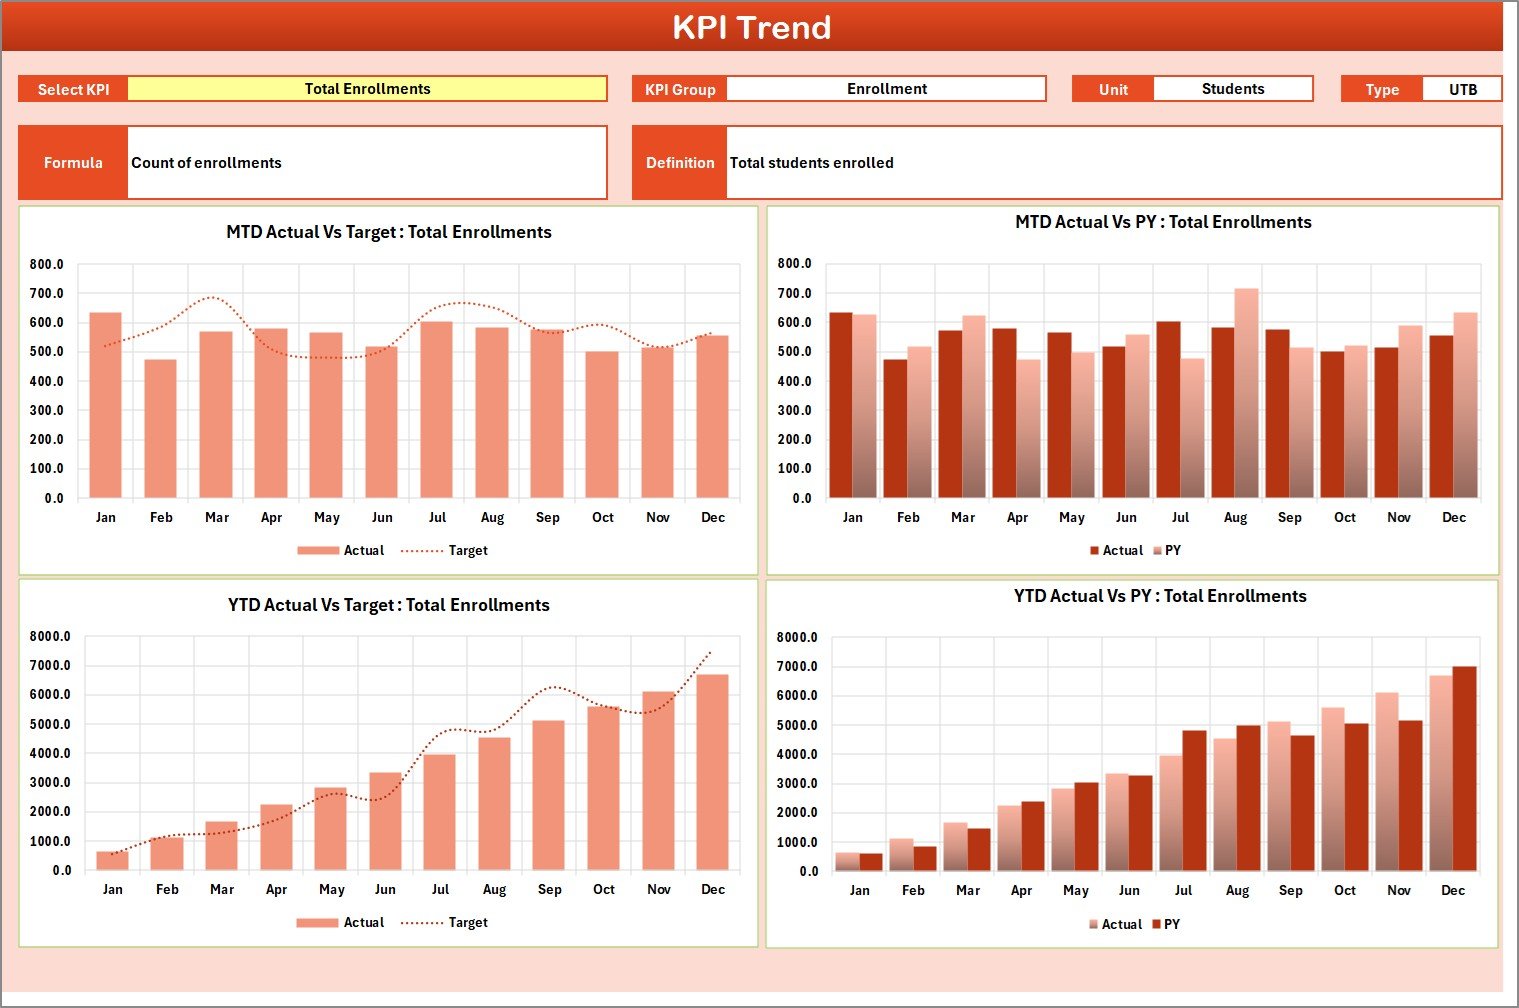
📈 KPI Trend Sheet – Analyze Performance Over Time
Select a KPI in cell C3 and instantly view:
✔ KPI Group
✔ KPI Type (Lower the Better / Upper the Better)
✔ KPI Formula & Definition
✔ MTD Trend Chart (Actual vs Target vs Previous Year)
✔ YTD Trend Chart (Actual vs Target vs Previous Year)
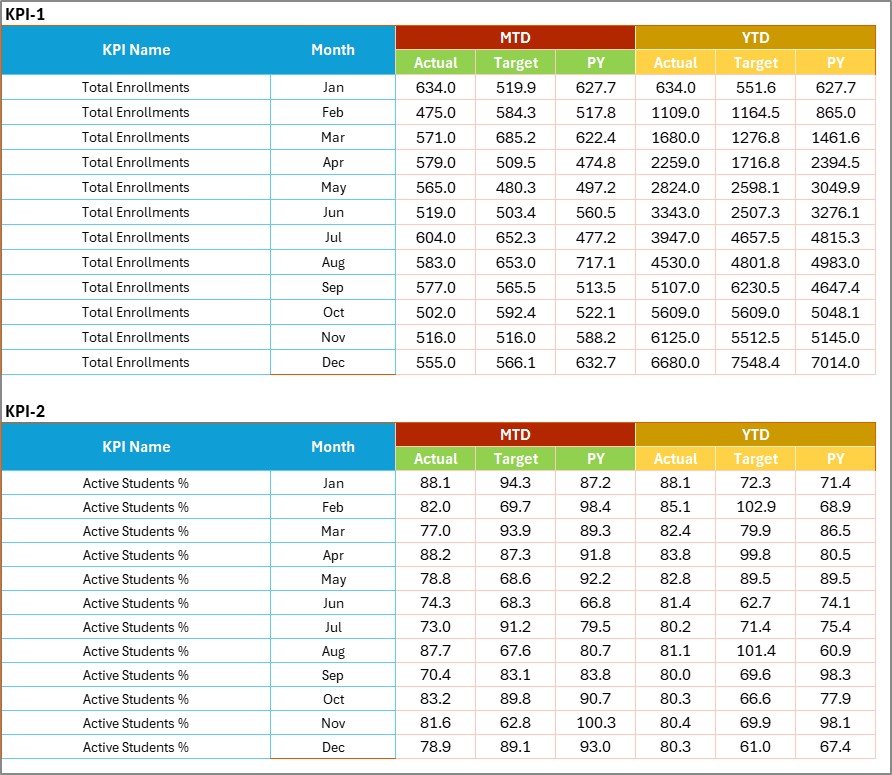
📝 Input Data Sheet – Central Data Entry System
Enter monthly Actual and Target values. Calculations update automatically.
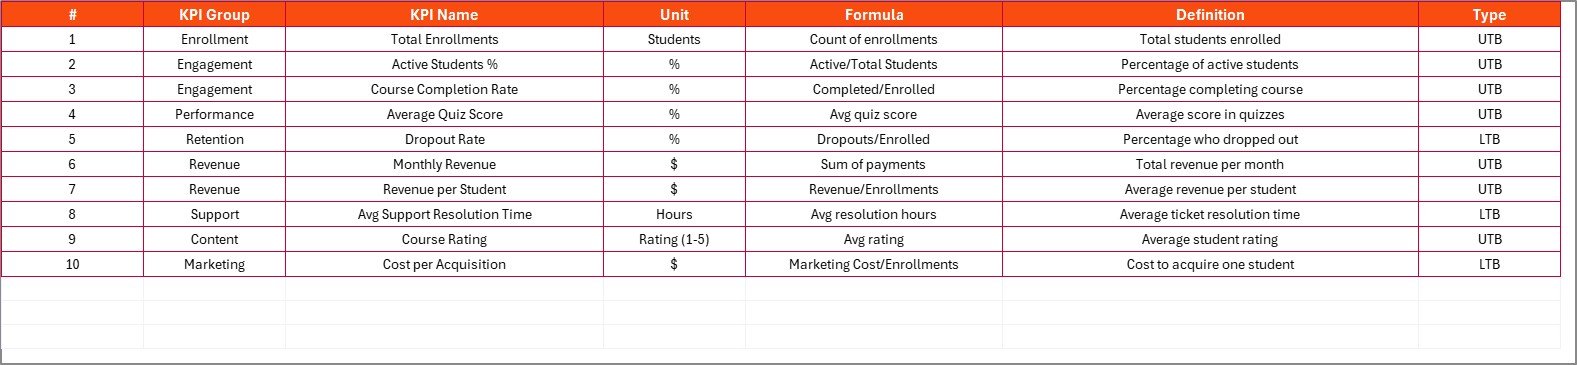
📘 KPI Definition Sheet – Documentation & Governance
Define KPI Name, Group, Unit, Formula, and Definition for clarity and standardization.
Everything updates dynamically. Enter data once — analyze everywhere.
📦 What’s Inside the Online Education KPI Scorecard in Excel
When you purchase this template, you receive:
✔ 4 professionally designed worksheets
✔ Automated MTD & YTD calculations
✔ Actual vs Target comparison system
✔ Conditional formatting performance indicators
✔ Trend charts for each KPI
✔ KPI documentation framework
✔ Easy dropdown selection controls
✔ Fully customizable KPI structure
This is more than a spreadsheet — it’s a structured education performance monitoring system.
🛠 How to Use the Online Education KPI Scorecard in Excel
Getting started is simple:
1️⃣ Enter monthly performance data in the “Input Data” sheet.
2️⃣ Define or customize KPIs in the “KPI Definition” sheet.
3️⃣ Go to the Scorecard sheet.
4️⃣ Select Month and choose MTD or YTD view.
The dashboard instantly displays:
• Actual vs Target comparisons
• Color-coded results
• KPI grouping and units
• Structured performance summary
For deeper insights:
Open KPI Trend → Select KPI → Review trend charts and previous year comparison.
No advanced Excel skills required.
🎓 Who Can Benefit from This Online Education KPI Scorecard in Excel
This scorecard is ideal for:
📚 EdTech Companies
🏫 Virtual Schools
🎓 Online Universities
🧑🏫 Coaching & Training Institutes
📈 Course Creators
📊 Academic Performance Teams
👩💼 Education Leadership
Whether you manage 500 learners or 50,000 students, this scorecard gives you complete performance clarity.
The Online Education KPI Scorecard in Excel helps you:
✔ Improve learner outcomes
✔ Increase course completion rates
✔ Monitor instructor performance
✔ Track engagement levels
✔ Strengthen stakeholder reporting
✔ Support data-driven growth
Instead of guessing what works, you make informed decisions.
If you want measurable learning outcomes, better visibility, and structured growth tracking, this Excel KPI scorecard is your ultimate solution.
Click here to read the Detailed blog post
Visit our YouTube channel to learn step-by-step video tutorials:
👉 https://youtube.com/@PKAnExcelExpert
Watch the step-by-step video tutorial:
Compatibility and Requirements
- Works in Microsoft Excel desktop (Excel 2016 or later, or Microsoft 365).
- You pick the month and the MTD or YTD view from dropdown menus, and the KPI on the KPI Trend sheet from a dropdown. Microsoft explains dropdowns in Create a drop-down list.
Frequently Asked Questions
Which sheets are included?
Four sheets: Scorecard, KPI Trend, Input Data and KPI Definition.
How do I update the scorecard?
Enter the monthly Actual and Target values in the Input Data sheet. Then select a month and MTD or YTD on the Scorecard sheet and the results update.
What do the green and red colors mean?
Green means the KPI meets or exceeds its target. Red means it is below target.
Can I see the trend for one KPI?
Yes. Select the KPI in cell C3 of the KPI Trend sheet. It shows the KPI group, type (Lower the Better or Upper the Better), formula and definition, plus MTD and YTD charts of Actual, Target and Previous Year.
Can I add or change KPIs?
Yes. Define the KPI name, group, unit, formula and definition in the KPI Definition sheet.
Is there a dashboard version for online education?
Yes. See the Online Education KPI Dashboard in Excel, the Online Education KPI Dashboard in Power BI and the Online Education KPI Dashboard in Google Sheets.
Related Education KPI Templates
- Online Education KPI Dashboard in Excel: a dashboard view of the same topic in Excel
- Online Education KPI Dashboard in Power BI: the Power BI edition
- Online Education KPI Dashboard in Google Sheets: the Google Sheets edition
- Education KPI Scorecard in Excel: a scorecard for general education KPIs
- Education Dashboard in Excel: an education dashboard for schools and institutes
Browse all Excel KPI dashboards and scorecards.