The Toy and Games Industry Dashboard is one of the most dynamic and season-driven markets. Customer preferences change rapidly, festival and holiday seasons heavily impact demand, and profitability depends on smart pricing, discount control, and inventory planning. However, many toy and games businesses still rely on scattered spreadsheets and manual reports. As a result, decision-making becomes slow and reactive.
That is exactly where the Toy and Games Industry Dashboard in Excel becomes a powerful decision-making tool 🧸🎮📊.
This ready-to-use Excel dashboard transforms raw sales data into clear KPIs, interactive charts, and actionable insights. Instead of spending hours compiling reports, business owners and managers gain instant visibility into sales, cost, profit, discounts, brands, regions, and monthly trends—all in one professional Excel file.
Designed for speed, clarity, and control, this dashboard helps toy manufacturers, distributors, wholesalers, and retailers move from guesswork to data-driven growth.
## Key Features of Toy and Games Industry Dashboard in Excel 🚀
This dashboard is built to simplify complex industry analysis.
📊 Centralized Business Performance Tracking
Monitor sales, cost, profit, discounts, and net revenue from one Excel dashboard.
🎛️ Interactive Right-Side Slicers
Filter insights instantly by region, brand, product category, sales channel, customer type, or month.
📈 Executive KPI Cards
Review key business metrics at a glance without deep analysis.
📉 Discount & Profit Control
Identify high-discount regions, brands, or channels that reduce margins.
🏷️ Brand & Category Insights
Understand which brands and toy categories generate the highest profitability.
🌍 Region & Channel Analysis
Compare geographic performance and sales channel contribution easily.
📅 Monthly & Seasonal Trend Tracking
Analyze demand patterns during festivals, holidays, and school seasons.
💡 100% Excel-Based Solution
No BI tools required—simple, familiar, and cost-effective.
## What’s Inside the Toy and Games Industry Dashboard in Excel 📂
This dashboard includes multiple professionally designed analysis pages, each answering a specific business question.
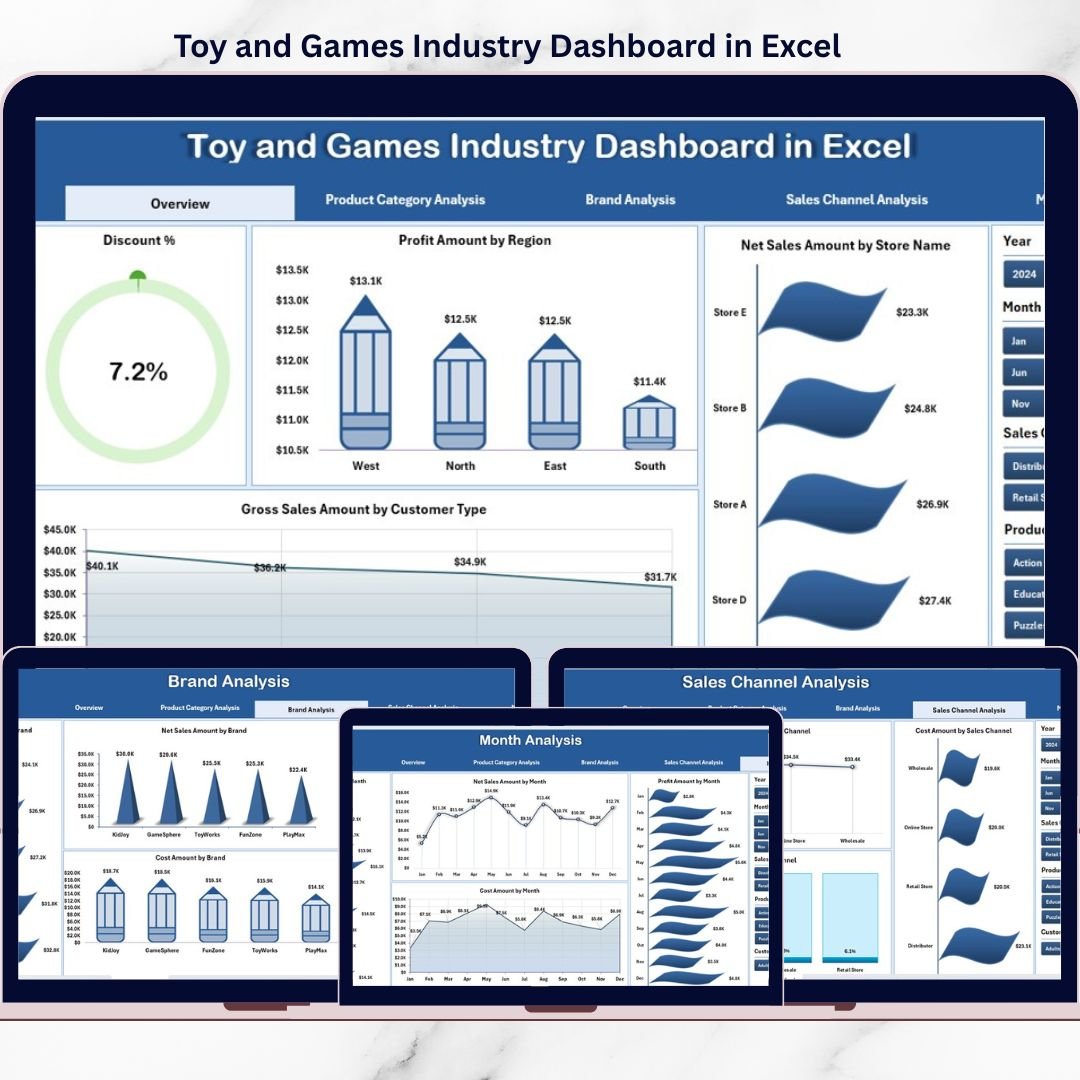
🟦 Overview Page
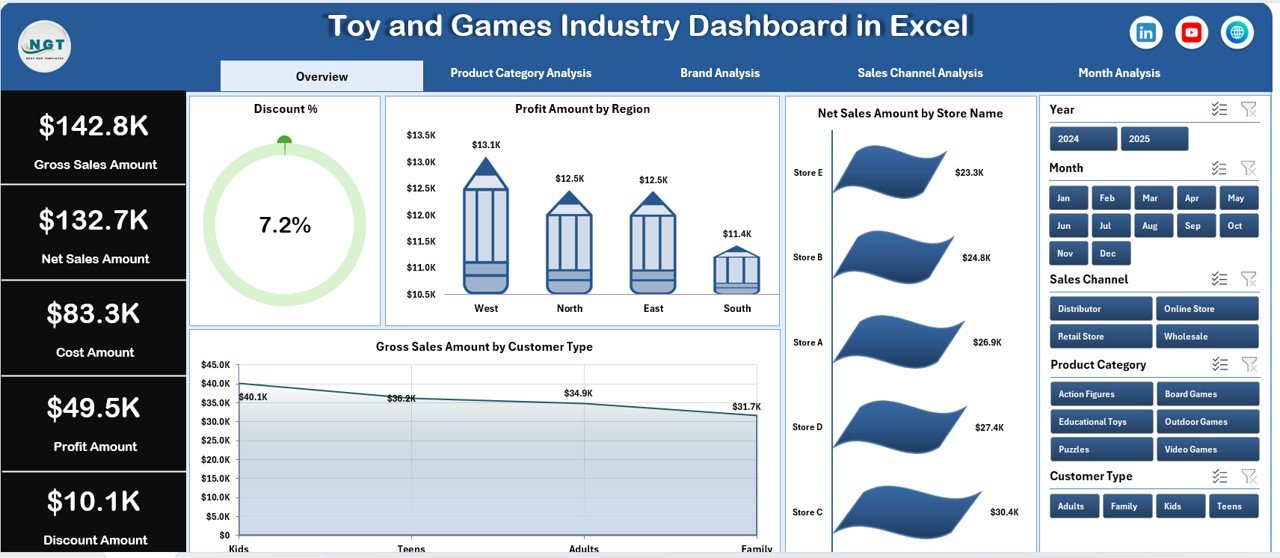
Acts as the command center with KPI cards and charts such as Discount % by Region, Profit by Region, Net Sales by Store, and Gross Sales by Customer Type.
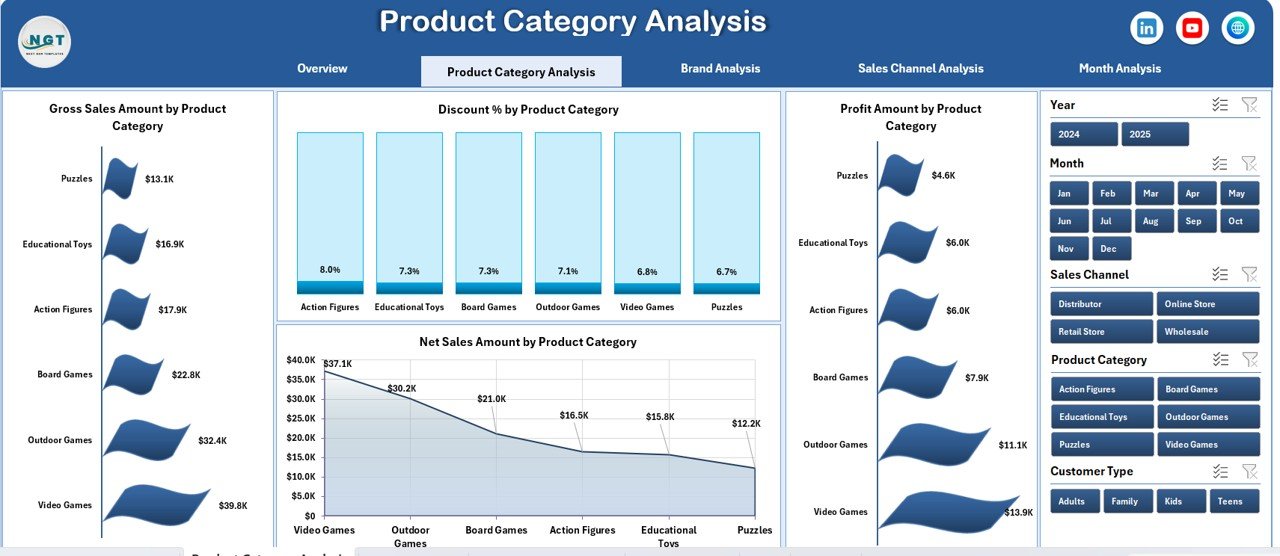
🟦 Product Category Analysis Page
Compares gross sales, net sales, profit, and discount % across toy and game categories.
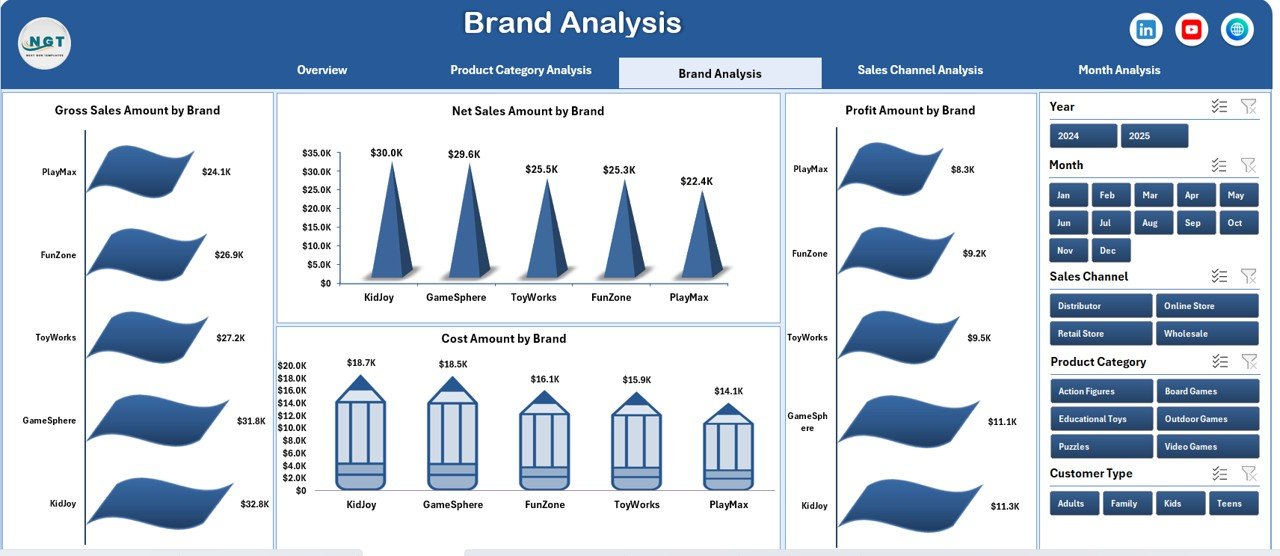
🟦 Brand Analysis Page
Provides brand-level insights for gross sales, cost, profit, and net sales to identify strong and weak brands.
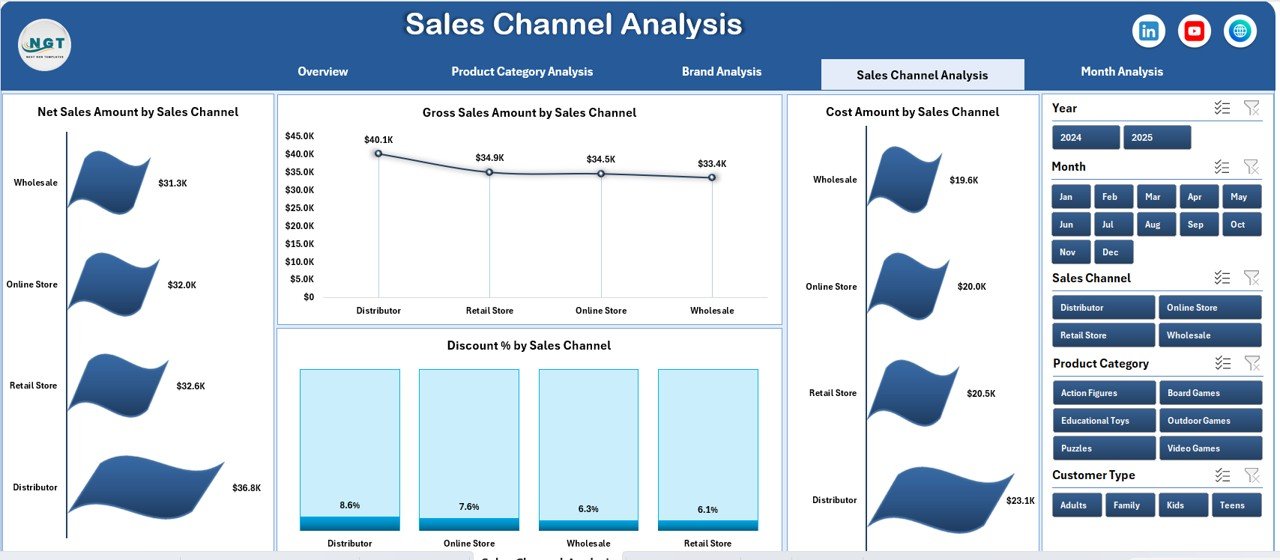
🟦 Sales Channel Analysis Page
Evaluates performance across online, retail, distributor, and marketplace channels.
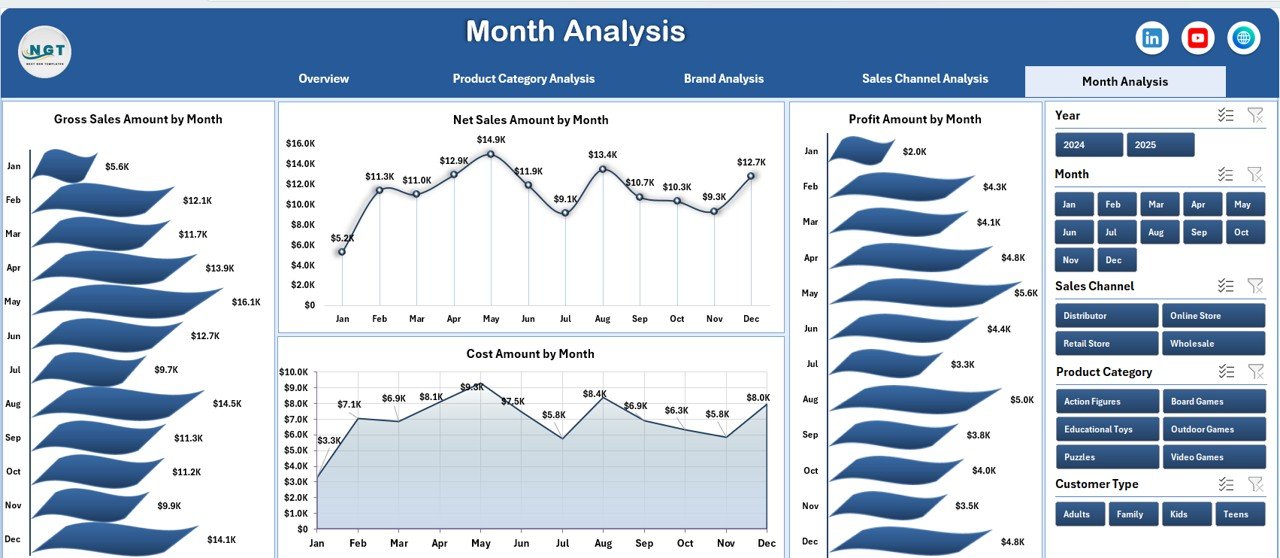
🟦 Month Analysis Page
Tracks monthly trends for gross sales, cost, profit, and net sales to understand seasonality.
🟦 Data Sheet
Stores raw transactional data such as category, brand, channel, region, customer type, sales amount, cost, and discount %.
🟦 Support Sheet
Handles calculations, mappings, and helper logic to keep the dashboard stable and scalable.
Together, these sheets form a complete analytics system for the toy and games industry.
## How to Use the Toy and Games Industry Dashboard in Excel 🧩
Using the dashboard is simple and business-friendly:
1️⃣ Update sales data in the Data Sheet
2️⃣ Refresh Pivot Tables if required
3️⃣ Use slicers to filter by region, brand, category, channel, or month
4️⃣ Review KPI cards and charts instantly
5️⃣ Use insights to improve pricing, discounts, and inventory planning
Excel automatically updates all visuals—allowing teams to focus on strategy, not reporting.
## Who Can Benefit from This Toy and Games Industry Dashboard in Excel 👥
This dashboard is ideal for:
✔️ Toy Manufacturers
✔️ Game Distributors & Wholesalers
✔️ Retail & E-commerce Managers
✔️ Sales & Finance Teams
✔️ Business Owners
✔️ Analysts & Consultants
Both small businesses and large enterprises can use this dashboard effectively.
### Click here to read the Detailed blog post
Visit our YouTube channel to learn step-by-step video tutorials
👉 YouTube.com/@PKAnExcelExpert


Reviews
There are no reviews yet.