Managing health insurance operations without clear visibility leads to delays, errors, and financial risk. Every health insurance organization handles premiums, claims, policy types, hospitals, regions, and processing timelines daily. However, when this information remains scattered across multiple Excel sheets, decision-making becomes slow and unreliable.
That is exactly where the Health Insurance Dashboard in Excel becomes a powerful and practical solution.
This ready-to-use Excel dashboard transforms complex insurance data into clear KPIs, visual charts, and actionable insights. Instead of spending hours preparing manual reports, insurance teams can instantly track approved claims, pending cases, premium trends, claim amounts, and processing efficiency from a single interactive dashboard.
Built entirely in Microsoft Excel using Pivot Tables, Pivot Charts, Slicers, and KPI cards, this dashboard is easy to use, cost-effective, and ideal for both technical and non-technical users.
🔑 Key Features of Health Insurance Dashboard in Excel
📊 5 structured analytical pages for complete insurance visibility
🧭 Page Navigator for smooth movement between dashboard pages
🎯 Interactive slicers for smart filtering
📈 Clear KPIs & visual charts for fast insights
⏱ Claim processing time tracking
🏥 Hospital-wise claim performance analysis
📍 Region and city-level insights
📆 Month-wise trend monitoring
🔄 Automatic dashboard refresh on data update
This dashboard turns raw insurance data into decision-ready intelligence.
📂 What’s Inside the Health Insurance Dashboard in Excel
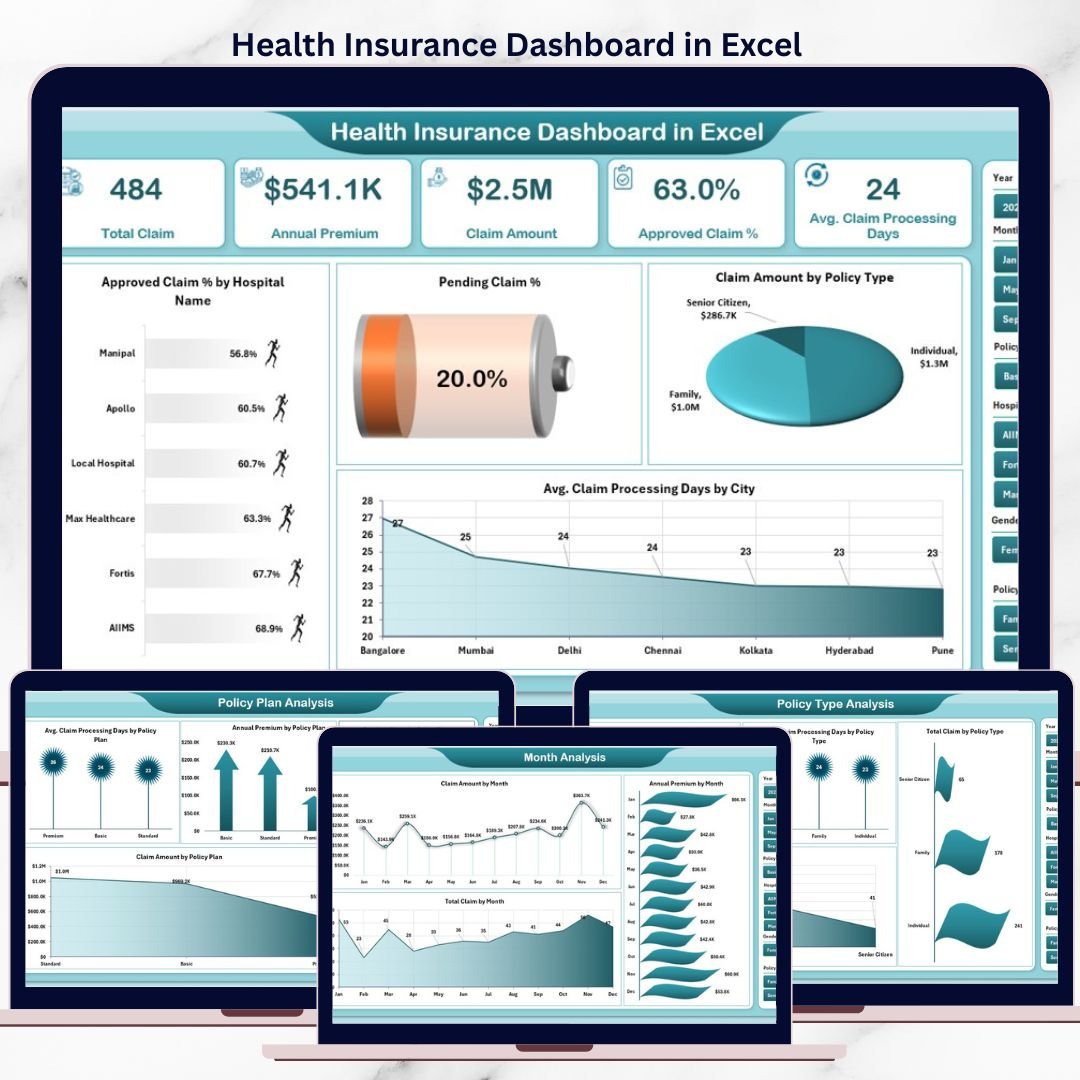
📊 Overview Page – Insurance Performance Control Center
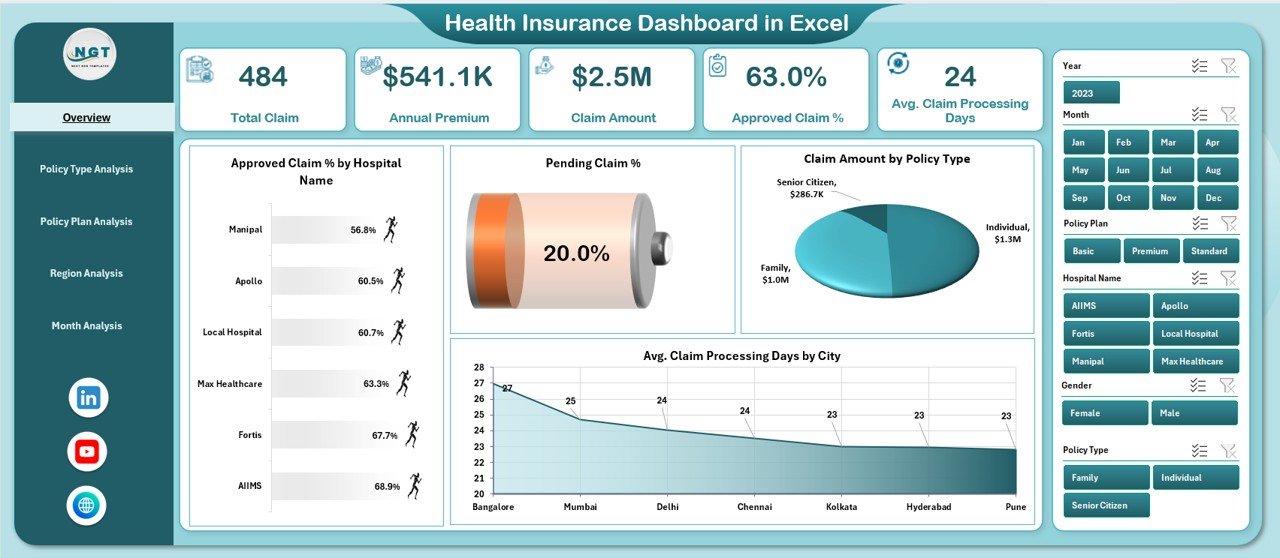
The Overview Page acts as the executive summary of the dashboard.
Key Insights Displayed:
-
Approved Claim % by Hospital Name
-
Pending Claim % by Hospital Name
-
Claim Amount by Policy Type
-
Average Claim Processing Days by City
This page allows leadership to identify bottlenecks and risk areas within seconds.
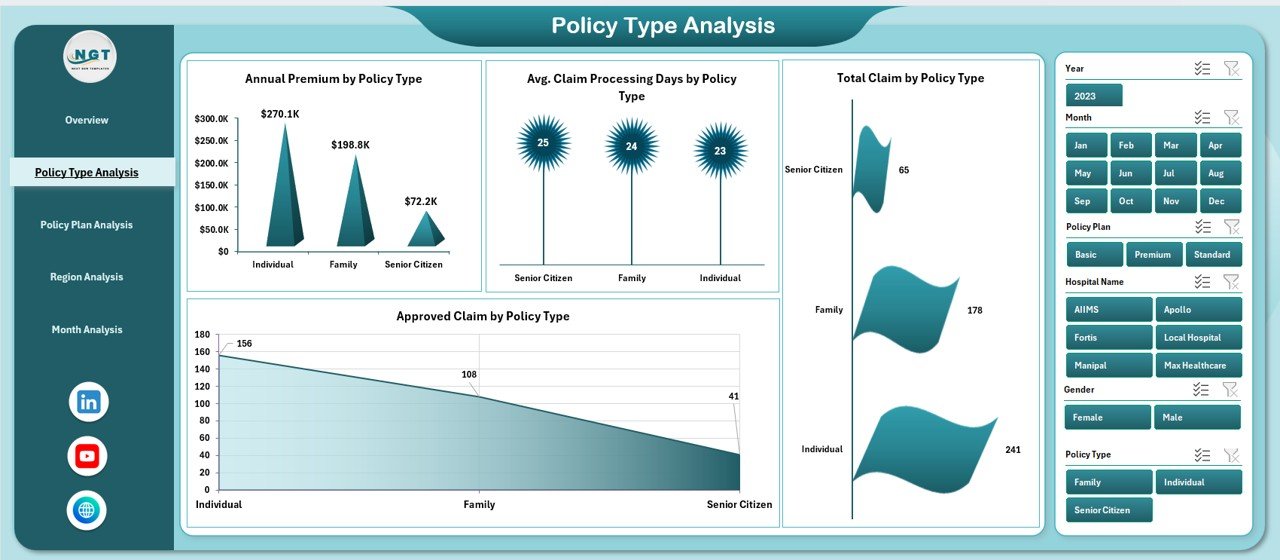
🧾 Policy Type Analysis Page
The Policy Type Analysis Page compares performance across different policy categories.
Charts Included:
-
Annual Premium by Policy Type
-
Average Claim Processing Days by Policy Type
-
Total Claim by Policy Type
-
Approved Claim by Policy Type
This analysis supports product strategy, pricing decisions, and risk assessment.
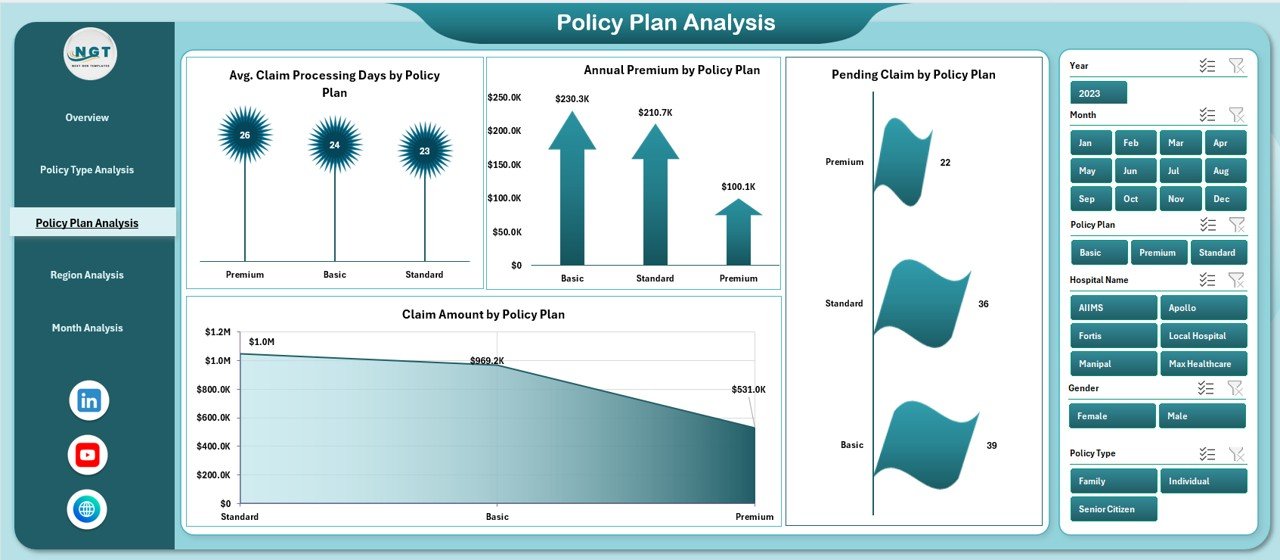
📑 Policy Plan Analysis Page
Policy plans differ in coverage depth and claim complexity. This page provides plan-level insights.
Charts Available:
-
Average Claim Processing Days by Policy Plan
-
Annual Premium by Policy Plan
-
Pending Claim by Policy Plan
-
Claim Amount by Policy Plan
Insurers can optimize underwriting rules and operational efficiency using this analysis.
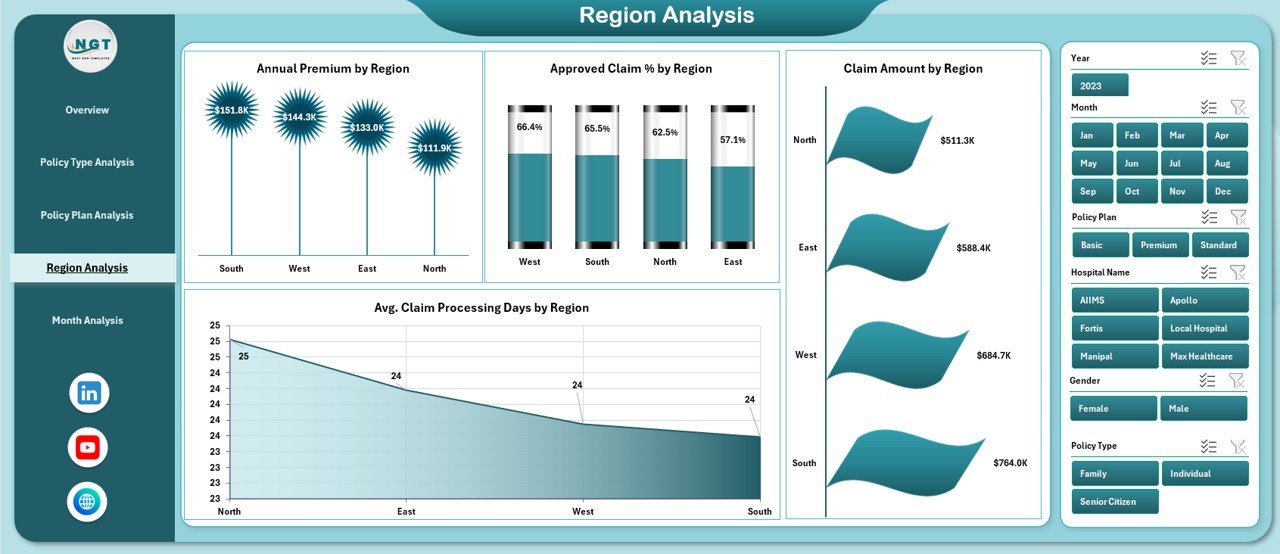
🌍 Region Analysis Page
The Region Analysis Page highlights geographical performance variations.
Key Metrics:
-
Annual Premium by Region
-
Approved Claim % by Region
-
Claim Amount by Region
-
Average Claim Processing Days by Region
This page helps organizations allocate resources and improve regional workflows.
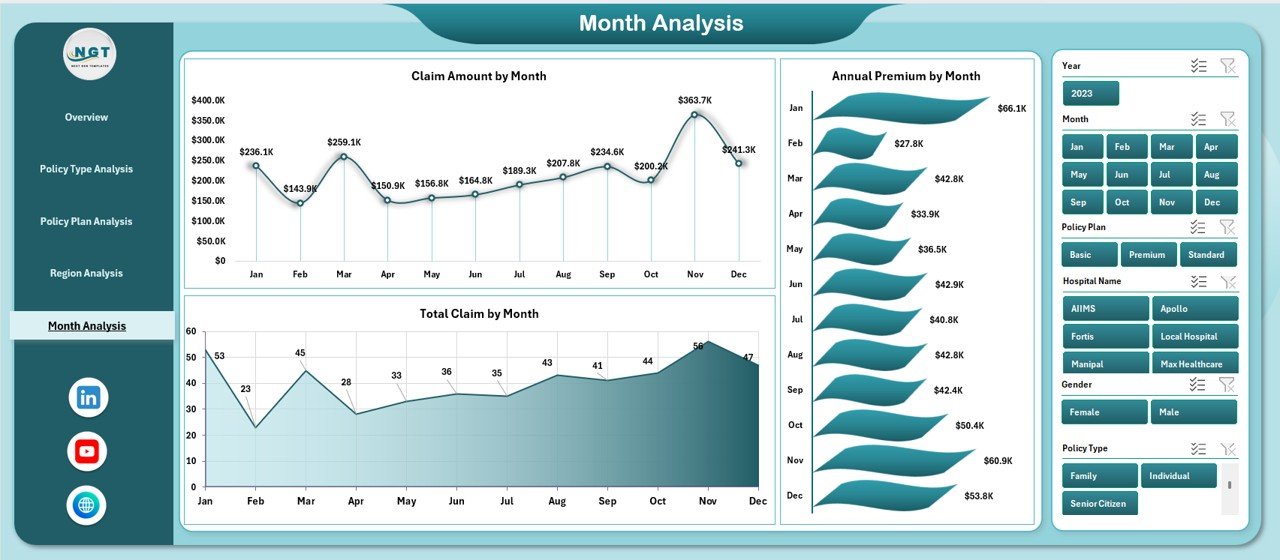
📆 Month Analysis Page
The Month Analysis Page focuses on time-based trends and seasonality.
Charts Included:
-
Claim Amount by Month
-
Annual Premium by Month
-
Total Claim by Month
This analysis supports forecasting, budgeting, and capacity planning.
🛠️ How to Use the Health Insurance Dashboard
✅ Update insurance data in the Data Sheet
✅ Refresh pivot tables if required
✅ Use slicers to filter by policy, hospital, region, or month
✅ Review KPIs and charts instantly
✅ Make faster, data-driven decisions
No macros, VBA, or advanced Excel skills required.
👥 Who Can Benefit from This Dashboard?
🏥 Health Insurance Companies
📊 Insurance Analysts
🧾 Claims & Operations Managers
💰 Finance & Risk Teams
🏢 Third-Party Administrators (TPAs)
🧑💼 Senior Leadership
Ideal for small, mid-size, and large insurance organizations.
### 👉 Click here to read the Detailed blog post
▶️ Visit our YouTube channel to learn step-by-step video tutorials
https://youtube.com/@PKAnExcelExpert


Reviews
There are no reviews yet.