


Building a diverse and inclusive workforce is no longer optional—it is a strategic priority. Organizations that actively monitor diversity metrics gain stronger innovation, better employee engagement, and improved decision-making. However, many HR teams still store diversity data across multiple spreadsheets and HR systems. As a result, leadership lacks visibility into workforce composition, compensation patterns, and diversity-related costs.
That is exactly why the Employee Diversity Dashboard in Google Sheets becomes an essential HR analytics and DEI reporting tool.
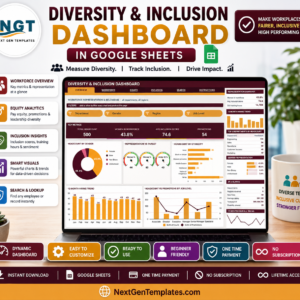
This ready-to-use dashboard transforms raw employee data into a structured, visual, and insight-driven reporting system. It allows HR teams, DEI leaders, finance teams, and executives to analyze workforce diversity, compensation, performance, and cost trends across departments, regions, employment types, and nationalities—all from one interactive Google Sheets dashboard.
Because the dashboard runs entirely in Google Sheets, it offers real-time updates, easy collaboration, automatic chart refresh, and cloud-based access without requiring expensive BI tools.
✨ Key Features of the Employee Diversity Dashboard in Google Sheets
👥 1. Centralized Workforce Diversity View
All diversity and workforce metrics are consolidated into a single dashboard, eliminating fragmented HR files and manual reporting.
💰 2. Workforce Cost & Compensation Tracking
Monitor salary, bonus, and total workforce cost alongside diversity metrics for complete financial visibility.
📊 3. Multi-Dimensional Analysis
Analyze diversity by department, region, nationality, gender, and employment status using intuitive charts.
📈 4. Monthly Trend Monitoring
Track how workforce size, compensation, and diversity metrics change month over month.
🤝 5. Google Sheets-Based Collaboration
HR and leadership teams can work together in real time with secure access controls.
📦 What’s Inside the Employee Diversity Dashboard in Google Sheets
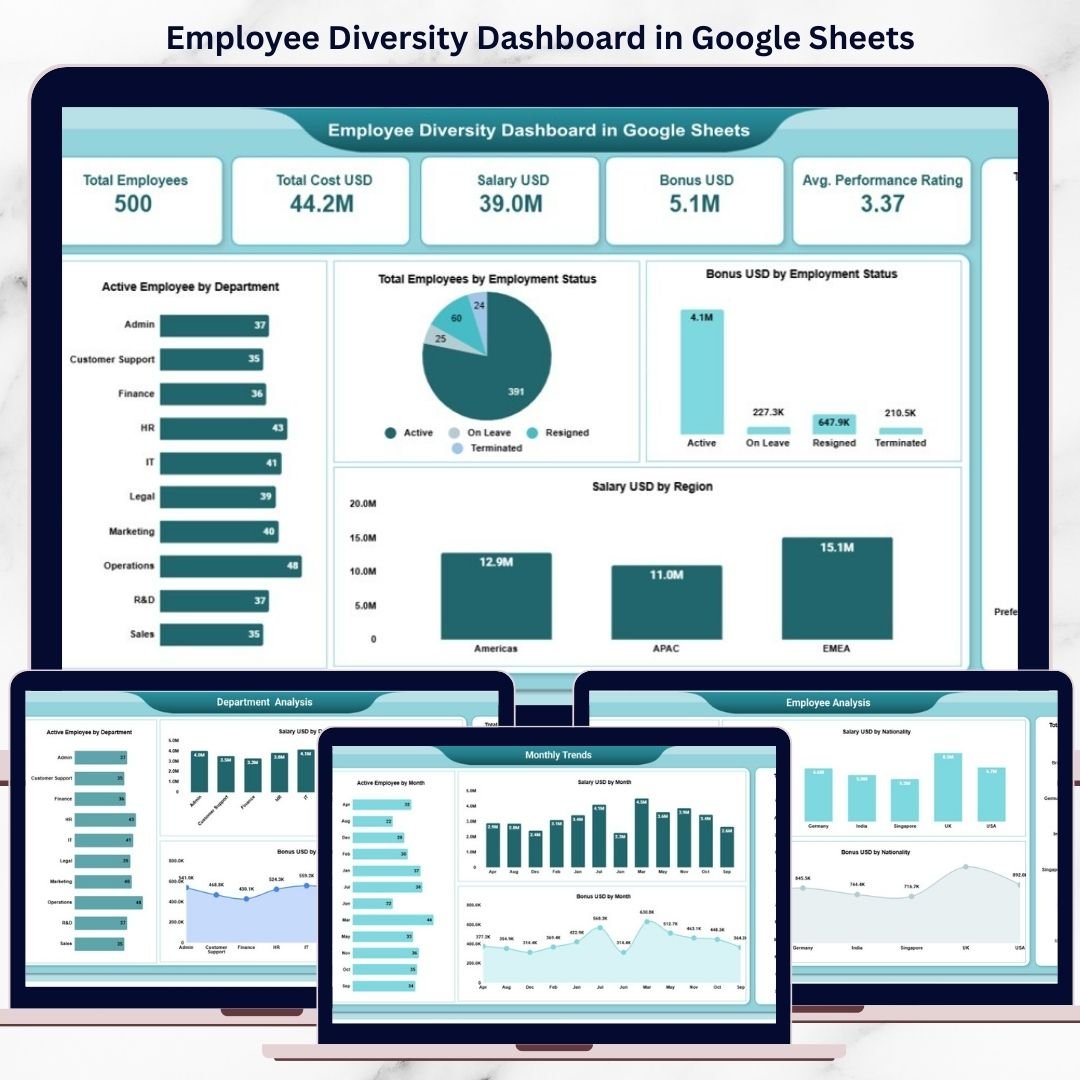
🖥️ Overview Sheet Tab – Workforce Snapshot
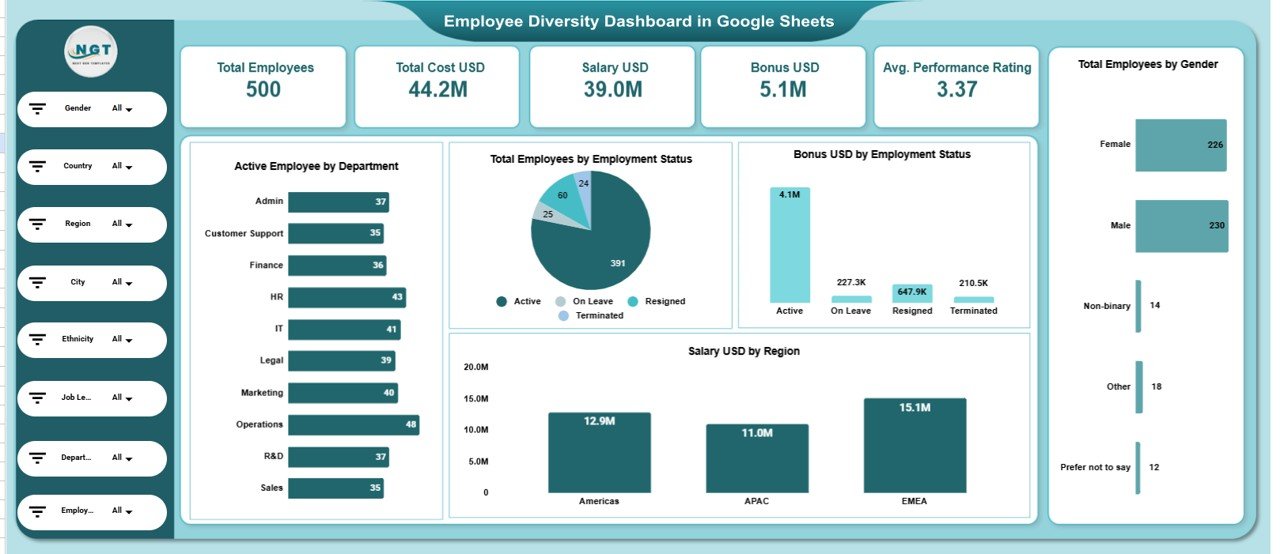
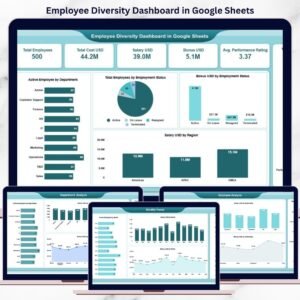
This is the main dashboard view that provides a high-level summary using KPI cards and charts.
📌 KPI Cards on the Dashboard
Total Employees – Overall workforce size
Total Cost USD – Total workforce cost
Salary USD – Total salary paid
Bonus USD – Total bonus paid
Average Performance Rating – Average employee performance score
These KPI cards help leadership instantly understand workforce scale, cost, and performance.
📊 Charts in the Overview Section
Active Employees by Department
Shows how employees are distributed across departments.
Total Employees by Employment Status
Visualizes full-time, part-time, contract, and other employment types.
Bonus USD by Employment Status
Highlights how bonuses are allocated across employment categories.
Total Employees by Gender
Provides a clear and simple gender diversity overview.
Salary USD by Region
Shows how compensation is distributed geographically.
All visuals refresh automatically when data changes.
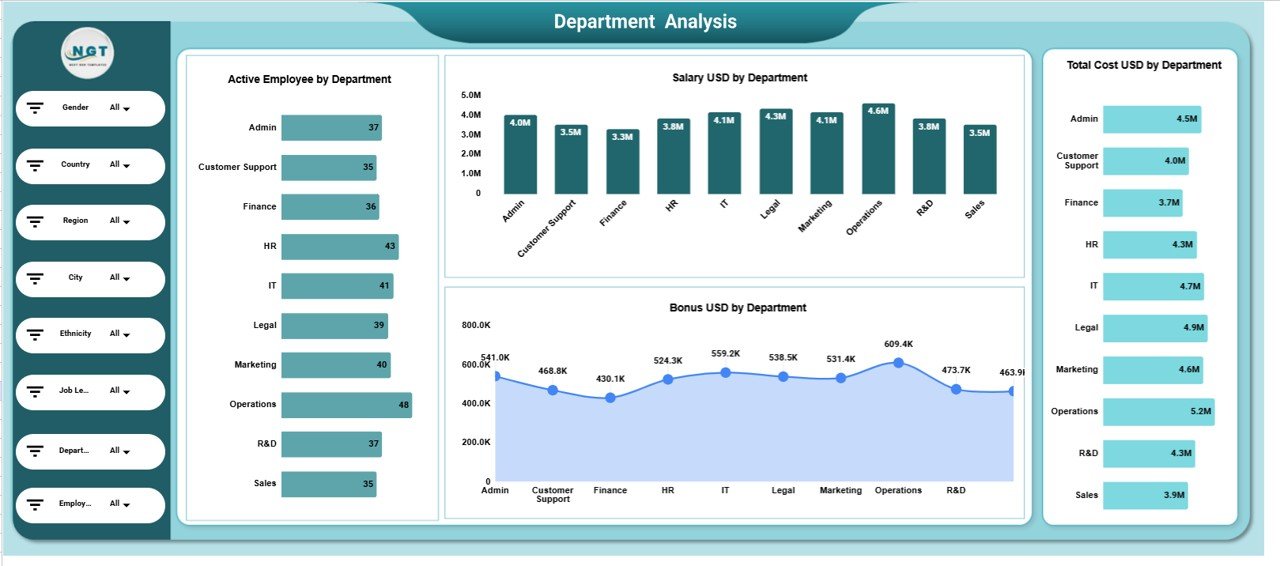
🏢 Department Analysis Section
This section evaluates workforce diversity and cost at the department level using:
Active Employees by Department
Salary USD by Department
Total Cost USD by Department
Bonus USD by Department
It helps HR teams identify departments with high costs, growth trends, or diversity gaps.
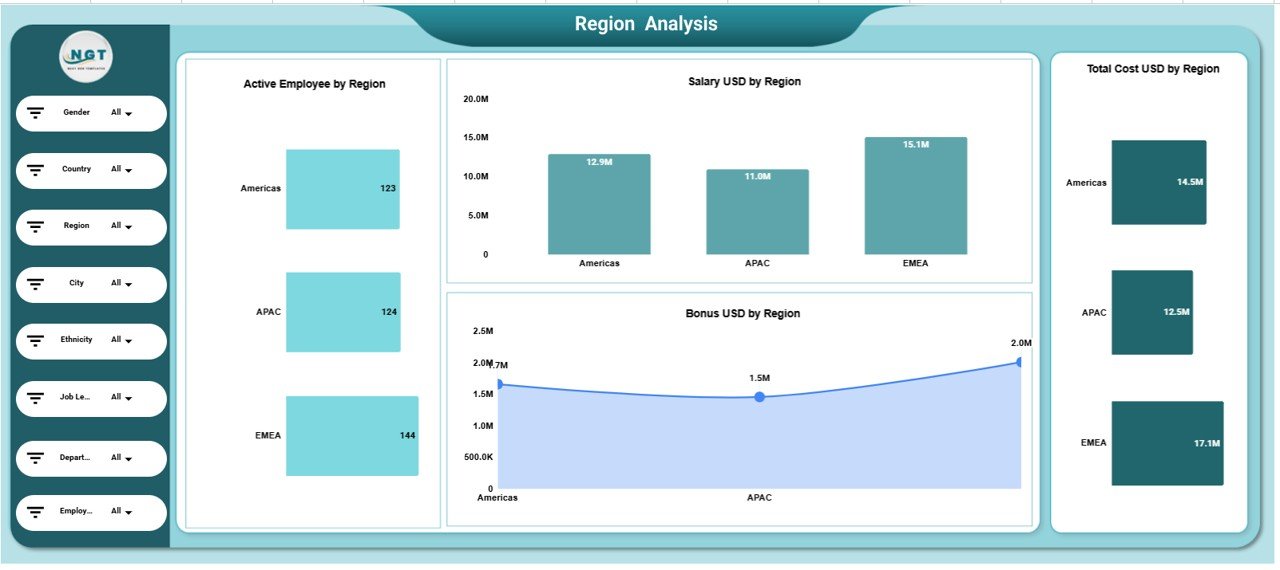
🌍 Region Analysis Section
This section focuses on regional workforce insights:
Active Employees by Region
Salary USD by Region
Total Cost USD by Region
Bonus USD by Region
It supports regional workforce planning and compensation benchmarking.
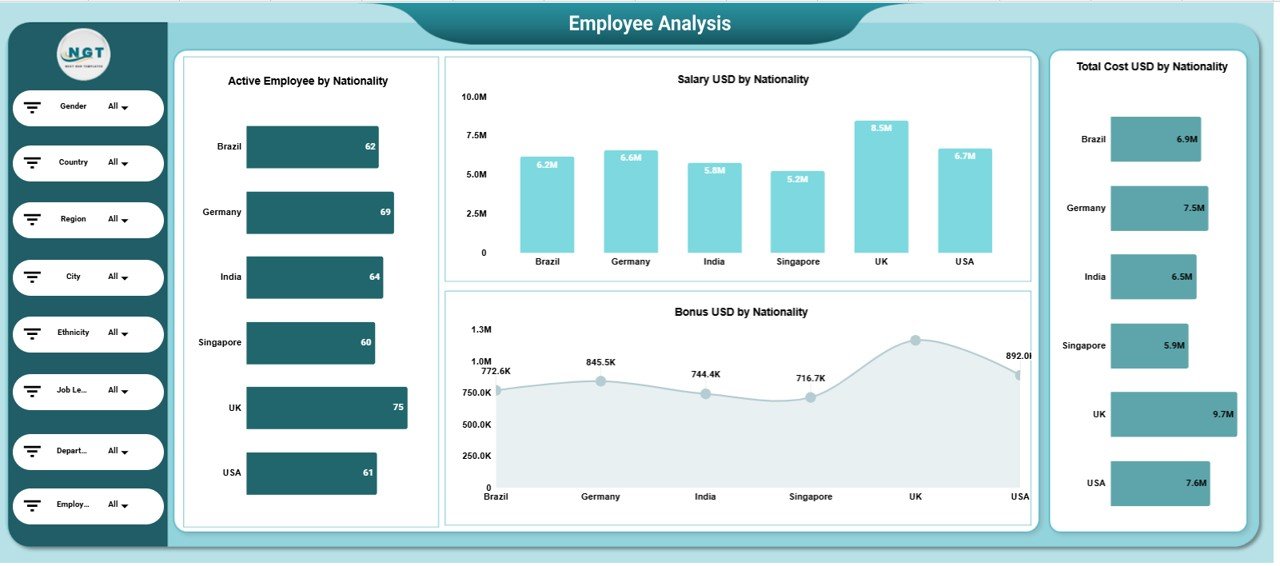
🧑🤝🧑 Employee Analysis (Nationality-Based)
This section analyzes cultural diversity using nationality-based metrics:
Active Employees by Nationality
Salary USD by Nationality
Total Cost USD by Nationality
Bonus USD by Nationality
It helps organizations monitor inclusion and global workforce balance.
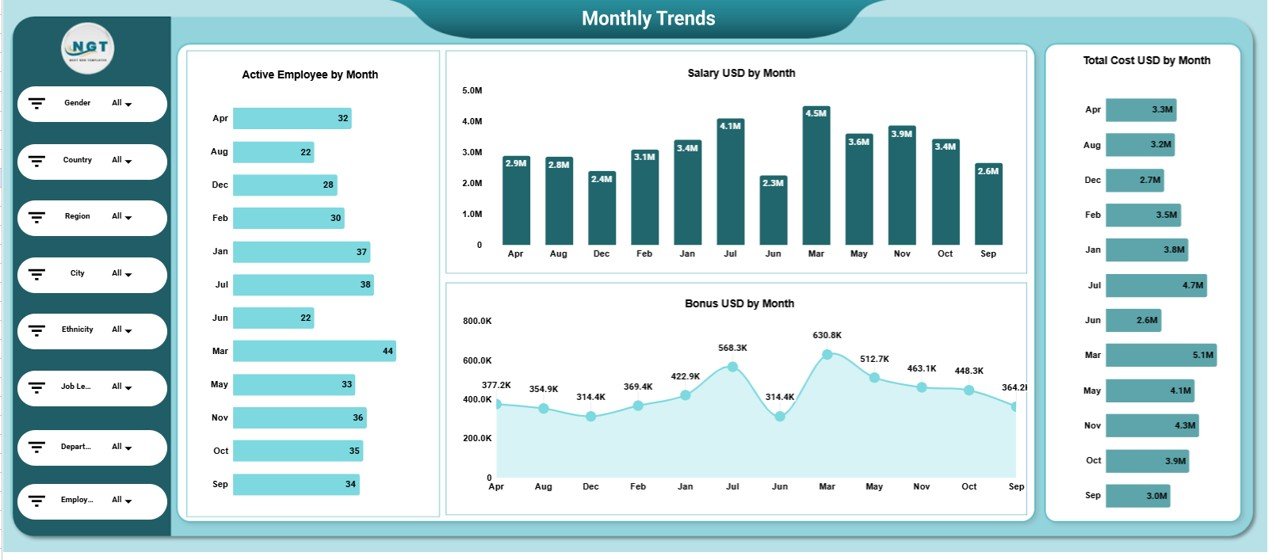
📅 Monthly Trends Analysis Section
Track workforce evolution across the year with:
Active Employees by Month
Salary USD by Month
Total Cost USD by Month
Bonus USD by Month
This reveals hiring patterns, seasonal changes, and cost growth trends.
📄 Data Input Sheet Tab – Backend Data Source
The Data Input sheet powers the entire dashboard. Typical columns include:
Employee ID
Department
Region
Nationality
Gender
Employment Status
Salary USD
Bonus USD
Performance Rating
Month
Updating this sheet automatically refreshes all dashboard visuals.
🎯 Who Can Benefit from This Employee Diversity Dashboard
👥 HR Teams
Track workforce diversity, costs, and performance effortlessly.
🌈 DEI Leaders
Monitor inclusion metrics and support diversity initiatives.
💼 Finance Teams
Analyze compensation and workforce cost trends.
🏢 Executives & Leadership
Gain a clear, data-driven view of workforce composition.
🚀 Growing Organizations
Scale diversity reporting without complexity.
### Click here to read the Detailed blog post
Watch the step-by-step video tutorial:
Visit our YouTube channel to learn step-by-step video tutorials — Youtube.com/@NeotechNavigators
Compatibility and Requirements
- Works in Google Sheets. You need a free Google account and a web browser.
- The dashboard reads from the Data Input sheet and the charts refresh when you change that data. Google explains how charts work in Add and edit a chart.
Frequently Asked Questions
What do the KPI cards on the Overview sheet show?
Five cards: Total Employees, Total Cost USD, Salary USD, Bonus USD and Average Performance Rating.
How do I update the dashboard?
Enter or paste your employee records into the Data Input sheet. The columns are Employee ID, Department, Region, Nationality, Gender, Employment Status, Salary USD, Bonus USD, Performance Rating and Month. All charts refresh from that sheet.
Can I analyze diversity by department, region and nationality?
Yes. There are separate analysis sections for Department, Region and Nationality. Each shows active employees, salary, total cost and bonus. The Overview also charts employees by gender and by employment status.
Does it show trends over time?
Yes. The Monthly Trends section charts active employees, salary, total cost and bonus by month.
Is there an Excel or Power BI version?
The Employee Turnover Dashboard is available in Excel and Power BI, if you want another HR dashboard on those platforms.
Related HR Templates
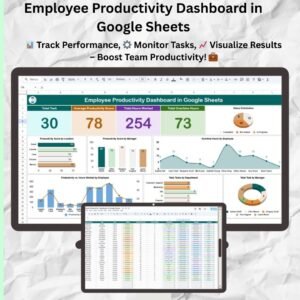
- Employee Productivity Dashboard in Google Sheets: another HR dashboard in Google Sheets
- Employee Attendance Tracker in Google Sheets: track attendance for the same workforce
- Employee Complaint Resolution Tracker in Google Sheets: log and close employee complaints
- Employee Turnover Dashboard in Excel: workforce turnover in Excel
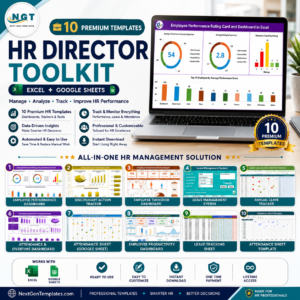
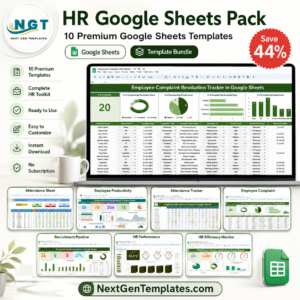
- HR Google Sheets Pack: 10 HR templates for Google Sheets in one download
Browse all Google Sheets HR and payroll templates or Google Sheets dashboards.





Reviews
There are no reviews yet.