



Soil Testing Services Dashboard form the backbone of modern agriculture, agribusiness, and environmental management. Farmers, laboratories, and agri-consultants depend on accurate soil analysis to improve crop yield, manage nutrients, and maintain long-term soil health. However, when soil testing data is managed manually across multiple Excel sheets or static reports, it leads to delays, errors, and poor visibility. That is exactly why the Soil Testing Services Dashboard in Excel becomes an essential operational and decision-making tool.
This ready-to-use Excel dashboard converts raw soil testing data into clear, interactive, and actionable insights. Instead of spending hours compiling reports, users can instantly track test volumes, turnaround time, pending tests, lab performance, and revenue from one centralized dashboard. As a result, soil testing organizations gain speed, accuracy, and control over their operations.
Built entirely in Microsoft Excel, this dashboard uses familiar features such as charts, KPI cards, slicers, and pivot-based logic. Therefore, users do not need advanced technical or BI skills. Anyone with basic Excel knowledge can operate, analyze, and present insights confidently.
## 🚀 Key Features of Soil Testing Services Dashboard in Excel
📊 Centralized Soil Testing Analytics
Monitor samples, tests, labs, crops, turnaround time, and revenue from a single dashboard.
🎛️ Interactive Right-Side Slicers
Filter data instantly by month, lab, crop, test type, region, or customer category.
🧭 Page Navigator for Easy Navigation
Move smoothly between analytical pages using one-click navigation buttons.
⏱️ Turnaround Time Tracking
Identify delays by test type, crop, lab, or customer category to improve service quality.
📈 Multi-Dimensional Performance Analysis
Analyze data by test, crop, lab, region, and time period.
💰 Revenue Visibility
Track revenue contribution by crop, test type, lab, and month.
⚡ Automated Charts & KPIs
Update data once, and all visuals refresh automatically without manual effort.
## 📦 What’s Inside the Soil Testing Services Dashboard in Excel

📄 Overview Page – High-level business snapshot with KPI cards and summary charts
📄 Test Analysis Page – Performance, volume, and revenue by test type
📄 Crop Analysis Page – Sample volume, completion, and turnaround by crop
📄 Lab Analysis Page – Efficiency, pending tests, and revenue by lab
📄 Month Analysis Page – Time-based trends for demand, turnaround, and revenue
📊 Data Sheet – Structured input sheet for all soil testing records
📊 Support Sheets – Background calculations and references
Each page answers a specific operational or business question clearly and visually.
## 🧭 How to Use the Soil Testing Services Dashboard in Excel
🟢 Step 1: Enter or update soil testing data in the Data Sheet
🟢 Step 2: Open the dashboard pages in Excel
🟢 Step 3: Use slicers to filter by lab, crop, test type, or month
🟢 Step 4: Review Overview KPIs for quick performance insights
🟢 Step 5: Drill into Test, Crop, and Lab analysis pages
🟢 Step 6: Use Month Analysis to track trends and seasonality
No advanced Excel skills are required—basic Excel usage is enough.
## 👥 Who Can Benefit from This Soil Testing Services Dashboard in Excel
🌱 Soil Testing Laboratories
🚜 Agricultural Service Providers
🧪 Agri-Consultants & Researchers
🏛️ Government Agriculture Departments
🌾 Fertilizer & Seed Companies
📊 Operations & Management Teams
If your organization handles soil testing data and performance tracking, this dashboard fits perfectly.
### 🔗 Click here to read the Detailed blog post
📺 Visit our YouTube channel to learn step-by-step video tutorials
👉 Youtube.com/@PKAnExcelExpert
Watch the step-by-step video tutorial:
Compatibility and Requirements
- Works in Microsoft Excel desktop (Excel 2016 or later, or Microsoft 365).
- The dashboard pages use slicers to filter by month, lab, crop, test type, region or customer category. Microsoft explains them in Use slicers to filter data.
Frequently Asked Questions
Which pages are included?
The dashboard has an Overview page, Test Analysis, Crop Analysis, Lab Analysis and Month Analysis pages. It also has a Data Sheet for your soil testing records and Support Sheets for background calculations.
How do I update the dashboard?
Enter or update your soil testing records in the Data Sheet. The charts and KPI cards refresh from that data without manual work.
Can I filter by lab, crop or month?
Yes. The right-side slicers filter the data by month, lab, crop, test type, region or customer category.
Does it track turnaround time and revenue?
Yes. It tracks turnaround time by test type, crop, lab or customer category. It also shows revenue by crop, test type, lab and month, and pending tests by lab.
Is there a Power BI version?
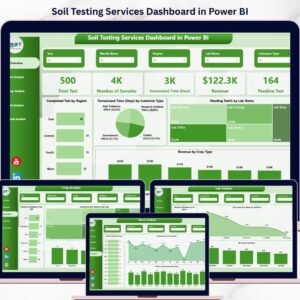
Yes. See the Soil Testing Services Dashboard in Power BI. There is also a Soil Testing Services KPI Dashboard in Excel.
Related Soil Testing Templates
- Soil Testing Services KPI Dashboard in Excel: a KPI-focused view of the same lab operations
- Soil Testing Services Dashboard in Power BI: the Power BI edition of this dashboard
- Soil Testing Services KPI Dashboard in Power BI: KPI tracking in Power BI
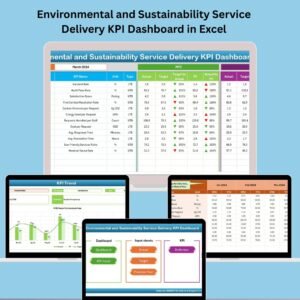
- Environmental and Sustainability Service Delivery KPI Dashboard in Excel: a related service-delivery KPI view
Browse all Excel dashboards.



























Reviews
There are no reviews yet.