Change is constant in modern organizations—but unmanaged change creates risk, cost overruns, frustrated users, and operational instability. Every IT change, infrastructure upgrade, process update, or system enhancement directly impacts cost, risk, timelines, and user experience. When change data remains scattered across Excel sheets, emails, and tickets, leadership loses visibility and control.
This is exactly where a Change Management Dashboard in Power BI becomes a game-changing solution.
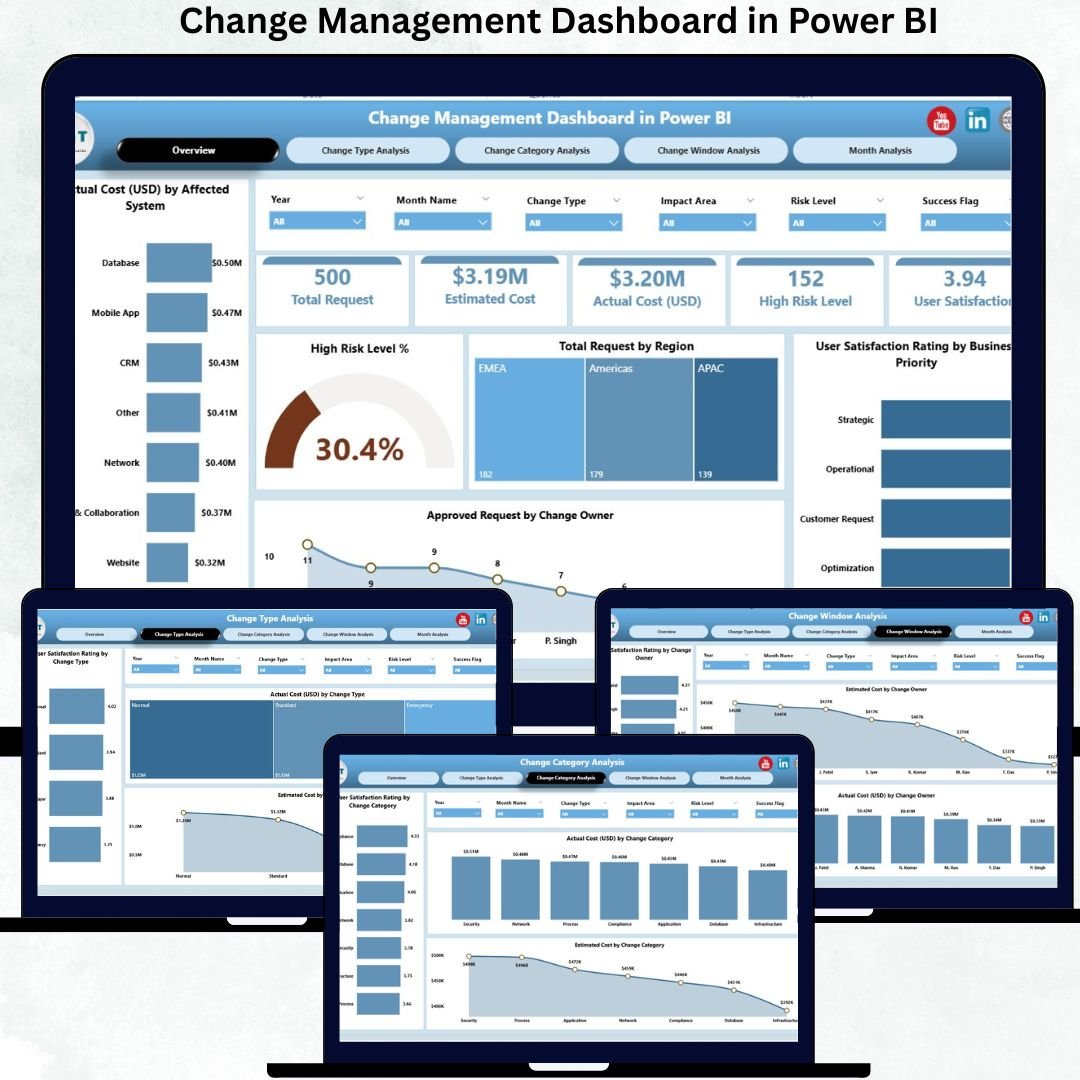
The Change Management Dashboard in Power BI transforms raw change request data into clear, interactive, and decision-ready insights. Instead of reacting to problems after they occur, organizations can proactively monitor change costs, risks, approvals, satisfaction, ownership, and trends—all in one centralized dashboard.
Built using Power BI’s advanced visualization and filtering capabilities, this dashboard empowers IT leaders, operations managers, and risk teams to identify issues early, control costs, and improve the success rate of organizational changes.
✨ Key Features of the Change Management Dashboard in Power BI
This dashboard includes five well-structured analytical pages, designed to provide complete change lifecycle visibility.
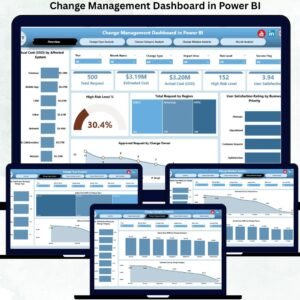
⭐ Overview Page – Instant Change Health Snapshot
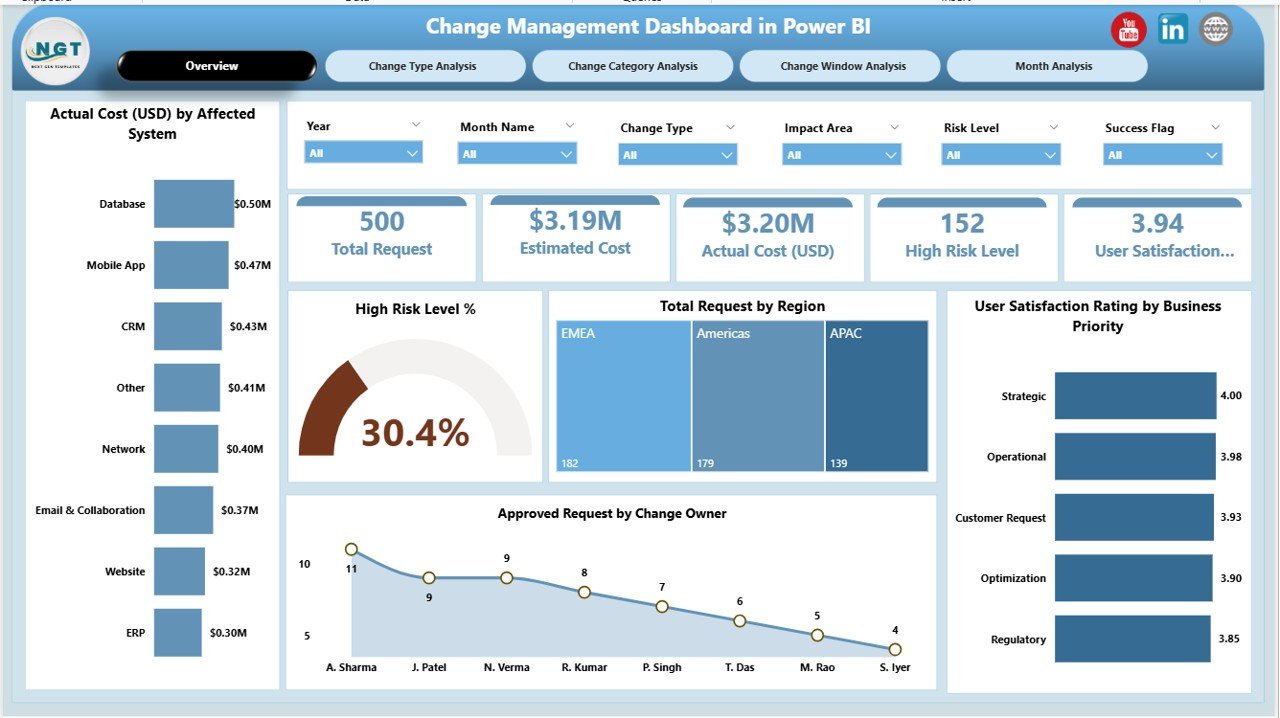
✔ KPI cards summarizing overall change performance
✔ Interactive slicers for dynamic filtering
✔ Key charts including:
-
Actual Cost (USD) by Affected System
-
High Risk Level %
-
Total Requests by Region
-
User Satisfaction Rating by Business Priority
-
Approved Requests by Change Owner
This page acts as the command center, giving leadership immediate clarity.
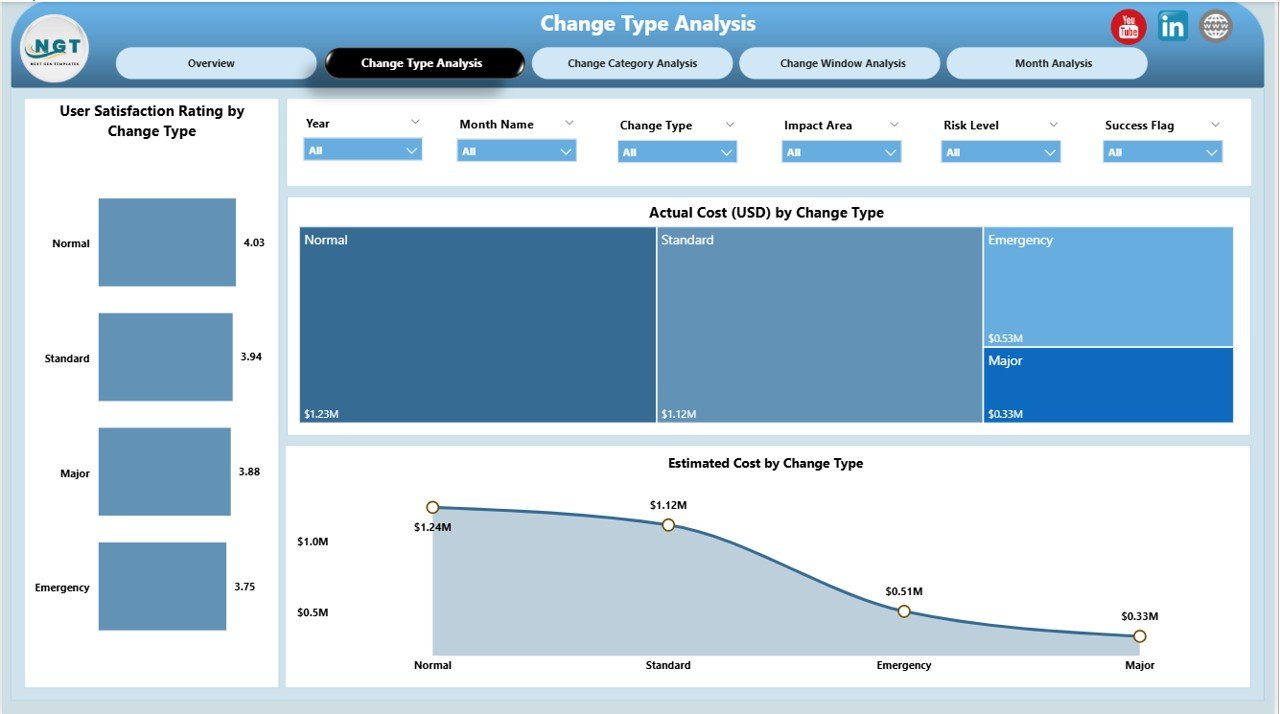
⭐ Change Type Analysis Page – Performance by Change Type
✔ User Satisfaction Rating by Change Type
✔ Actual Cost by Change Type
✔ Estimated Cost by Change Type
This page helps teams identify which change types create high cost or user impact, enabling better planning and approvals.
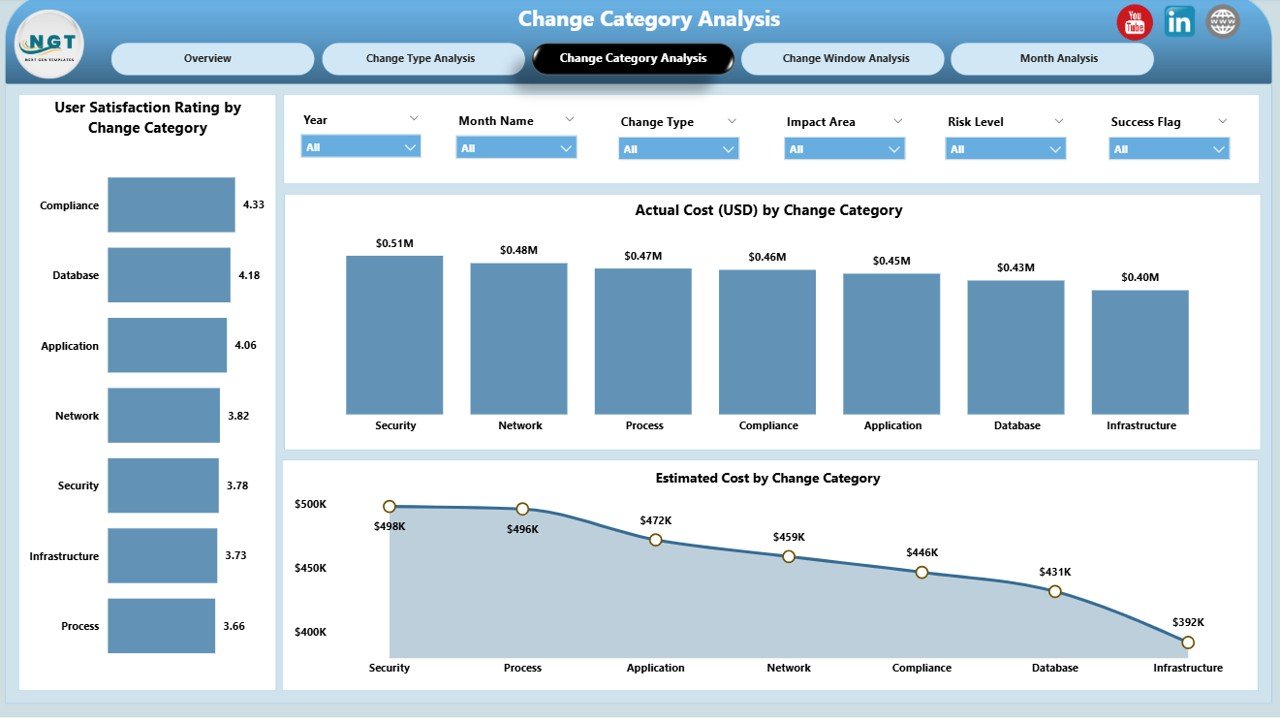
⭐ Change Category Analysis Page – Cost & Satisfaction Insights
✔ User Satisfaction Rating by Change Category
✔ Actual Cost by Change Category
✔ Estimated Cost by Change Owner
With category-wise analysis, organizations focus improvement efforts where they deliver the highest value.
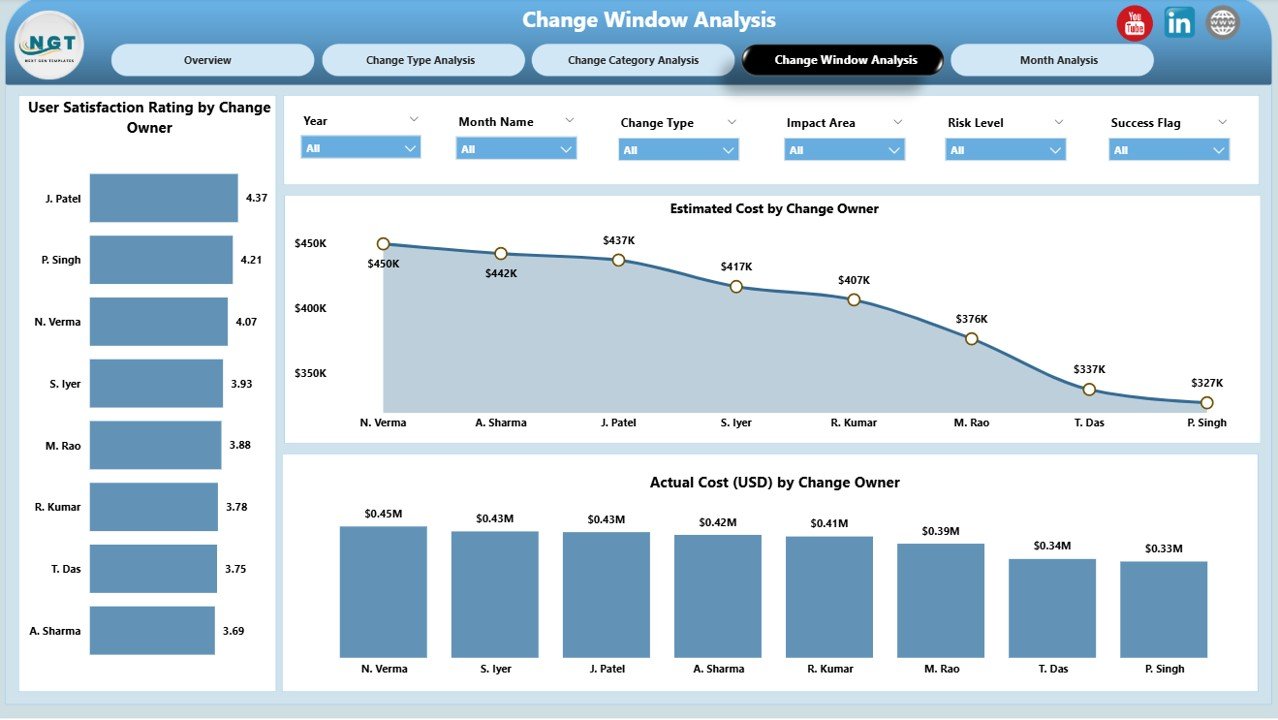
⭐ Change Window & Owner Analysis – Accountability Made Visible
✔ User Satisfaction Rating by Change Owner
✔ Actual Cost by Change Owner
✔ Estimated Cost by Change Owner
This page strengthens accountability by clearly showing how ownership and execution windows affect outcomes.
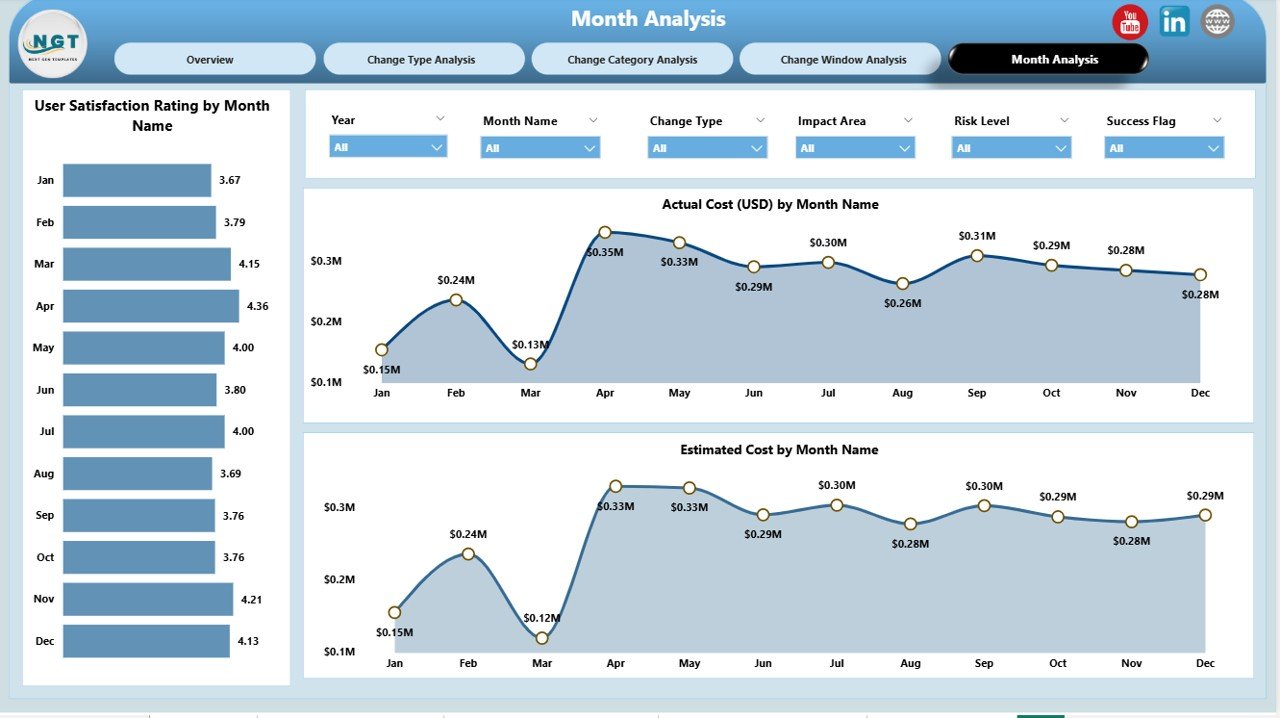
⭐ Monthly Trends Page – Long-Term Performance Visibility
✔ User Satisfaction Rating by Month
✔ Actual Cost by Month
✔ Estimated Cost by Month
Trend analysis helps teams detect recurring issues, forecast budgets, and improve future planning.
📦 What’s Inside the Change Management Dashboard in Power BI
When you purchase this product, you receive:
✅ Ready-to-use Power BI (.pbix) dashboard
✅ 5 interactive analysis pages
✅ Dynamic slicers for multi-level filtering
✅ KPI cards for quick insights
✅ Clean, professional visual design
✅ Scalable structure for small to large organizations
Once data is refreshed, the dashboard updates automatically.
🛠️ How to Use the Change Management Dashboard in Power BI
1️⃣ Connect your change data (Excel, SharePoint, or database)
2️⃣ Refresh the Power BI dashboard
3️⃣ Use slicers to filter by region, owner, change type, or month
4️⃣ Review KPIs and cost-risk indicators
5️⃣ Identify high-risk or high-cost changes
6️⃣ Monitor satisfaction and approval patterns
7️⃣ Take corrective action with confidence
No advanced Power BI skills are required.
👥 Who Can Benefit from This Change Management Dashboard
This dashboard is ideal for:
✔ IT Change & Incident Managers
✔ Service Delivery Teams
✔ Operations & Infrastructure Teams
✔ Risk & Compliance Managers
✔ Project Managers
✔ CIOs, CTOs & Senior Leadership
Any team responsible for change control or governance will benefit instantly.
### 📘 Click here to read the Detailed blog post
🎥 Visit our YouTube channel to learn step-by-step video tutorials
👉 Youtube.com/@PKAnExcelExpert


Reviews
There are no reviews yet.