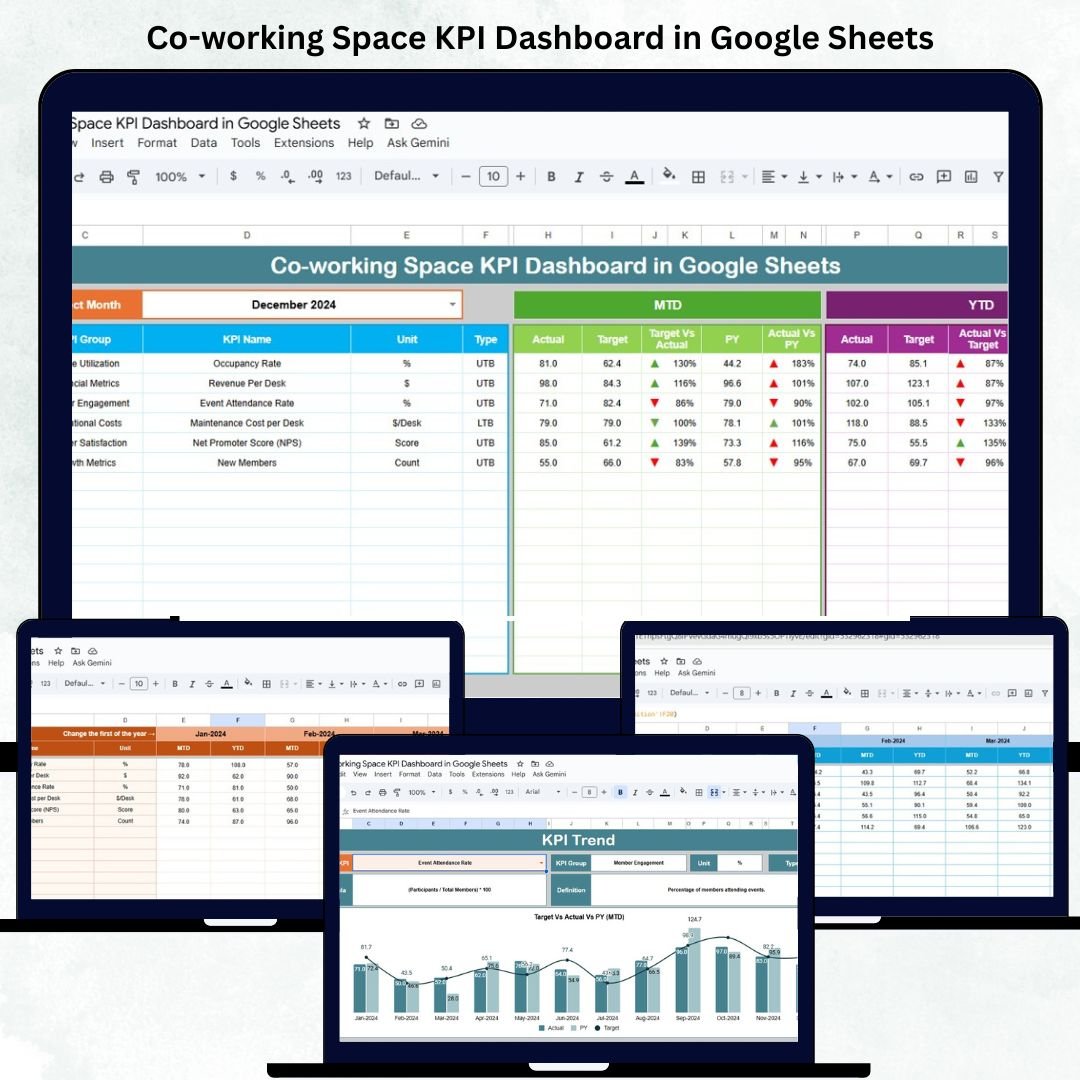
Managing a co-working space effectively requires constant monitoring of occupancy, revenue, expenses, and customer satisfaction. The Co-working Space KPI Dashboard in Google Sheets is a ready-to-use, data-driven solution designed to simplify performance tracking and decision-making for co-working space owners, operators, and administrators.
This automated Google Sheets dashboard consolidates all essential metrics — from occupancy rates to revenue growth — into one centralized platform. With built-in analytics, traffic-light indicators, and dynamic visuals, it helps teams evaluate performance and optimize business operations in real time.
💡 What Is a Co-working Space KPI Dashboard in Google Sheets?
A Co-working Space KPI Dashboard is an interactive reporting tool built entirely in Google Sheets. It enables users to track critical KPIs such as occupancy, revenue, customer satisfaction, and space utilization with precision.
The dashboard presents both Month-To-Date (MTD) and Year-To-Date (YTD) performance, comparing actual results with targets and previous year data. With color-coded visuals, up/down arrows, and real-time metrics, it provides instant insight into operational efficiency.
This dashboard ensures your team can monitor trends, analyze patterns, and make data-driven decisions — without needing advanced BI tools.
📊 Dashboard Structure Overview
The dashboard consists of 6 interconnected sheets, each serving a specific analytical function.
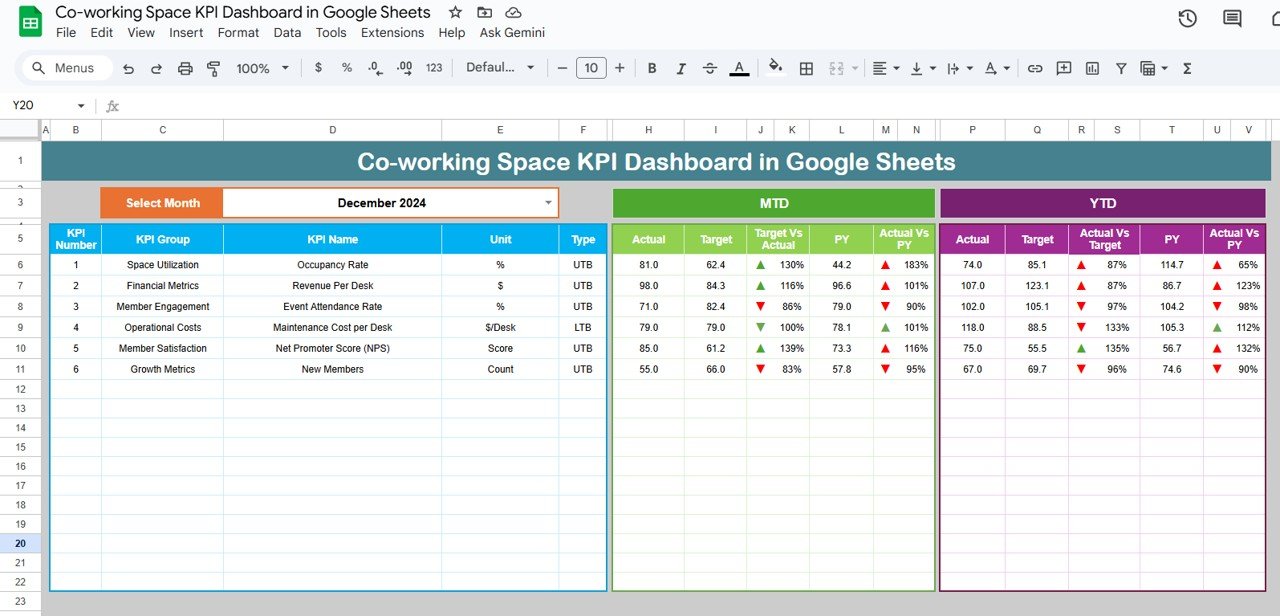
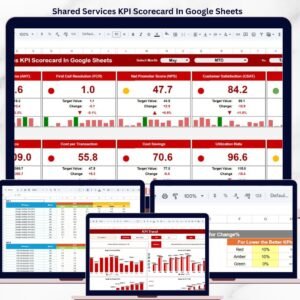
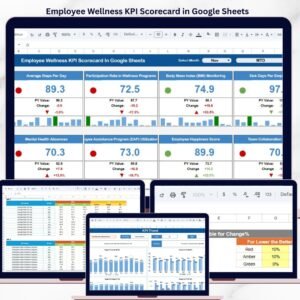
1️⃣ Dashboard Sheet Tab
The main dashboard page provides a comprehensive snapshot of co-working performance.
Key Features:
-
📅 Month Selector (Cell D3): Select any month to update all KPI visuals instantly.
-
📈 KPIs Displayed:
-
MTD Actual vs Target vs Previous Year
-
YTD Actual vs Target vs Previous Year
-
-
🚦 Conditional Formatting:
-
Green Arrow = Improvement
-
Red Arrow = Decline
-
This page provides a quick overview of performance trends and target achievement, making it ideal for weekly or monthly review meetings.
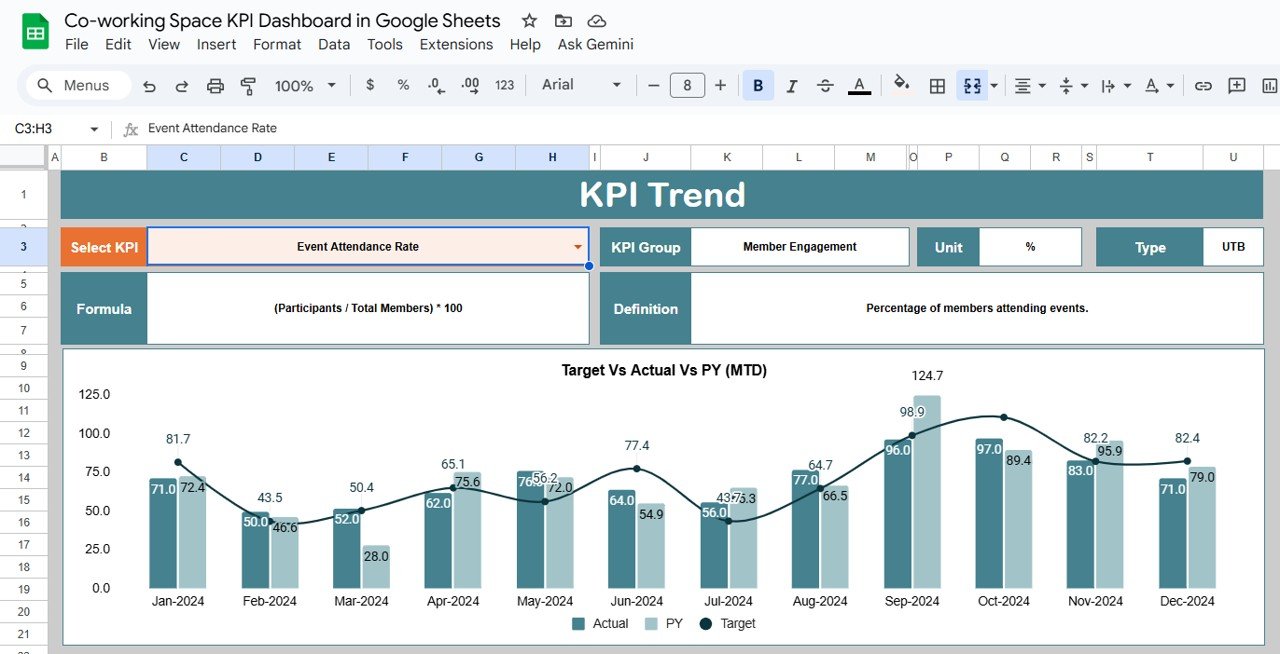
2️⃣ KPI Trend Sheet Tab
This tab enables detailed KPI analysis over time.
Select KPI (Cell C3) to view:
-
KPI Group
-
Unit of Measurement
-
Type (UTB – Upper the Better, LTB – Lower the Better)
-
Formula
-
Definition
-
Monthly performance chart
Perfect for identifying patterns, seasonality, and long-term progress.
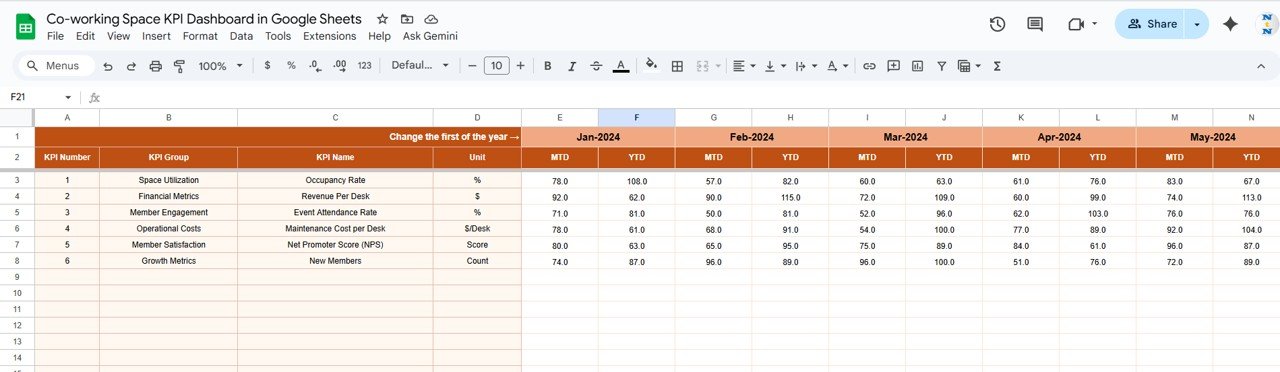
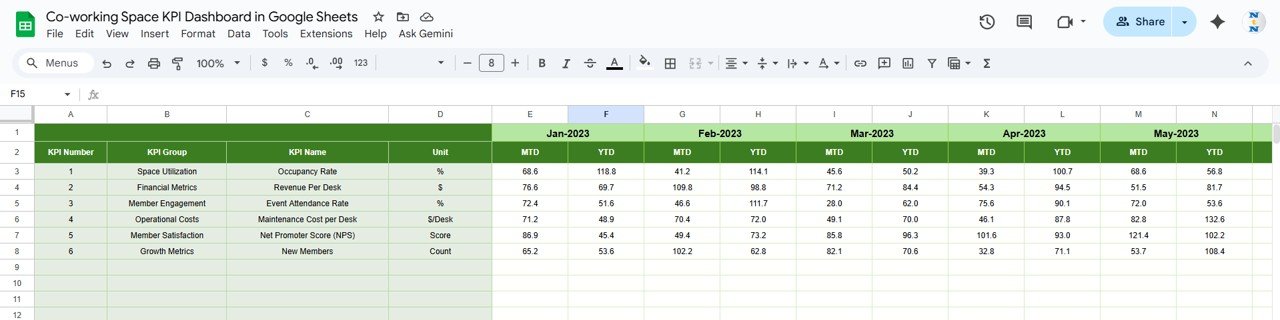
3️⃣ Actual Number Sheet Tab
This sheet stores all Actual KPI data.
Key Features:
-
Select first month (E1) for the reporting year.
-
Input monthly MTD and YTD KPI values.
-
Dashboard auto-updates comparisons and performance calculations.
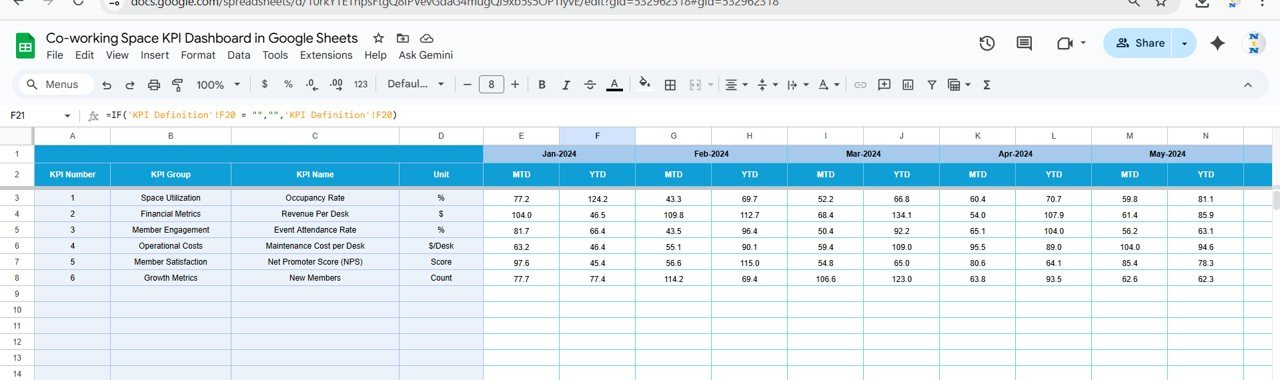
4️⃣ Target Sheet Tab
Here, teams can enter Target values for each KPI.
This sheet ensures every performance metric is measured against a defined benchmark, making variance and achievement analysis straightforward.
5️⃣ Previous Year Number Sheet Tab
Record last year’s KPI data here to track year-over-year (YoY) growth and progress.
This feature helps identify long-term improvement areas and supports forecasting.
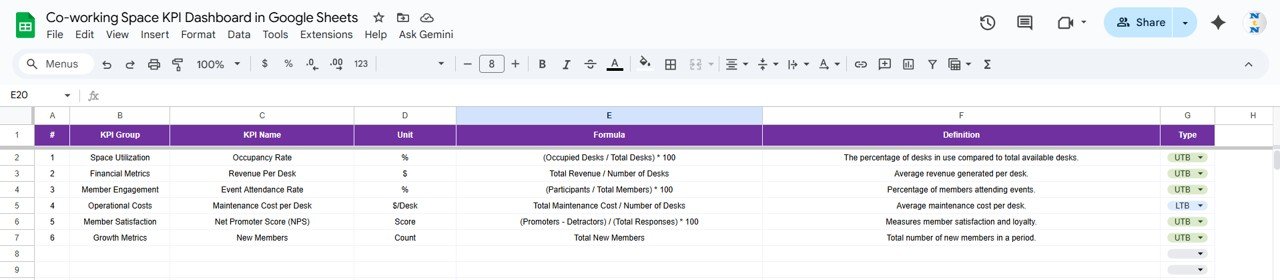
6️⃣ KPI Definition Sheet Tab
This reference sheet defines all KPIs in detail, ensuring consistent understanding across the team.
Columns include:
KPI Group | KPI Name | Unit | Formula | Definition | Type (LTB / UTB)
🌟 Advantages of the Co-working Space KPI Dashboard
-
📈 Comprehensive View: All business metrics — occupancy, finance, and satisfaction — in one place.
-
🧩 Real-Time Comparison: Instantly view Actual vs Target vs Previous Year results.
-
🚦 Visual Insights: Traffic lights and arrows make data interpretation easy.
-
👥 Collaboration-Friendly: Multiple users can update data simultaneously via Google Sheets.
-
🔄 Scalable Structure: Add more KPIs, locations, or teams as your business grows.
-
🧮 Instant Calculations: No manual effort — all formulas and visualizations are automated.
-
💡 Strategic Insight: Pinpoint underperforming metrics and focus on improvement.
🚀 Opportunities for Improvement
Enhance this dashboard further with automation and integrations:
-
🧾 Google Forms Integration: Collect occupancy or feedback data automatically.
-
🔔 Automated Alerts: Set notifications for KPIs below threshold.
-
📊 Predictive Analytics: Use formulas to forecast revenue and occupancy.
-
💰 Cost vs Revenue Analysis: Add a sheet to compare operating costs against income.
-
🔗 CRM Integration: Connect to Google Sheets CRM or Zapier to pull live leads or booking data.
💡 Best Practices for Using the Dashboard
✅ Update Actual and Target sheets monthly.
✅ Standardize KPI naming and units for consistency.
✅ Validate all input data before saving.
✅ Protect key formula cells to prevent accidental edits.
✅ Use conditional formatting to highlight key areas automatically.
✅ Review trends quarterly to make strategic adjustments.
✅ Conclusion
The Co-working Space KPI Dashboard in Google Sheets is a robust and intuitive management tool that brings together financial, operational, and customer performance insights in one place.
With automated updates, clear visuals, and built-in KPI logic, this dashboard empowers managers to make quick, data-driven decisions — helping you maximize occupancy, control costs, and improve member satisfaction.
Whether you manage a single space or multiple locations, this solution gives you a clear, visual understanding of your business performance — anytime, anywhere.
Click here to Read detailed blog post
Watch the step-by-step video Demo:


Reviews
There are no reviews yet.