

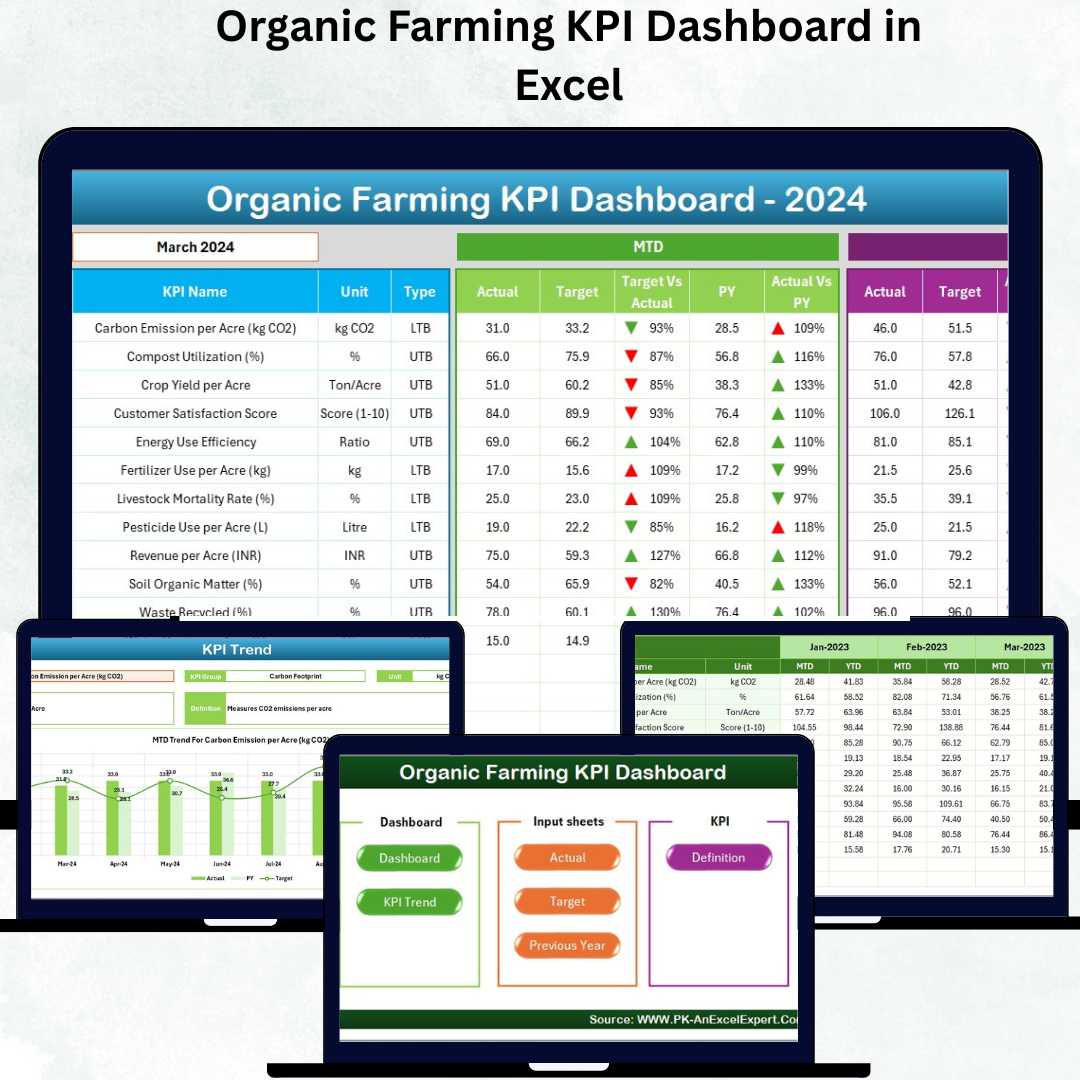

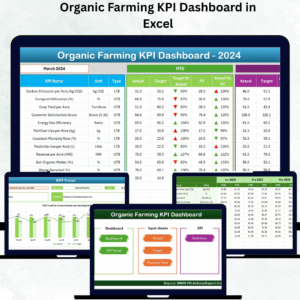
Sustainable agriculture is the future — and data is the foundation of that future. In today’s eco-conscious world, farmers and agricultural organizations must balance productivity, profitability, and environmental responsibility. The Organic Farming KPI Dashboard in Excel helps you do exactly that.
This ready-to-use Excel tool enables farmers, agricultural consultants, and sustainability managers to monitor critical Key Performance Indicators (KPIs) like crop yield, soil health, fertilizer efficiency, water usage, pest control, and profitability — all in one place. Designed for simplicity and clarity, this interactive dashboard turns complex farming data into easy-to-read visual insights.
Built for data-driven farming decisions, this Excel dashboard lets users analyze Month-to-Date (MTD), Year-to-Date (YTD), Target, and Previous Year (PY) performance — empowering teams to manage their farms efficiently and sustainably.
⚙️ Key Features of the Organic Farming KPI Dashboard in Excel
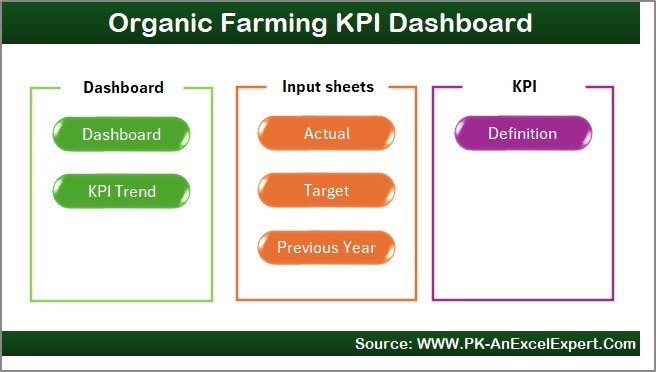
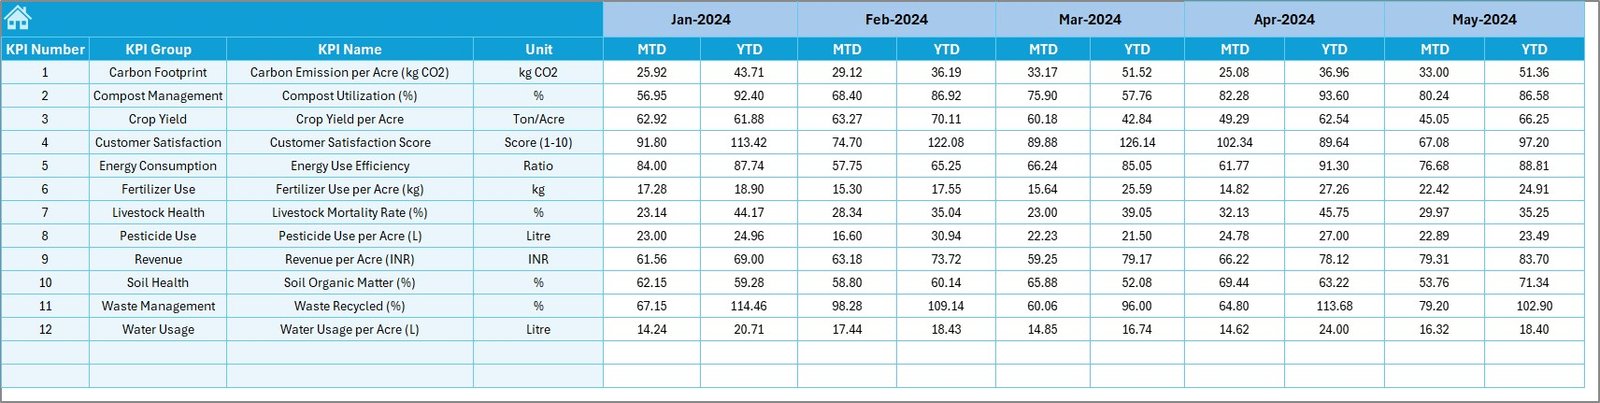
📊 7 Interconnected Worksheets – Home, Dashboard, KPI Trend, Actual Numbers Input, Target, Previous Year, and KPI Definition.
🧭 Interactive Navigation Buttons – Jump between sheets with a single click from the Home page.
📅 Dynamic Month Selector – Choose any month (cell D3) to instantly view updated MTD and YTD results.
📈 Actual vs Target vs PY Tracking – Evaluate growth with clear visual indicators.
🔺 Conditional Formatting Arrows – Green ▲ for performance improvement, Red ▼ for underperformance.
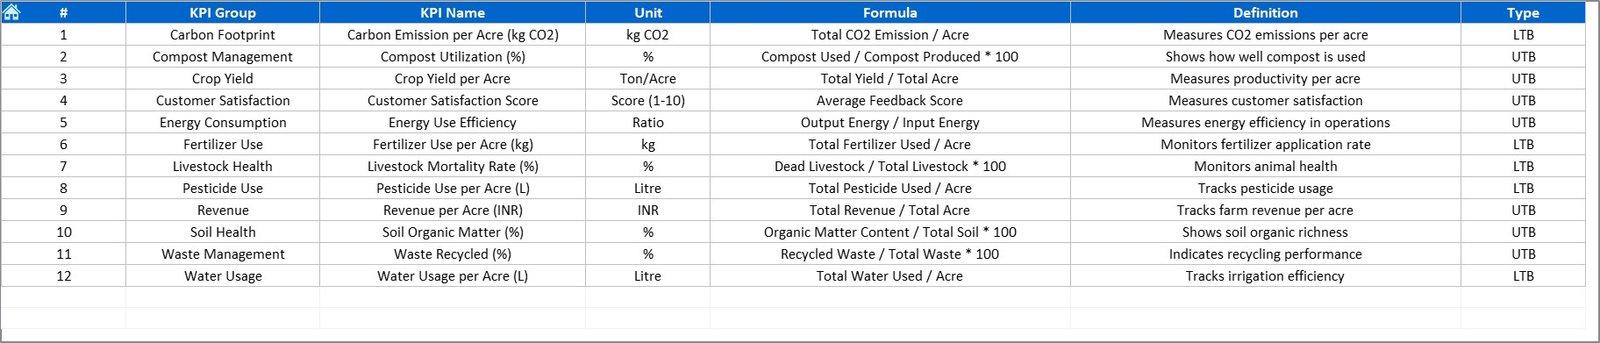
📘 KPI Documentation Sheet – Includes KPI name, formula, type (UTB/LTB), and unit.
💧 Comprehensive Data Inputs – Track metrics like crop yield, fertilizer use, and water efficiency.
📤 Exportable Reports – Print or share visuals for audits and presentations.
💡 Fully Customizable – Add new KPIs, modify layouts, or integrate with other systems.
🌾 What’s Inside the Dashboard
🏠 1️⃣ Home Sheet – The Control Center
Acts as a navigation hub with buttons to access each sheet instantly — ensuring seamless movement between dashboards and data sheets.
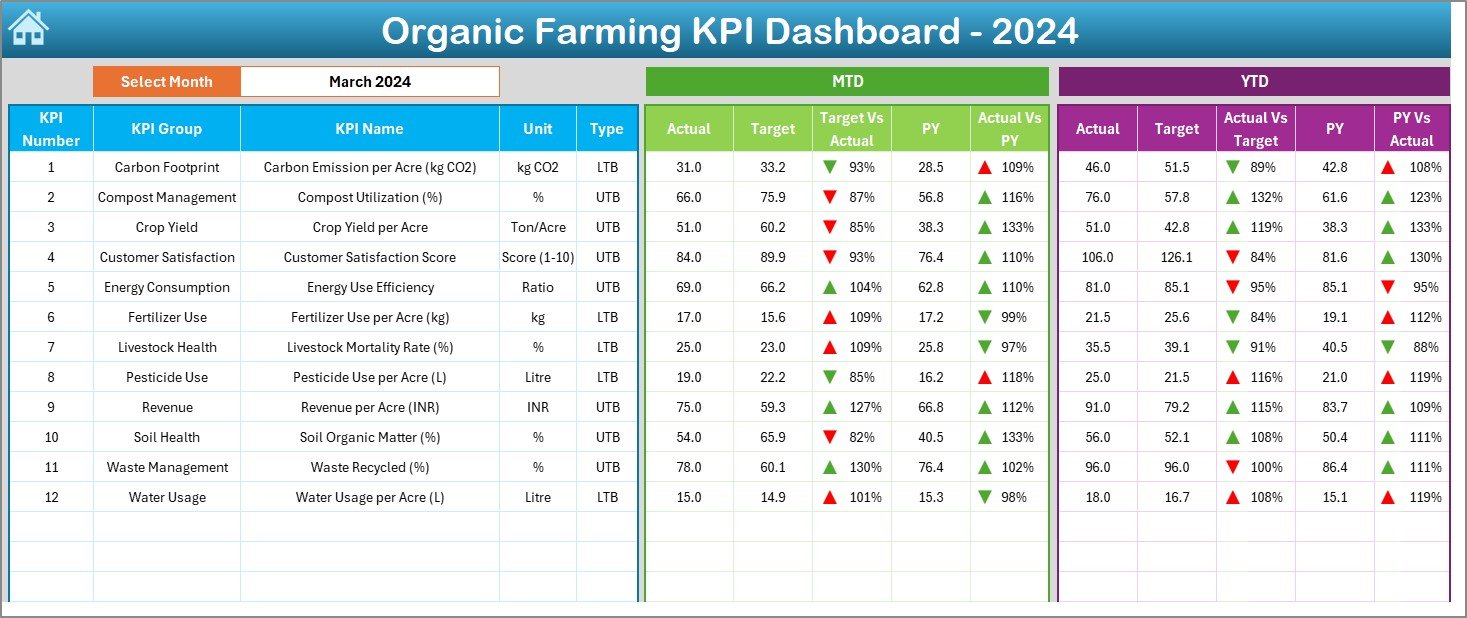
📊 2️⃣ Dashboard Sheet – The Core Visualization Panel
Displays all critical KPIs in an attractive, data-rich layout.
Month Selector (D3) updates visuals instantly.
MTD/YTD performance comparison.
Conditional formatting shows target vs actual progress.
💡 Purpose: Get a one-glance overview of farm productivity, soil quality, and sustainability results.
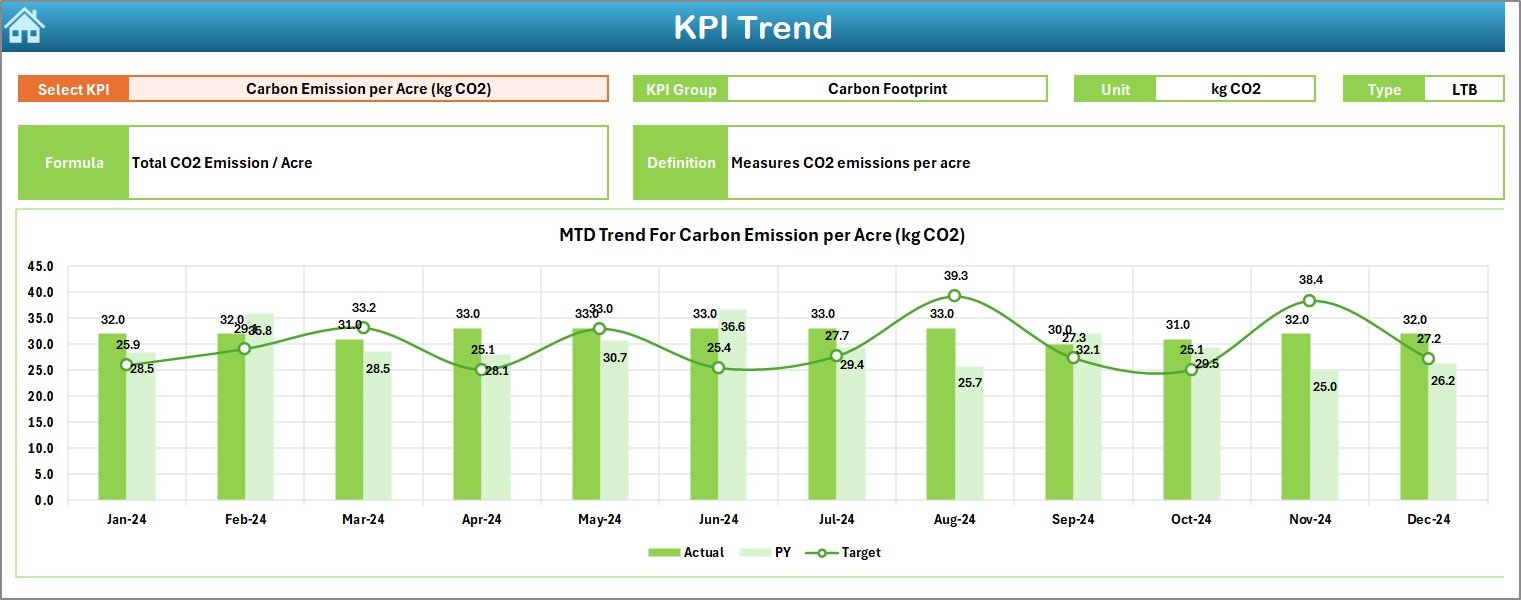
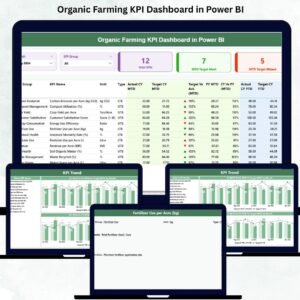
📈 3️⃣ KPI Trend Sheet – Track Seasonal Patterns
Select any KPI from the dropdown to view dynamic trend charts.
See how each metric has evolved month by month with Actual, Target, and PY comparisons.
🎯 Purpose: Identify yield patterns, efficiency trends, and performance dips.
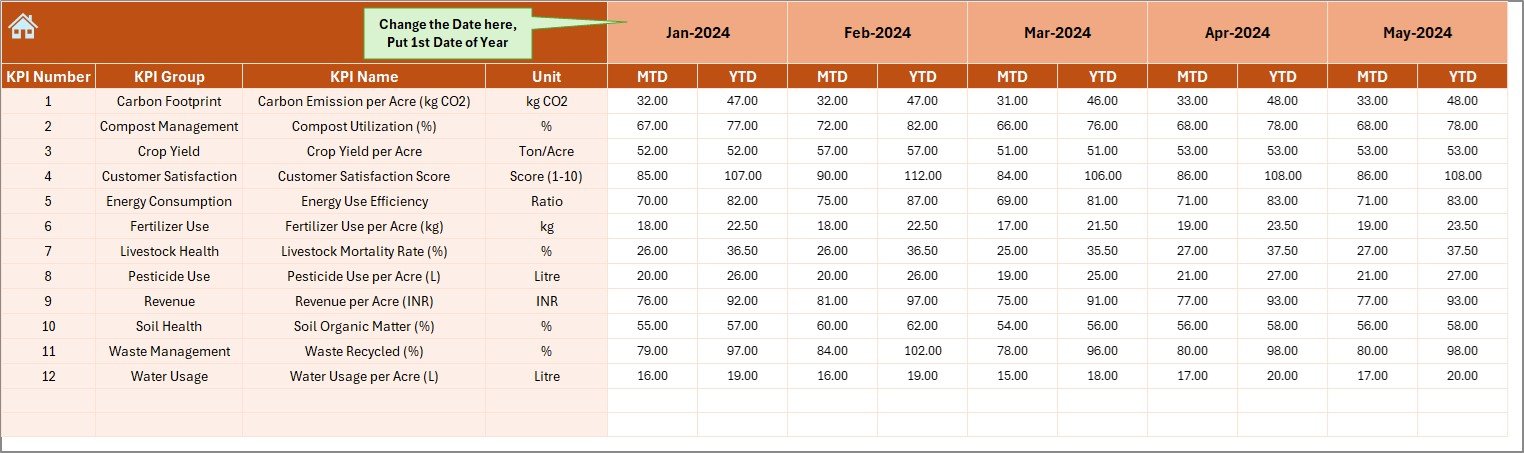
🌱 4️⃣ Actual Numbers Input Sheet – Data Entry Made Simple
Enter real-time monthly performance data like yield, area cultivated, fertilizer use, and revenue.
Automatic calculations refresh the dashboard instantly.
🎯 5️⃣ Target Sheet – Define Your Goals
Set targets for yield, cost reduction, sustainability, or resource efficiency.
Helps farmers stay goal-focused throughout the season.
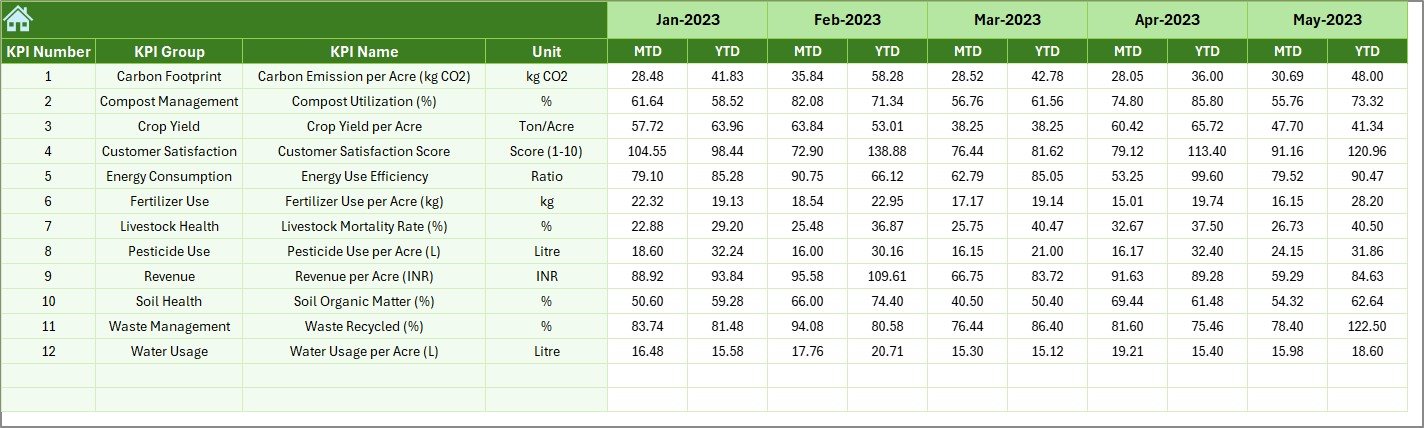
📉 6️⃣ Previous Year Sheet – Benchmark Historical Data
Store and compare past results to measure year-over-year improvements in productivity and resource use.
📘 7️⃣ KPI Definition Sheet – Full Clarity
Each KPI includes name, group, unit, formula, definition, and type (UTB/LTB).
Example:
🌾 Crop Yield (kg/ha) → UTB
🪰 Pesticide Use (L/ha) → LTB
🌟 Advantages of Using the Organic Farming KPI Dashboard
✅ Centralized Data Management – Track all farming KPIs in one Excel file.
✅ Faster Decision-Making – Visual cues simplify complex metrics.
✅ Audit-Ready – Ideal for certification programs and reporting.
✅ Cost Optimization – Identify waste in fertilizer, water, or energy use.
✅ Performance Benchmarking – Compare results across months or years.
✅ User-Friendly Interface – No coding; designed for practical farm use.
✅ Supports Sustainable Goals – Track environmental impact alongside profit.
🧠 Best Practices for Getting the Most Out of the Dashboard
📌 Maintain consistent units (kg, L, ha).
📌 Update MTD/YTD data regularly for accuracy.
📌 Set realistic yet challenging targets.
📌 Review progress monthly with your team.
📌 Use the KPI Trend Sheet to identify seasonality.
📌 Back up your file to the cloud for safety.
📌 Involve agronomists and workers in data entry for accuracy.
👥 Who Can Benefit from This Dashboard
🌾 Organic Farmers – Track yield, inputs, and sustainability metrics.
🏢 Farming Cooperatives – Standardize data across multiple farms.
🧑🌾 Agricultural Consultants – Support clients with visual performance reports.
🌍 NGOs and Sustainability Teams – Monitor environmental goals.
🎓 Educational Institutions – Teach data-driven organic farming.
🔗 Click here to read the Detailed Blog Post
📺 Visit our YouTube Channel for step-by-step video tutorials.
Watch the step-by-step video tutorial:
Compatibility and Requirements
- Works in Microsoft Excel desktop (Excel 2016 or later, or Microsoft 365).
- You pick the month from a selector in cell D3 and choose a KPI on the KPI Trend sheet from a dropdown. Microsoft explains dropdowns in Create a drop-down list.
Frequently Asked Questions
Which sheets are included?
Seven sheets: Home, Dashboard, KPI Trend, Actual Numbers Input, Target, Previous Year and KPI Definition.
How do I update the dashboard?
Enter your monthly figures in the Actual Numbers Input sheet and your goals in the Target sheet. Then choose a month in cell D3 on the Dashboard sheet and the MTD and YTD results refresh.
Can I compare this year with last year?
Yes. Store last year’s results in the Previous Year sheet and the dashboard compares them with your actuals and targets.
How do I see the trend for one KPI?
Open the KPI Trend sheet and select the KPI from the dropdown. The chart shows Actual, Target and Previous Year month by month.
Is there a Power BI version?
Yes. See the Organic Farming KPI Dashboard in Power BI.
Related Farming Templates
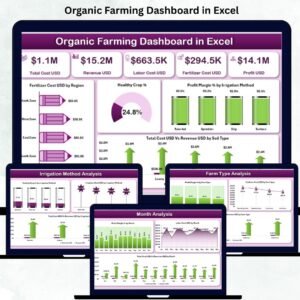
- Organic Farming Dashboard in Excel: another Excel dashboard for organic farms
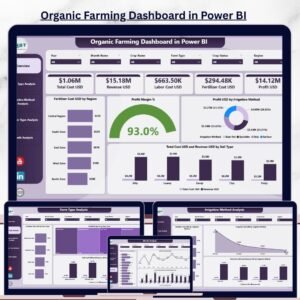
- Organic Farming KPI Dashboard in Power BI: the same KPIs in Power BI
- Greenhouse Farming KPI Dashboard in Excel: KPI tracking for greenhouse operations
- Poultry Farming KPI Dashboard in Excel: KPI tracking for poultry farms
- Organic Fertilizers KPI Dashboard in Excel: a KPI view for organic fertilizer suppliers
Browse all Excel KPI dashboards.
















Reviews
There are no reviews yet.