

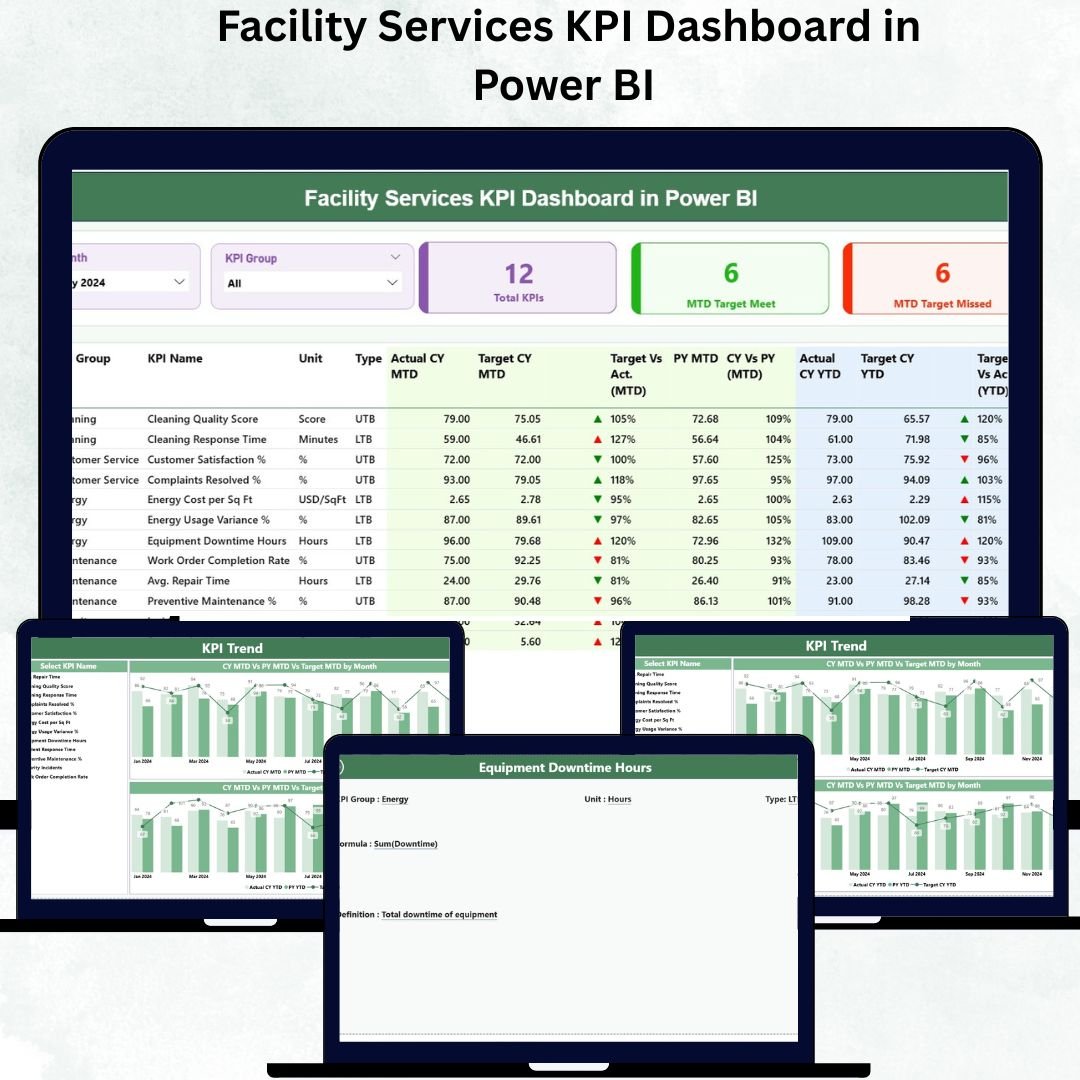

In today’s dynamic business environment, facility management plays a pivotal role in ensuring smooth operations, safety, and cost efficiency. From energy usage and maintenance costs to space utilization and service requests, every aspect of facility management generates valuable data. The challenge lies in turning that data into actionable insights.
That’s where the Facility Services KPI Dashboard in Power BI comes in — a powerful, interactive analytics solution that empowers facility managers and operations teams to monitor, analyze, and optimize performance metrics in real time.
Built entirely in Microsoft Power BI, this dashboard connects directly to Excel data sources and visualizes performance through interactive charts, slicers, and drill-through pages. It transforms raw facility data into clear visuals that drive smarter decisions and higher operational efficiency — without requiring coding skills or complex setups.
⚙️ Key Features of the Facility Services KPI Dashboard in Power BI
📊 Three Interactive Pages – Summary Page, KPI Trend Page, and KPI Definition Page.
📈 Automated Data Refresh – Connects seamlessly to Excel for instant updates.
🎯 KPI Cards & Performance Indicators – Displays total KPIs, target-met count, and missed count.
📍 Dynamic Filters (Slicers) – Filter by month, KPI group, or department in seconds.
📉 Combo Charts for MTD & YTD Trends – Track monthly and yearly KPI progress visually.
🧩 Drill-Through Functionality – Right-click any KPI to view its definition, formula, and type.
📘 Excel Data Integration – Linked to three sheets: Input Actual, Input Target, and KPI Definition.
💡 Automatic Icons & Color Cues – Green ▲ for improvement, Red ▼ for decline.
📊 Upper / Lower the Better Classification – Quickly interpret performance direction.
🔐 Scalable Design – Easily add new KPIs or connect other facility systems (CAFM, CMMS).
🧭 Dashboard Structure Overview
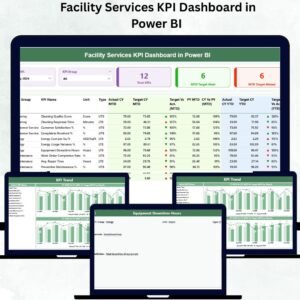
🏠 1️⃣ Summary Page – The Command Center
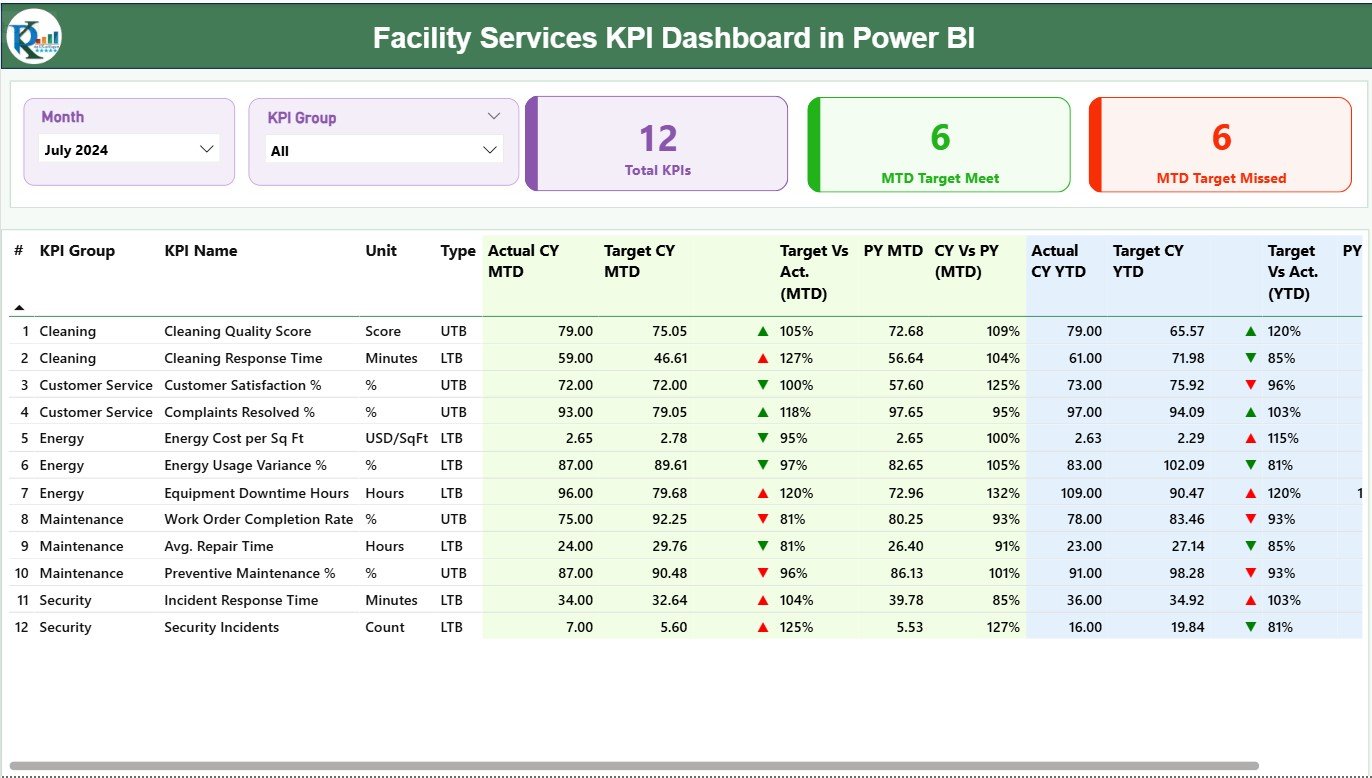
Filters: Month & KPI Group slicers for targeted analysis.
KPI Cards: Total KPIs Count, MTD Target Met, MTD Target Missed.
Detailed KPI Table: Displays KPI Name, Unit, Type (UTB/LTB), Actual vs Target (MTD & YTD), and comparison with Previous Year.
💡 Purpose: Instantly identify high-performing KPIs and those needing attention.
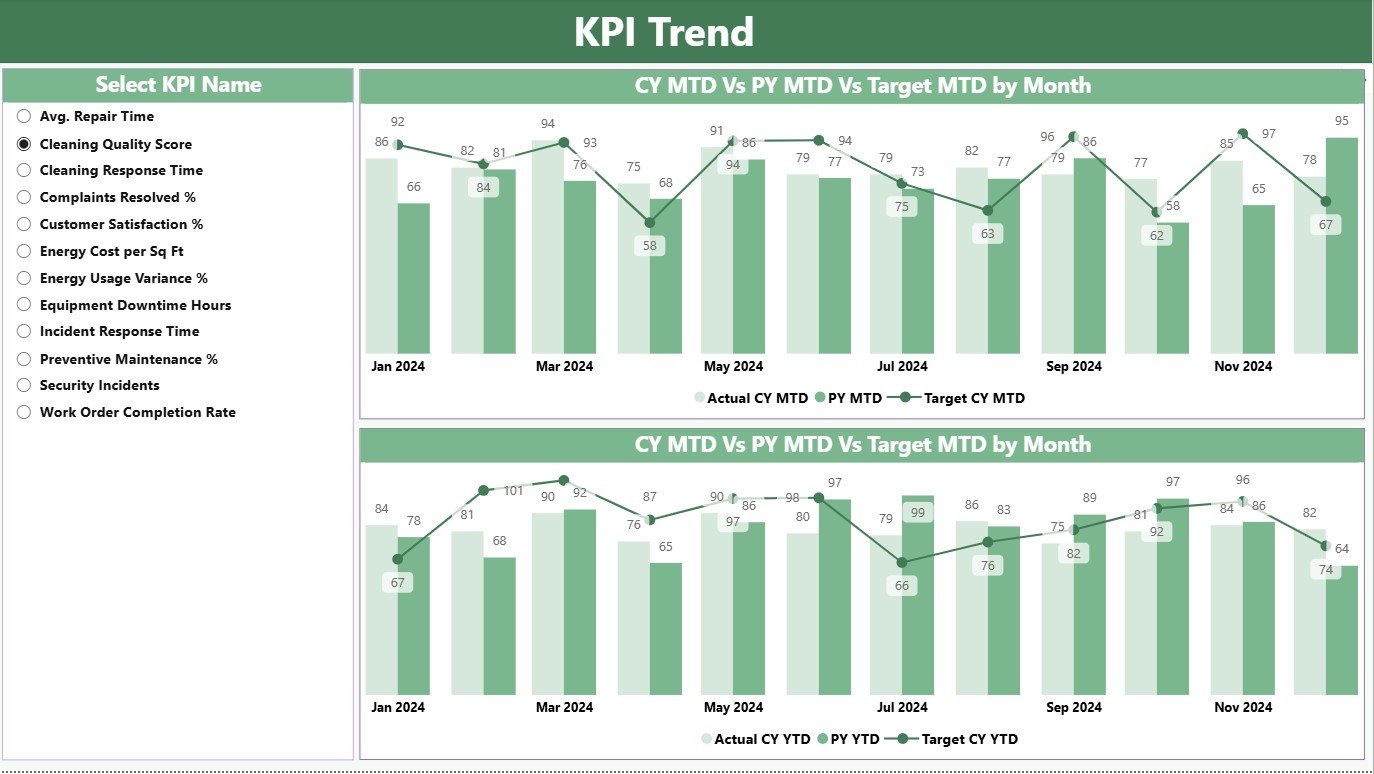
📈 2️⃣ KPI Trend Page – Track Performance Over Time
MTD and YTD Combo Charts compare Actual, Target, and Previous Year values.
KPI Slicer lets you select any metric to view detailed trend lines.
🎯 Purpose: Spot fluctuations and seasonal patterns to guide maintenance and budget decisions.
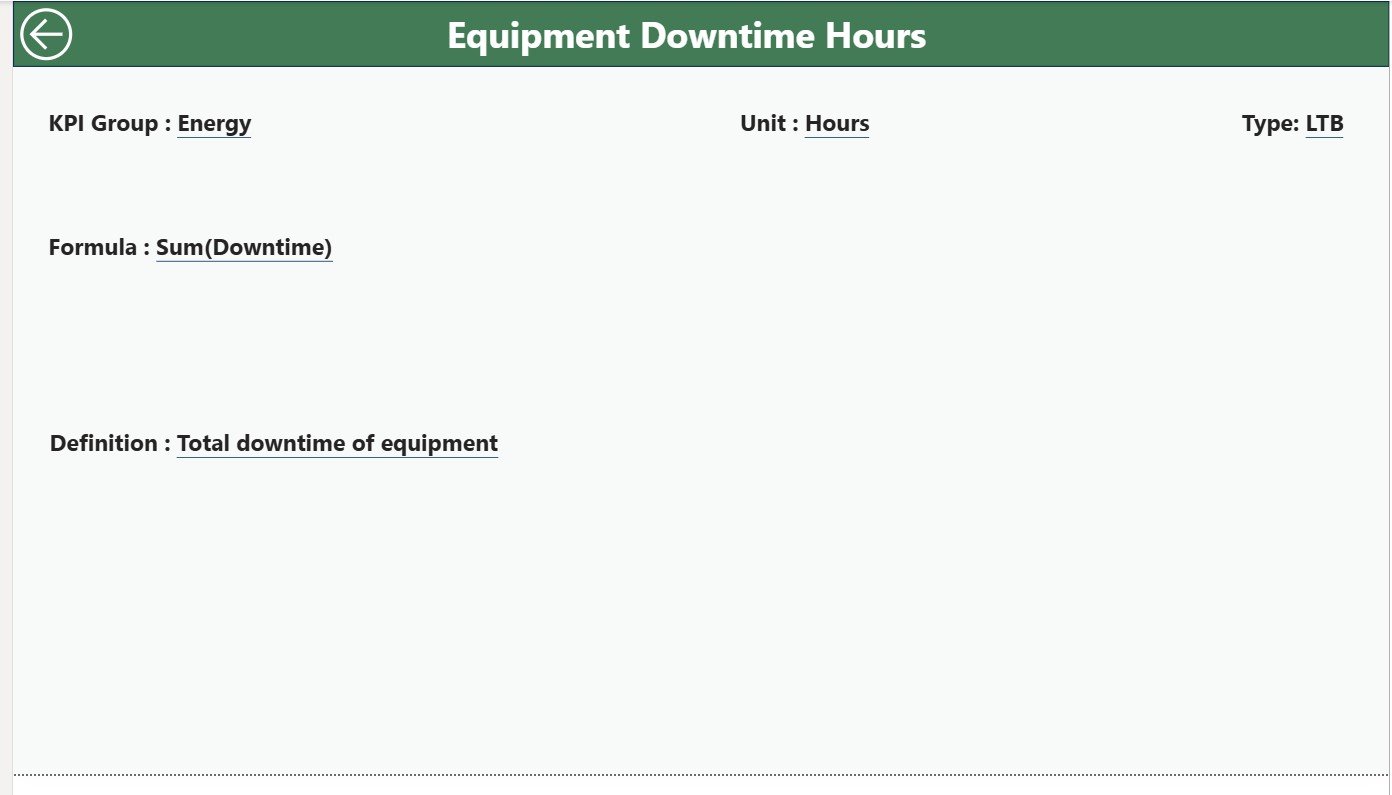
📘 3️⃣ KPI Definition Page – Drill-Through Details
Shows KPI Formula, Definition, and Type (UTB/LTB).
Activated via Drill Through from the Summary Page.
Back Button returns to main dashboard view.
💡 Purpose: Ensures clarity and consistency in KPI understanding across teams.
🧮 Excel Data Source Structure
Input Actual Sheet: Holds MTD and YTD actual values for each KPI.
Input Target Sheet: Stores target numbers for comparison.
KPI Definition Sheet: Lists KPI Group, Unit, Formula, and Description.
💾 Benefit: Update Excel monthly, refresh Power BI, and instantly see new insights.
🌟 Advantages of Using the Facility Services KPI Dashboard in Power BI
✅ Centralized Visibility – Monitor all facility KPIs from one dashboard.
✅ Real-Time Insights – Data refresh ensures you always see current performance.
✅ Reduced Manual Work – Eliminates hours of spreadsheet reporting.
✅ Actionable Visualization – Color icons highlight deviations immediately.
✅ Enhanced Transparency – All stakeholders access the same verified metrics.
✅ Cross-Department Standardization – Applies uniform reporting across maintenance, energy, and space teams.
✅ Customizable KPIs – Add new metrics or connect to other facility software.
🧠 Who Can Use This Dashboard
🏢 Facility Managers – Track maintenance costs and response times.
⚙️ Operations Heads – Monitor departmental efficiency.
💡 Executives & CFOs – Review cost savings and energy performance.
🧾 Finance Teams – Analyze budget adherence and spending trends.
🔧 Maintenance Supervisors – Identify downtime causes and improvement areas.
💡 Best Practices for Using the Dashboard
📌 Keep Excel data consistent and updated monthly.
📌 Schedule automatic Power BI refreshes.
📌 Use conditional formatting for clear visual alerts.
📌 Review and refine KPIs quarterly.
📌 Train users to navigate slicers and drill-throughs.
📌 Secure access with Power BI role-based permissions.
🏆 Real-World Use Cases
🏙️ Corporate Offices – Monitor energy costs and space usage.
🏥 Hospitals – Track equipment uptime and facility cleanliness KPIs.
🏭 Manufacturing Plants – Measure maintenance efficiency and downtime.
🏫 Universities – Analyze facility utilization and service requests.
🏬 Retail Chains – Monitor maintenance expenses across locations.
📈 Why Power BI Is Ideal for Facility Management
Power BI combines Excel’s familiarity with advanced analytics. It offers:
Automated data connections and visuals.
Drill-through and interactive filters.
Cloud sharing and role-based security.
Scalable integration with ERP and FM systems.
🔗 Click here to read the Detailed Blog Post
📺 Visit our YouTube Channel for step-by-step video tutorials.
Watch the step-by-step video tutorial:
Compatibility and Requirements
- Works in Power BI Desktop, which is free to download from Microsoft. See Get Power BI Desktop.
- The data comes from an Excel workbook with three sheets: Input Actual, Input Target and KPI Definition.
Frequently Asked Questions
How many pages does the dashboard have?
Three pages: Summary, KPI Trend and KPI Definition.
Where does the data come from?
The dashboard reads an Excel workbook with three sheets: Input Actual (MTD and YTD actual values), Input Target (targets) and KPI Definition (KPI group, unit, formula and description). Update the Excel file, refresh Power BI and the visuals update.
How do I see the formula and definition of a KPI?
Right-click a KPI on the Summary page and use drill-through to open the KPI Definition page. It shows the formula, the definition and the type (Upper the Better or Lower the Better). A back button returns you to the Summary page.
Can I filter the dashboard by month or KPI group?
Yes. The Summary page has Month and KPI Group slicers, and the KPI Trend page has a KPI slicer to pick one metric.
Is there an Excel version?
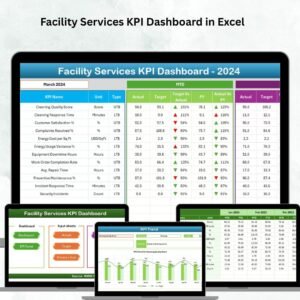
Yes. See the Facility Services KPI Dashboard in Excel.
Related Facility and Service Templates
- Facility Services KPI Dashboard in Excel: the same KPIs in an Excel workbook
- Cleaning Services KPI Dashboard in Excel: KPIs for cleaning operations
- Facility Maintenance & Renovation Tracker in Google Sheets: track maintenance and renovation jobs
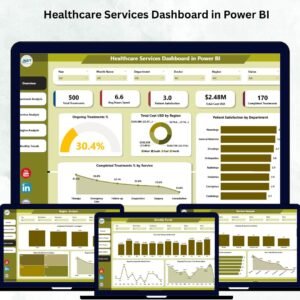
- Healthcare Services Dashboard in Power BI: another Power BI services dashboard
- Power BI Dashboard Mega Collection: 15 Power BI templates in one download
Browse all Power BI KPI dashboards.












Reviews
There are no reviews yet.