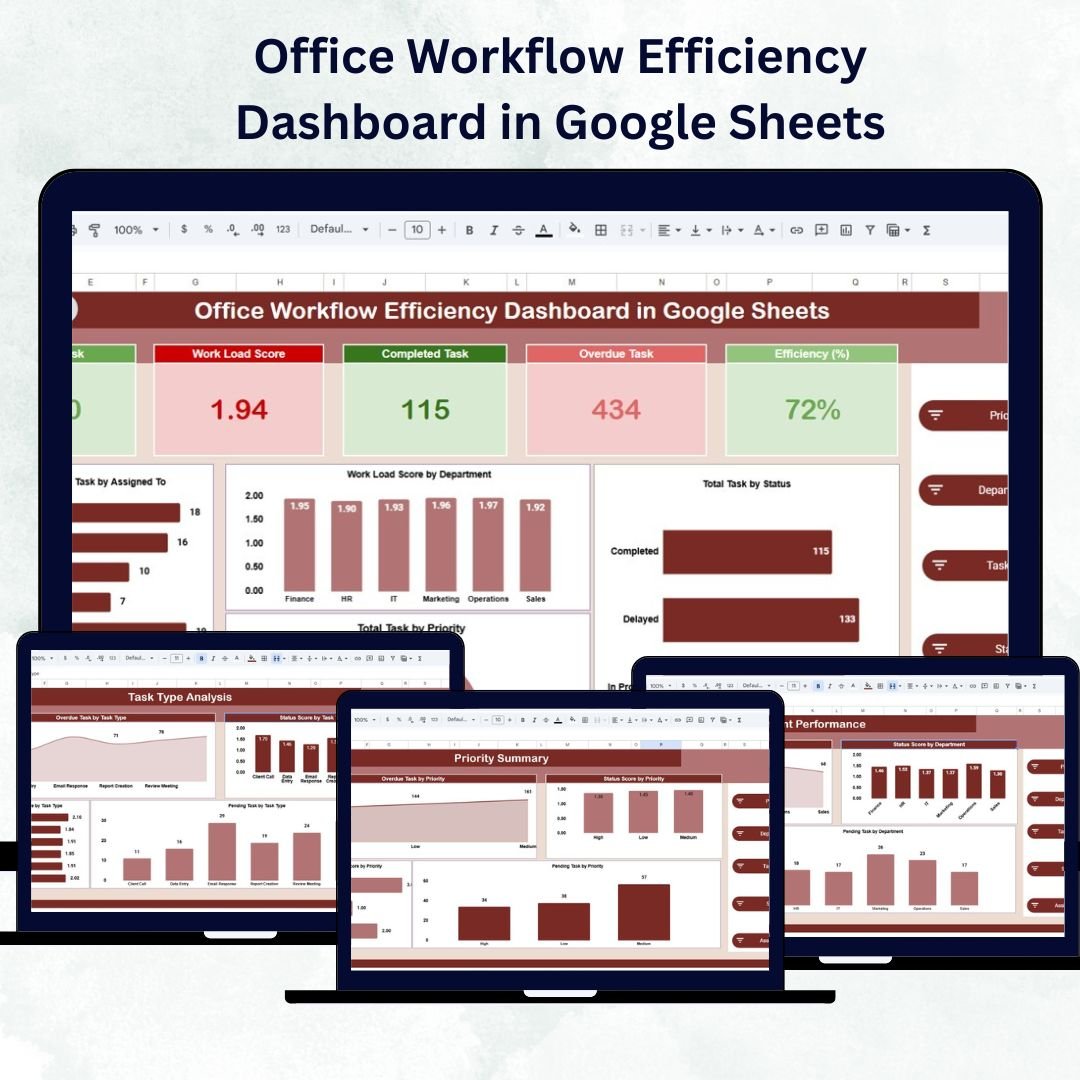
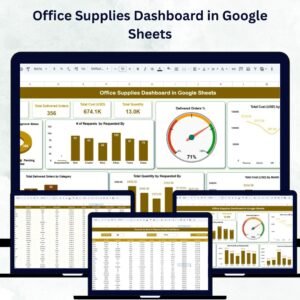
Efficient workflow management is the backbone of a productive office. The Office Workflow Efficiency Dashboard in Google Sheets is a ready-to-use, data-driven tool designed to track task completion, workload distribution, and departmental performance — all in one interactive and automated dashboard.
This powerful Google Sheets template helps organizations visualize workflow data, monitor task progress, identify bottlenecks, and improve productivity. Whether you’re managing HR operations, project tasks, or inter-departmental workflows, this dashboard ensures you stay organized and data-informed.
🔑 Key Features of the Office Workflow Efficiency Dashboard in Google Sheets
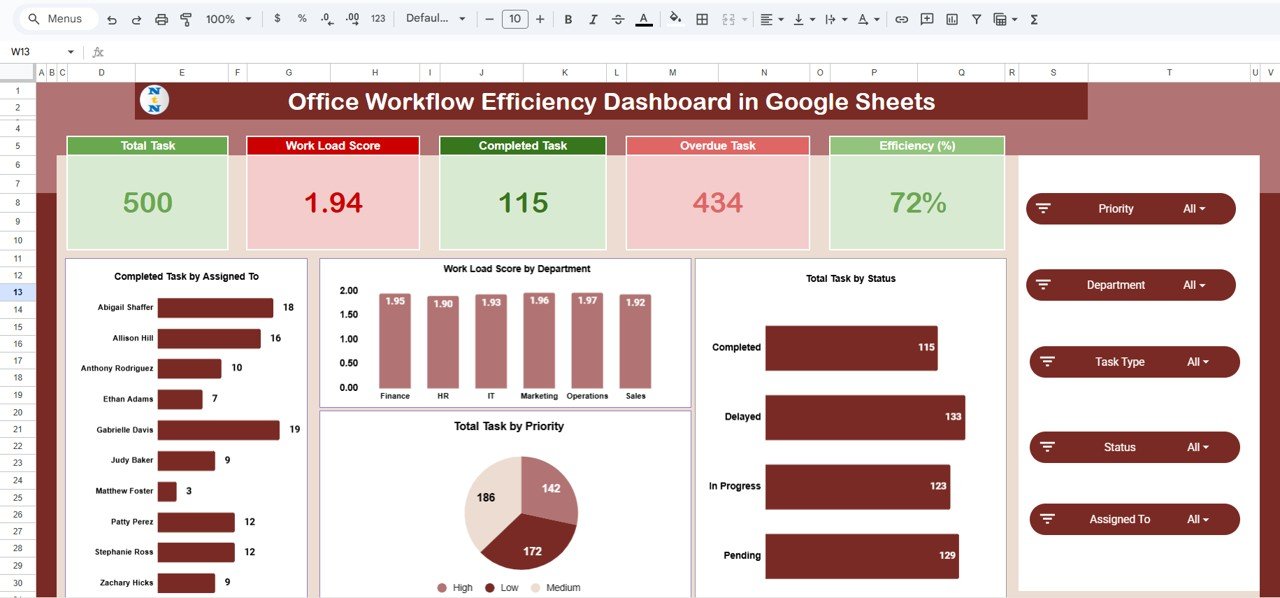
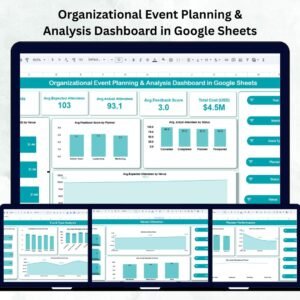
📋 Overview Page
Gain a quick snapshot of your office’s overall efficiency.
-
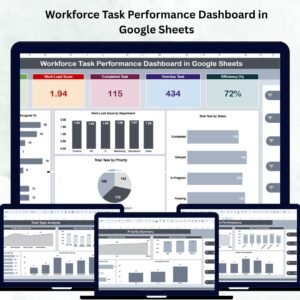
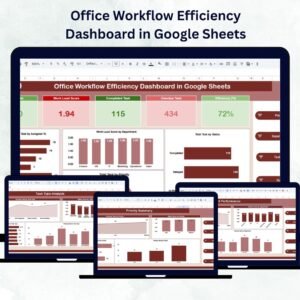
Cards Display: Total Tasks, Completed Tasks, Overdue Tasks, Workload Score, and Efficiency (%).
-
Visual Charts:
-
Completed Tasks by Assigned To – Measures individual performance.
-
Workload Score by Department – Highlights department load balance.
-
Tasks by Status & Priority – Visualizes progress and urgency.
This section helps managers understand productivity levels and workload at a glance.
-
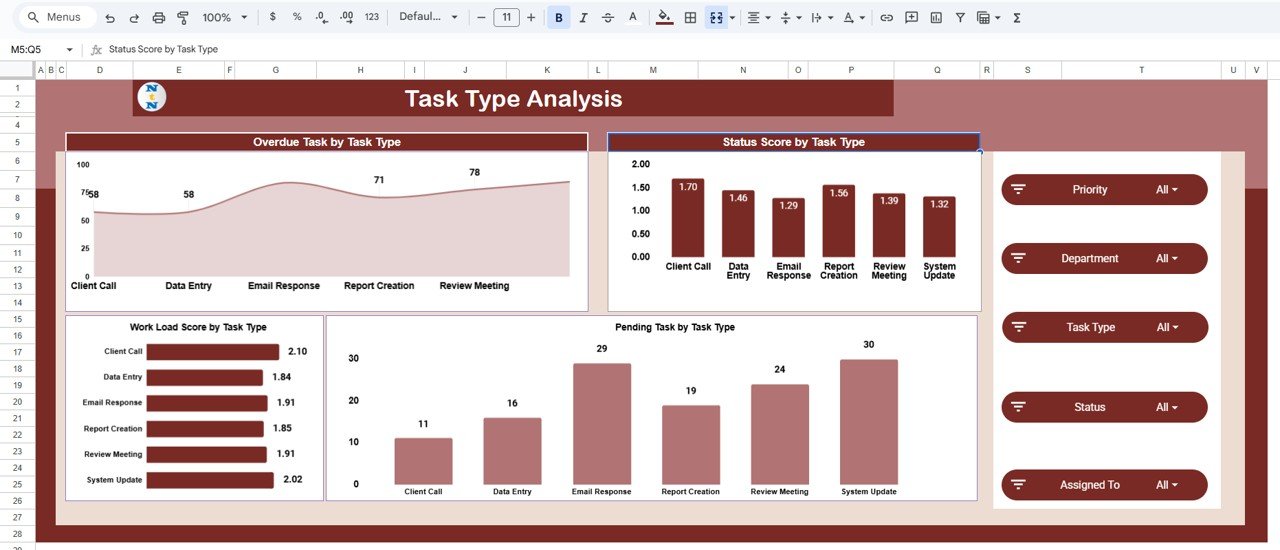
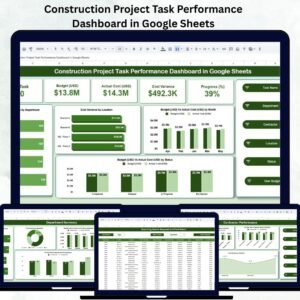
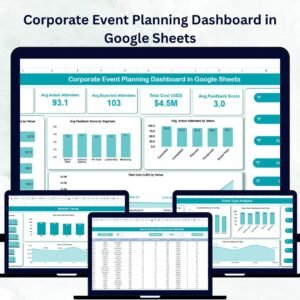
📊 Task Type Analysis
Analyze efficiency across different types of tasks.
-
Charts such as Overdue Tasks by Task Type and Pending Tasks by Task Type provide clarity on where delays occur.
-
Evaluate Workload Scores to identify which task categories need extra attention or resources.
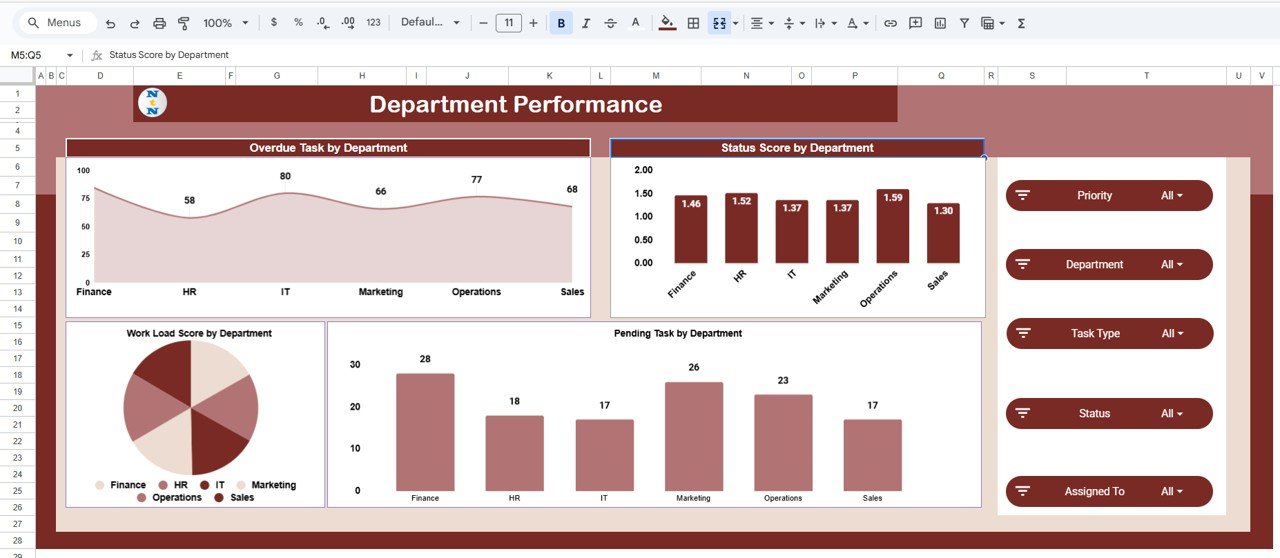
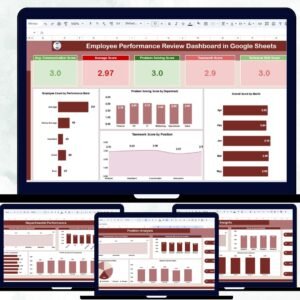
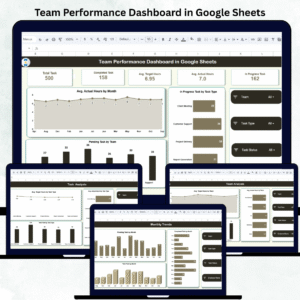
🏢 Department Performance
Monitor how each department contributes to overall workflow.
-
Track Overdue Tasks, Pending Tasks, and Status Scores by department.
-
Identify departments with heavy workloads or bottlenecks.
This ensures balanced task allocation and departmental accountability.
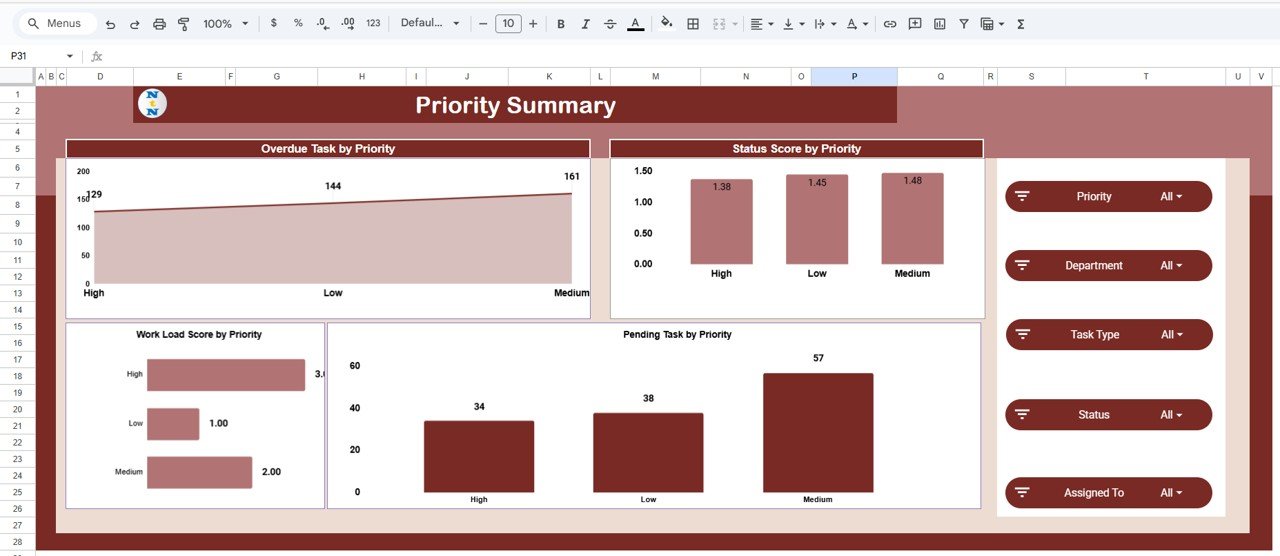
🚦 Priority Summary
Understand efficiency based on task urgency.
-
Overdue Tasks by Priority and Status Scores by Priority reveal how high-importance work is managed.
-
Workload by Priority helps plan and delegate tasks strategically.
Perfect for teams that juggle multiple projects with varying urgency levels.
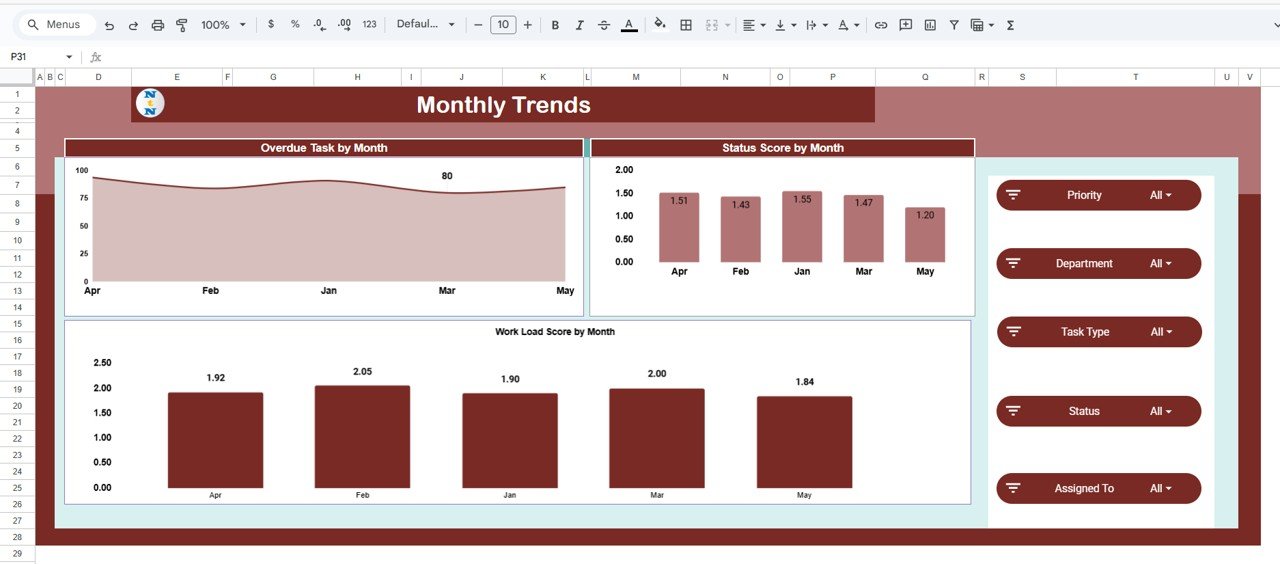
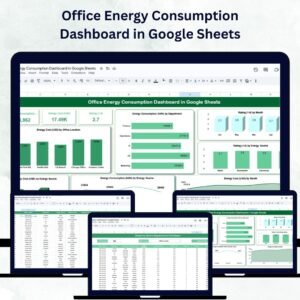
📆 Monthly Trends
Visualize workflow progress over time.
-
Overdue Tasks by Month, Status Score by Month, and Workload Score by Month charts show how performance evolves.
-
Spot seasonal workload spikes or recurring delays.
Ideal for continuous performance improvement and forecasting.
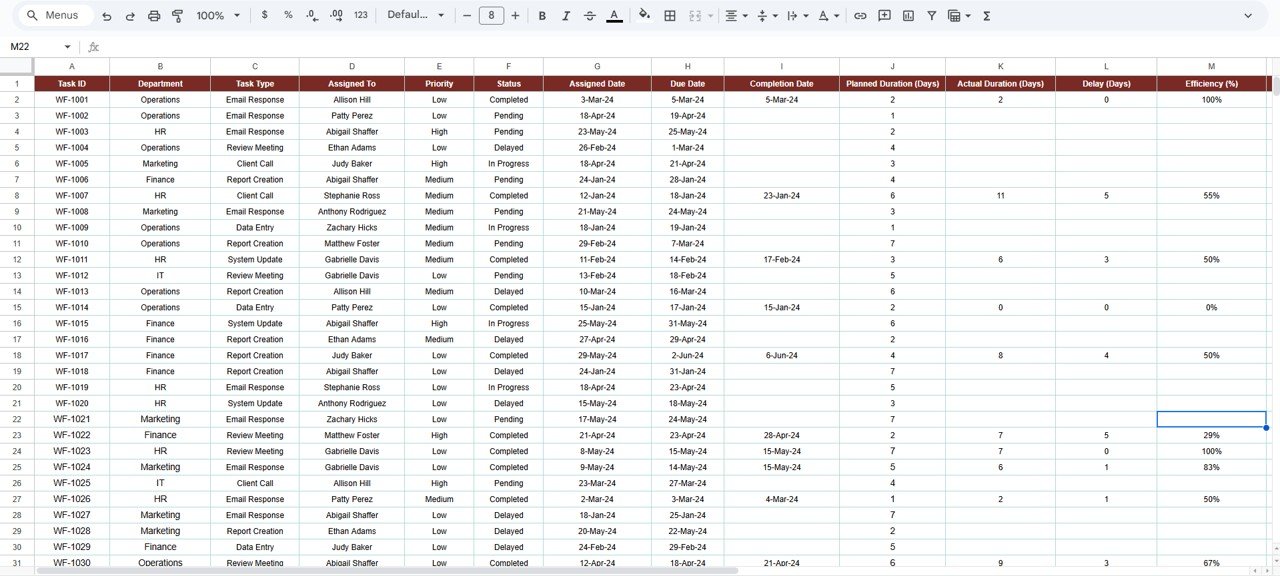
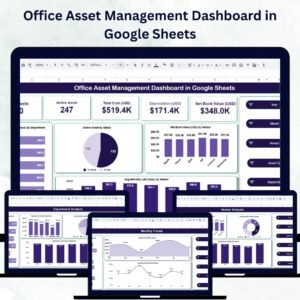
📑 Data Sheet Tab
The backbone of the dashboard — where all task data is entered.
-
Fields include Task ID, Task Name, Department, Assigned To, Priority, Status, Start & Due Dates, Completion %, and Efficiency metrics.
-
Automatically updates visuals and summaries across all sheets in real time.
📦 What’s Inside the Template
✅ Overview Dashboard – Interactive KPI cards and charts for quick insight
✅ Task Type Analysis – Identify performance patterns by task category
✅ Department Performance Sheet – Compare team and department productivity
✅ Priority Summary View – Understand task completion based on urgency
✅ Monthly Trend Page – Analyze long-term workflow efficiency
✅ Data Sheet – Centralized task database with real-time syncing
✅ Prebuilt Formulas & Charts – No manual setup or coding required
👩💼 Who Can Use This Dashboard
🏢 Operations Managers – Track daily office performance and efficiency metrics.
👨💻 Project Teams – Manage cross-functional tasks and monitor deadlines.
👩⚕️ HR Departments – Track employee task completion and departmental load.
💼 Executives & Administrators – Visualize company-wide efficiency and delays.
🌐 Remote Teams – Collaborate in real time through Google Sheets’ cloud functionality.
🧠 How to Use the Office Workflow Efficiency Dashboard
-
Input Data: Record all tasks in the Data Sheet with key details.
-
Update Status: Modify completion percentages and task statuses as work progresses.
-
Analyze Efficiency: Use the Overview and Department Performance tabs for real-time monitoring.
-
Track Trends: Identify recurring inefficiencies through the Monthly Trends page.
-
Share Insights: Collaborate with your team — everyone can view updates simultaneously.
The entire dashboard updates automatically, ensuring your analysis is always current and accurate.
🌟 Why Choose This Google Sheets Dashboard
-
⚙️ Fully Automated: All calculations, charts, and performance indicators auto-refresh.
-
📊 Data Visualization Made Easy: Turn complex workflow data into actionable insights.
-
👥 Collaborative & Cloud-Based: Multiple users can access and edit simultaneously.
-
🎯 Customizable: Add departments, KPIs, or charts to fit your organization’s structure.
-
🕒 Time-Saving: Eliminate manual reporting and focus on decision-making.
-
🔍 Comprehensive Insight: Covers everything from individual productivity to organization-wide trends.
The Office Workflow Efficiency Dashboard in Google Sheets is not just a tracker — it’s a productivity intelligence tool that helps you stay organized, improve task visibility, and drive continuous improvement across departments.


Reviews
There are no reviews yet.