


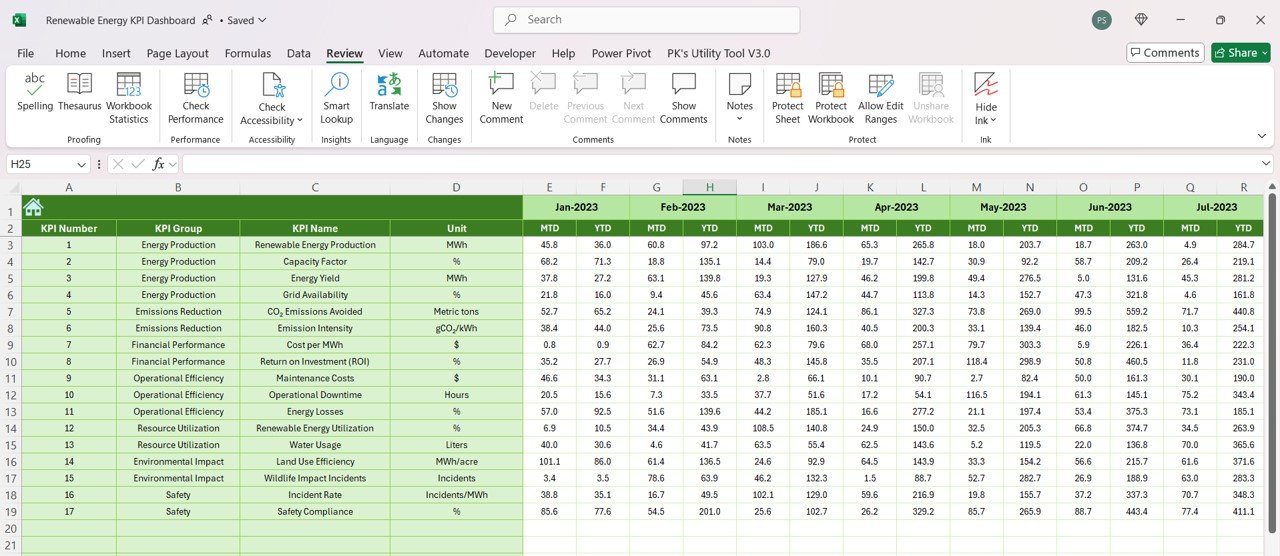


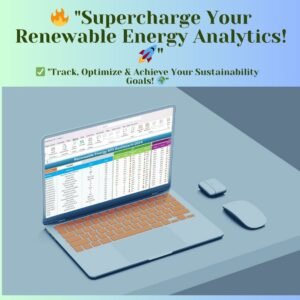
The Renewable Energy KPI Dashboard in Excel is a powerful and easy-to-use tool designed to help renewable energy professionals, sustainability managers, and analysts track and measure key performance indicators (KPIs) for sustainable energy projects. This Renewable Energy KPI Dashboard provides a structured way to monitor energy production, efficiency, environmental impact, and financial performance. With interactive features and pre-built calculations, users can analyze Month-to-Date (MTD) and Year-to-Date (YTD) performance while comparing historical data for deeper insights.
This Excel-based solution is perfect for organizations focused on solar, wind, hydro, and other renewable energy sources, helping teams drive data-driven decision-making and optimize energy generation efficiency.
Key Features
1. Home Sheet: Centralized Navigation Hub
The Home Sheet acts as the primary navigation hub, providing a structured index to seamlessly access different dashboard sections. It includes interactive buttons to navigate:
- Dashboard – A visual representation of renewable energy KPIs.
- KPI Trend – In-depth analysis of KPI trends over time.
- Actual Input Sheet – Data entry section for actual performance figures.
- Target Sheet – Pre-set performance goals and expected outcomes.
- Previous Year Data Sheet – Reference sheet for historical performance comparison.
- KPI Definition Sheet – Detailed descriptions and formulas for each KPI.
2. Dashboard Sheet: Real-Time KPI Monitoring
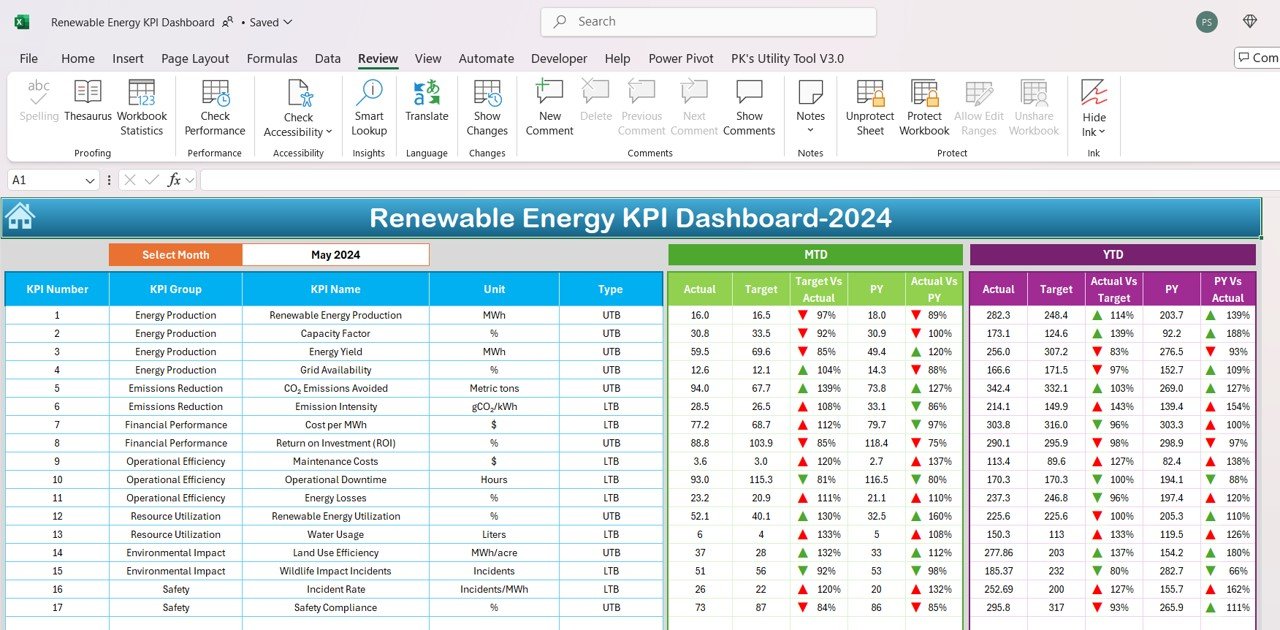
The Renewable Energy KPI Dashboard Sheet provides a high-level overview of renewable energy KPIs, offering:
- Dynamic Month Selection – Choose any month to update data automatically.
- MTD & YTD Performance – Track current and cumulative performance indicators.
- Conditional Formatting – Automatic color-coded indicators (arrows and highlights) for performance tracking.
- Comparison Metrics – Evaluate actual performance against targets and previous year figures.
3. KPI Trend Sheet: Data-Driven Insights
The KPI Trend Sheet enables in-depth performance analysis by displaying trends in renewable energy KPIs over time. This sheet features:
- KPI Drop-Down Selection – Choose specific KPIs for a detailed trend analysis.
- Graphical Representation – Charts and trend lines for quick visualization.
- Performance Evaluation – Compare current data with targets and historical performance.
- Detailed KPI Attributes – KPI Type (Lower is Better or Upper is Better), unit of measurement, and formula.
4. Actual Numbers Input Sheet: Data Entry Made Simple
This sheet allows users to input actual performance numbers for each month, making it easy to track MTD and YTD progress. Key benefits include:
- Simple and User-Friendly Input Format – Pre-formatted table for seamless data entry.
- Automatic Calculations – MTD and YTD values update automatically.
- Flexible Adjustments – Users can modify starting months and year settings.
5. Target Sheet: Set Your Performance Goals
The Target Sheet enables organizations to set and track performance goals based on:
- Monthly and Annual KPIs – Input target values for energy production, efficiency, and environmental impact.
- Goal Alignment – Establish performance benchmarks to measure success.
- Automatic Comparisons – Targets vs. Actual analysis displayed across all sheets.
6. Previous Year Data Sheet: Compare Historical Performance
This sheet stores previous year performance data, allowing users to:
- Compare Year-over-Year Growth – Assess progress and identify improvement areas.
- Highlight Seasonal Trends – Detect variations in renewable energy production across different months.
- Data Integrity – Maintain historical records for long-term analysis.
7. KPI Definition Sheet: Understanding Your Metrics
For transparency and standardization, the KPI Definition Sheet provides a detailed breakdown of each key metric, including:
- KPI Name & Category – Defines each performance indicator.
- Unit of Measurement – Specifies the standard units (e.g., MWh, CO₂ metric tons, % efficiency).
- Formula Explanation – Shows how each KPI is calculated.
- KPI Type – Determines whether a lower or higher value is ideal for performance.
Benefits of Using This Dashboard
- Streamlined KPI Management – Monitor all essential renewable energy KPIs in one place.
- Actionable Insights – Visualize trends and assess performance against set targets.
- Automated Calculations – Save time with pre-built formulas and real-time updates.
- Easy Customization – Adapt the dashboard to your organization’s specific needs.
- Enhanced Decision-Making – Leverage data-driven insights to optimize energy efficiency and reduce costs.
Who Can Benefit from This Dashboard?
This Renewable Energy KPI Dashboard in Excel is ideal for:
- Renewable Energy Companies – Solar, wind, hydro, and biomass energy providers.
- Sustainability Managers – Professionals managing clean energy initiatives.
- Energy Analysts – Analysts tracking performance trends and efficiency improvements.
- Government & Environmental Agencies – Organizations monitoring carbon reduction and sustainability goals.
Why Choose Our Renewable Energy KPI Dashboard?
✔ User-Friendly Interface – No coding required, simple Excel-based solution. ✔ Instant Performance Tracking – MTD & YTD comparisons for key metrics. ✔ Interactive and Customizable – Modify KPI categories to match business needs. ✔ Industry-Specific Metrics – Focused on renewable energy efficiency, emissions reduction, and cost management. ✔ Time-Saving Automation – Pre-built formulas eliminate manual calculations.
Click hare to read the Detailed blog post
Visit our YouTube channel to learn step-by-step video tutorials



























Reviews
There are no reviews yet.