






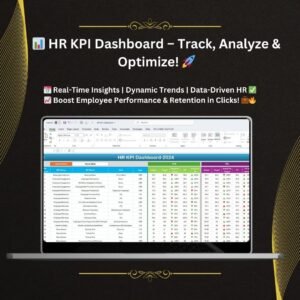
The HR KPI Dashboard is a ready-made Excel template that helps HR professionals track, measure and analyze key HR metrics such as Employee Retention Rate, Absenteeism and Time to Hire in one place. It is built for HR managers, business owners, recruitment teams and HR data analysts. Enter your actual and target numbers, and the dashboard updates instantly with month-to-date and year-to-date comparisons and trend charts, so you can make data-driven HR decisions with ease.
Key Features of the HR KPI Dashboard in Excel
Whether you are managing employee retention, time to hire, absenteeism or engagement scores, this HR KPI Dashboard in Excel combines interactive visuals, automated calculations and customizable KPI tracking to give you clear, up-to-date insights.
Comprehensive Dashboard View
- Monitor all essential HR KPIs, including Employee Retention Rate, Absenteeism, Time to Hire and more.
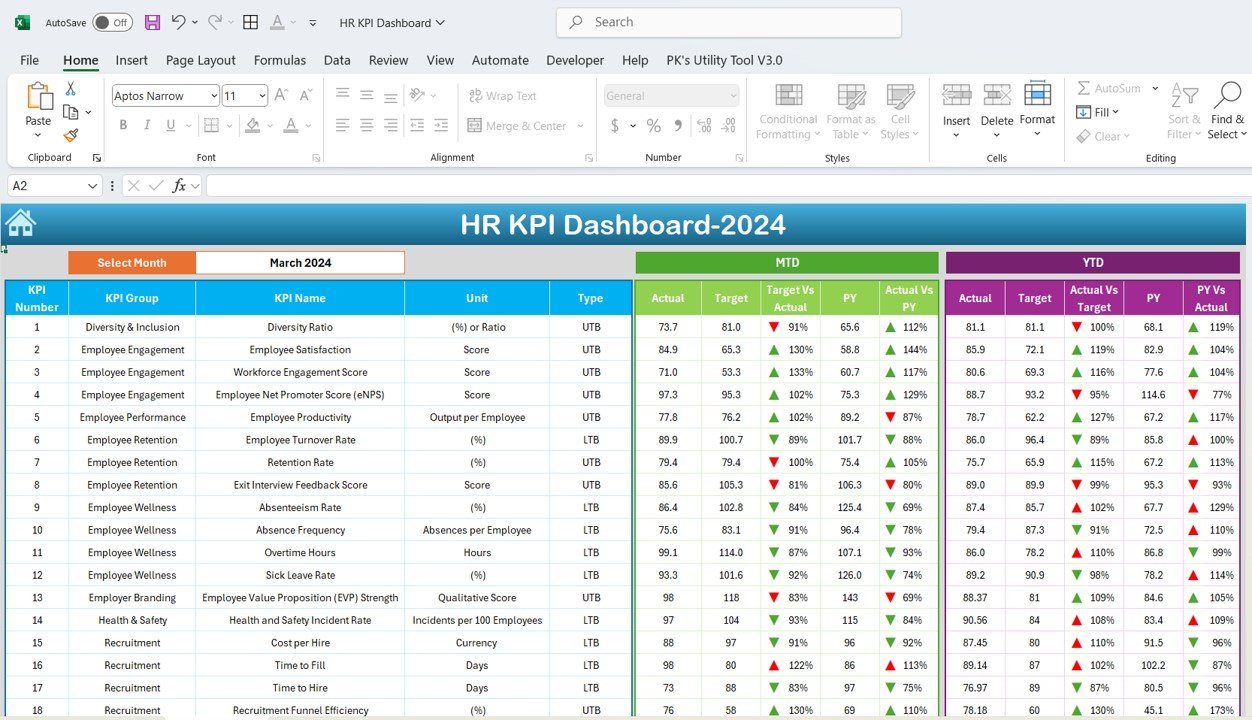
- Get a quick summary of performance with MTD (Month-to-Date) and YTD (Year-to-Date) comparisons.
Interactive Month Selector
- Switch between months using a simple dropdown selector to track how your HR metrics change over time.
Trend Analysis
- Visualize KPI trends with dynamic charts and graphs to identify patterns, performance gaps and improvement opportunities.
Real-Time Data Updates
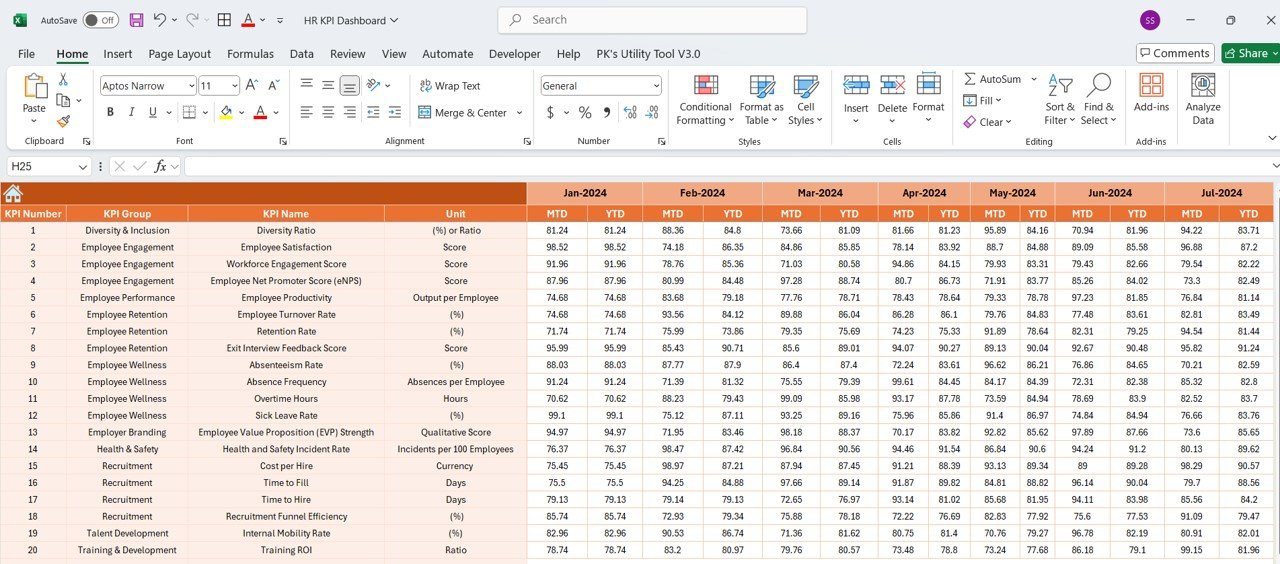
- Enter actual data and target numbers to instantly update the dashboard, keeping your HR performance tracking current.
KPI Definitions and Formulas
- Each KPI comes with built-in definitions, formulas and explanations, so everyone understands exactly what each metric represents.
- Pre-built formulas remove manual calculations and keep KPI values updated automatically.
Fully Customizable
- Add, remove or modify KPIs to fit your organization’s unique HR objectives.
- Adjust targets and benchmarks according to your business needs.
No Complex Setup Required
- 100% built in Excel – no VBA or external software needed. Just plug in your HR data and start tracking.
What’s Inside the Template
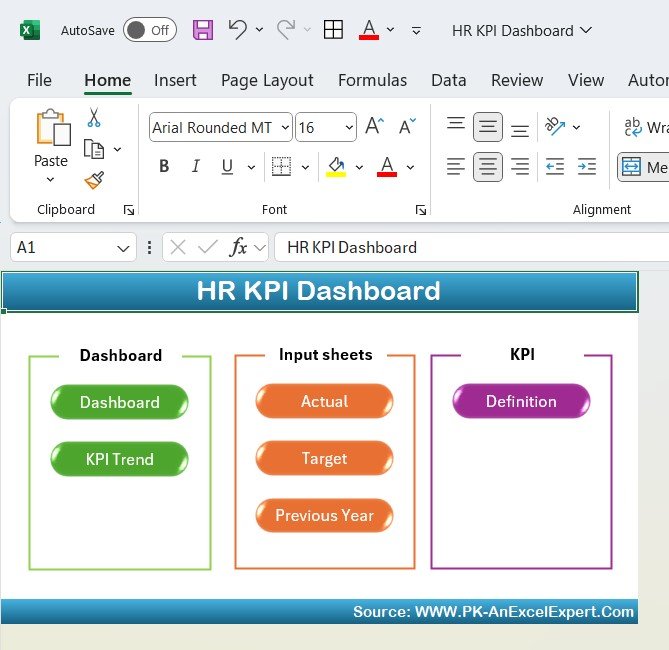
The workbook has a well-structured navigation with dedicated sheets for each part of your HR reporting:
| Sheet | What it does |
|---|---|
| Dashboard Overview | Summary of all HR KPIs with MTD and YTD comparisons and a month dropdown selector. |
| KPI Trend Analysis | Dynamic charts and graphs showing how each KPI moves over time. |
| Actual vs Target Comparisons | Compares actual results against the targets you set for each KPI. |
| Previous Year Comparisons | Benchmarks current performance against the previous year. |
| KPI Definitions & Explanations | Definitions, formulas and explanations for every KPI in the dashboard. |
Why Use This HR KPI Dashboard?
- Save time: Automated calculations eliminate manual data analysis.
- Improve HR decision-making: Data-driven insights help HR teams optimize performance.
- Increase efficiency: Track KPIs at a glance with real-time updates.
- Better workforce planning: Identify HR trends to enhance recruitment, retention and employee engagement strategies.
- Data-driven HR strategy: Use your HR metrics to support workforce productivity and engagement.
Who Can Use This HR KPI Dashboard?
- HR professionals and managers – Track employee performance, engagement and workforce trends.
- Business owners – Monitor key HR indicators to strengthen talent management strategies.
- Recruitment teams – Optimize hiring processes and reduce time to hire.
- HR data analysts – Gain insights into employee behavior and workplace efficiency.
How to Use the HR KPI Dashboard
- Download the template instantly after purchase and open it in Excel.
- Review the KPI list on the definitions sheet and add, remove or modify KPIs to match your goals.
- Enter your actual data and target numbers for each month, plus previous year figures for comparison.
- Select a month from the dropdown on the dashboard to see MTD and YTD results.
- Analyze trends on the trend and comparison sheets and act on the gaps you find.
Click here to read the detailed blog post.
Visit our YouTube channel to learn from step-by-step video tutorials: Youtube.com/@PKAnExcelExpert
Frequently Asked Questions
Which HR metrics does this dashboard track?
It tracks essential HR KPIs including Employee Retention Rate, Absenteeism and Time to Hire, among others. Because the template is fully customizable, you can add, remove or modify KPIs to suit your organization.
Do I need VBA or macros to use it?
No. The HR KPI Dashboard in Excel is 100% built in Excel with no VBA or external software required. Pre-built formulas handle the calculations automatically.
How does the dashboard update?
Simply enter your actual data and target numbers. The dashboard, charts and comparisons update instantly based on the values you enter.
Can I compare performance over different periods?
Yes. The dashboard shows MTD and YTD comparisons, an interactive month selector, Actual vs Target comparisons and Previous Year comparisons.
Will my team understand what each KPI means?
Yes. Every KPI includes built-in definitions, formulas and explanations on a dedicated sheet, so the meaning of each metric is clear.
Can I change the targets and benchmarks?
Yes. You can adjust targets and benchmarks according to your business needs at any time.
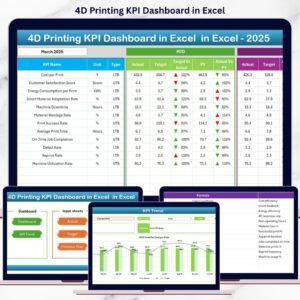
Also check our Printing & Publishing KPI Dashboard in Excel.
Last updated: October 2026
Compatibility and Requirements
- Works in Microsoft Excel desktop (Excel 2016 or later, or Microsoft 365).
- The month selector is a dropdown list. Microsoft explains dropdowns in Create a drop-down list.
Related HR KPI Templates
- HR KPI Dashboard in Google Sheets: the same topic in Google Sheets
- HR KPI Dashboard in Power BI: the same topic for Power BI users
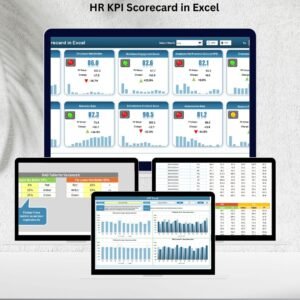
- HR KPI Scorecard in Excel: a scorecard view of HR KPIs
- HR Dashboard in Excel: a full HR dashboard
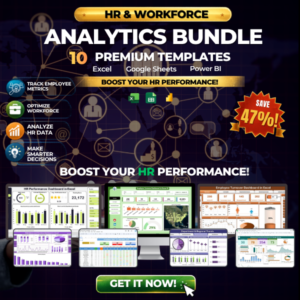
- HR & Workforce Analytics Bundle: 10 premium HR templates in one bundle
Browse all Excel KPI dashboards or the Excel HR and payroll templates.




















Reviews
There are no reviews yet.