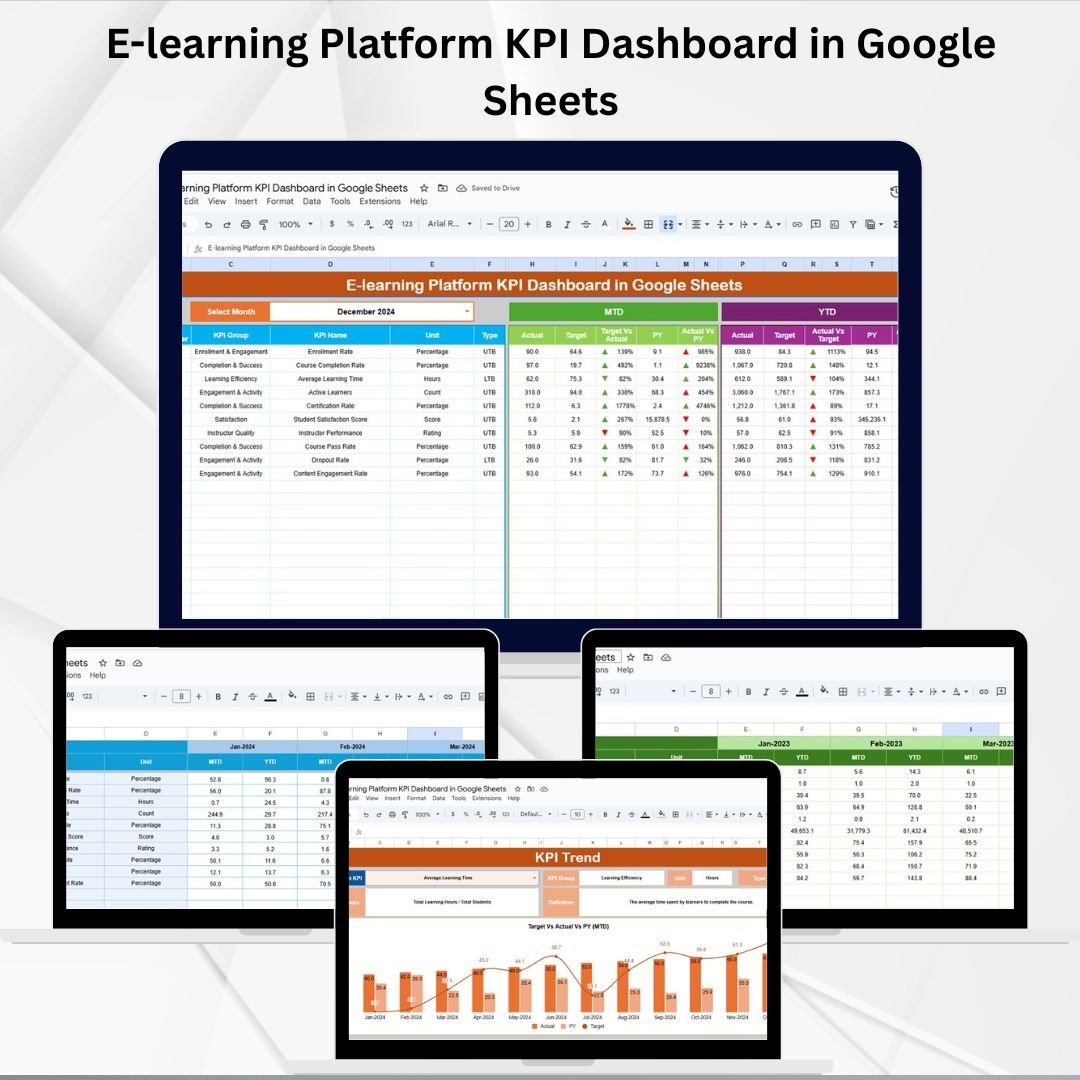
Online learning platforms thrive when engagement and performance are tracked systematically. 🎓 Without the right insights, it’s easy to lose sight of learner progress, course effectiveness, or ROI. The E-learning Platform KPI Dashboard in Google Sheets offers a ready-to-use, interactive, and cloud-based solution for consolidating all essential learning KPIs into one place.E-learning Platform KPI Dashboard in Google Sheets
This dashboard empowers course managers, administrators, and L&D strategists to measure performance, monitor engagement, and make data-driven improvements to online learning delivery.E-learning Platform KPI Dashboard in Google Sheets
🔑 Key Features of E-learning Platform KPI Dashboard in Google Sheets
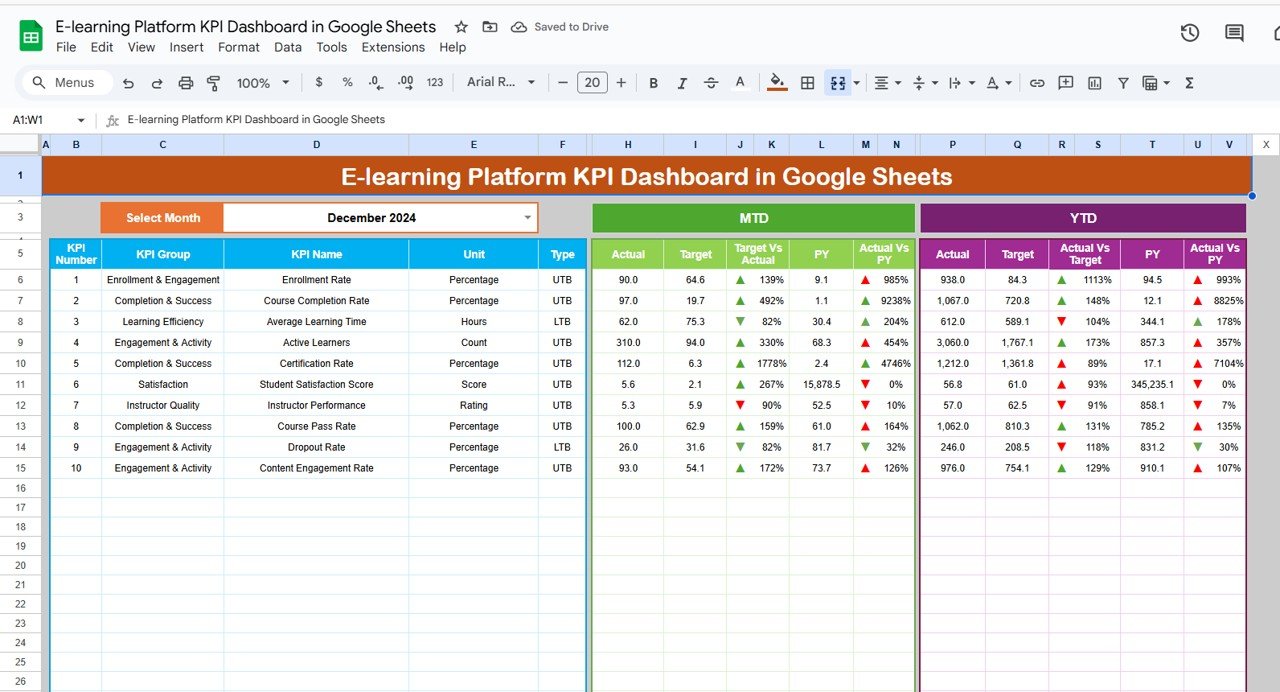
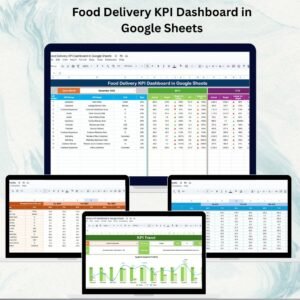
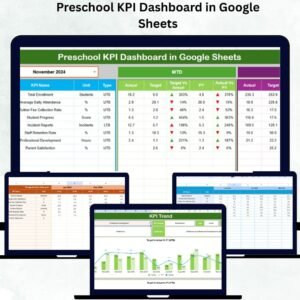
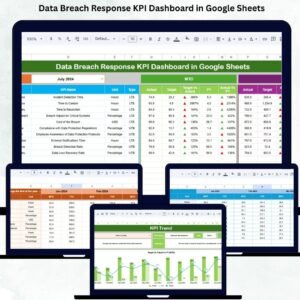
📊 Dashboard Tab (Performance Snapshot)
-
Drop-down to select month (auto-updates all KPIs).
-
View MTD (Month-to-Date) and YTD (Year-to-Date) metrics.
-
Compare Actual vs Target and Previous Year vs Actual.
-
Conditional formatting with arrows for quick performance review.
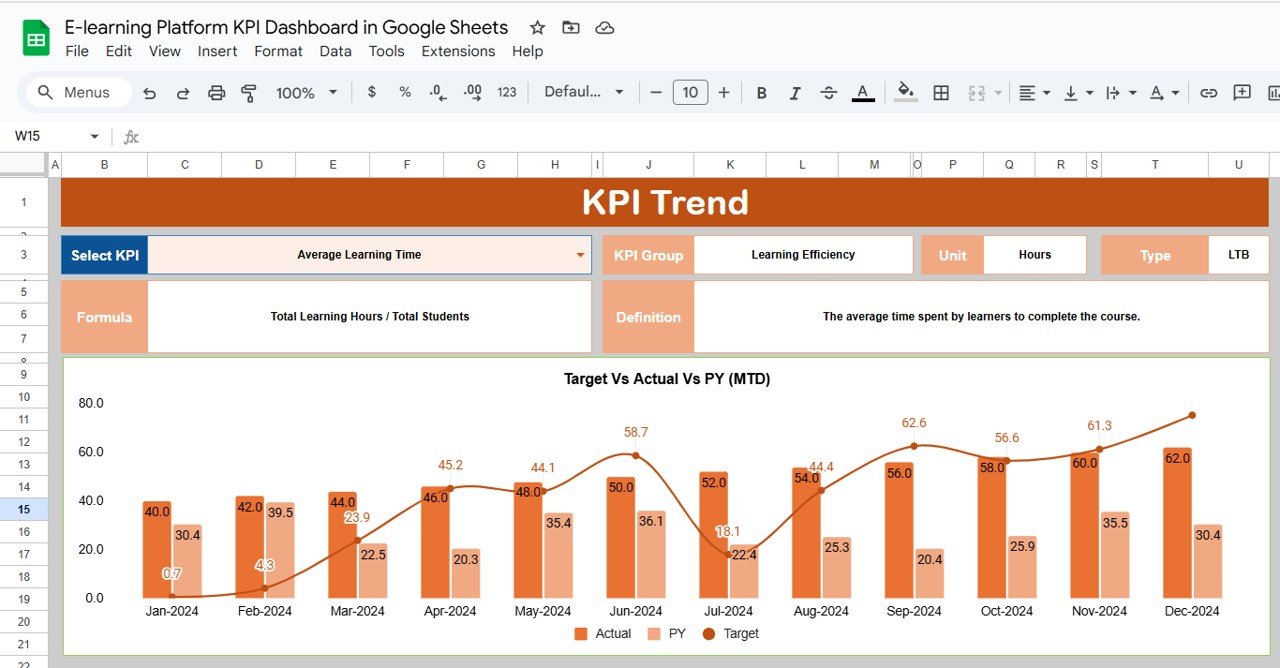
📈 KPI Trend Tab (Detailed KPI Analysis)
-
Select any KPI from drop-down to see detailed breakdown.
-
Includes KPI Group, Unit, Type (UTB/LTB), Formula, and Definition.
-
Spot long-term trends and track continuous improvement.
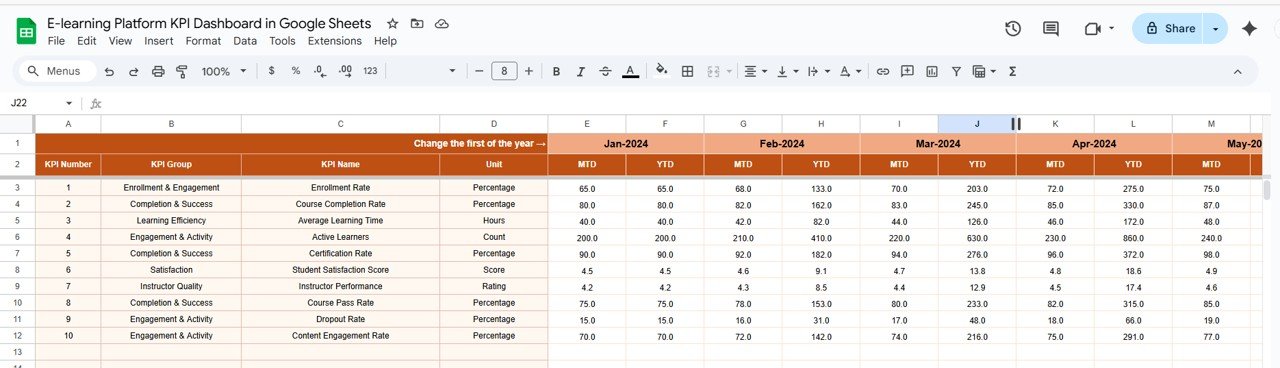
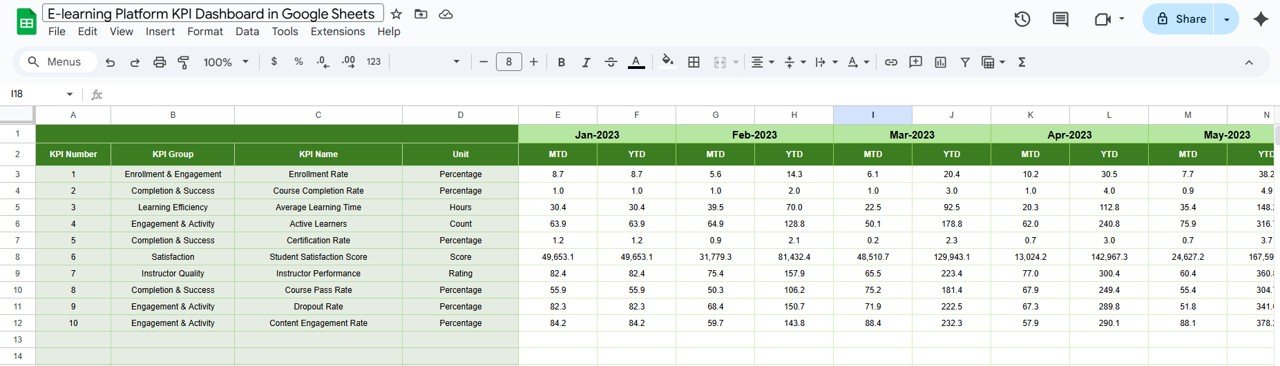
🧾 Actual Numbers Tab (Data Entry)
-
Enter actual KPI values (monthly and cumulative YTD).
-
Month selector ensures period-aligned reporting.
-
Data auto-feeds into dashboard and trend analysis.
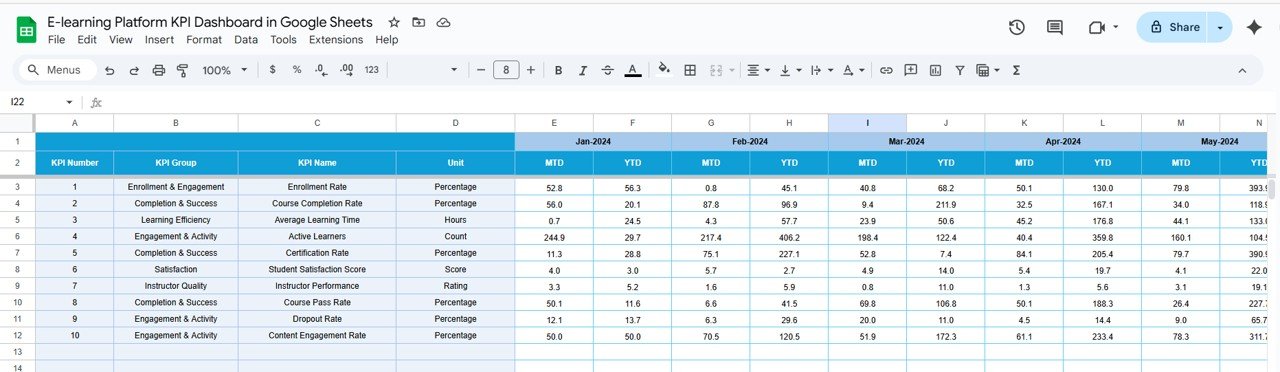
🎯 Target Tab (Goal Setting)
-
Input MTD and YTD targets for each KPI.
-
Benchmark actual performance against goals.
-
Adjust targets easily when strategy changes.
📉 Previous Year Numbers Tab (Benchmarking)
-
Record prior year’s performance for all KPIs.
-
Enables YOY (year-over-year) comparisons.
-
Useful for identifying improvements or declines.
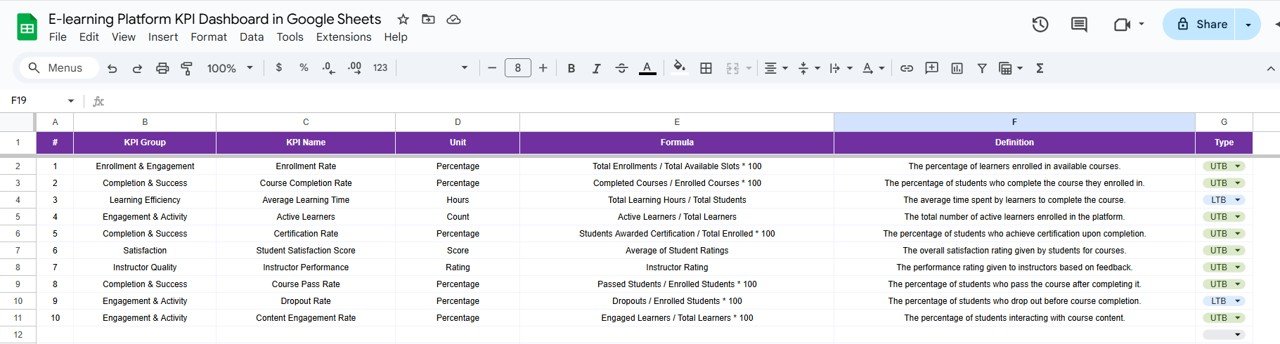
📚 KPI Definition Tab (Reference Guide)
-
Stores KPI Name, Group, Unit, Formula, Definition, and Type.
-
Provides clarity and ensures consistency across reports.
📊 Example KPIs You Can Track
-
🎯 Course Completion Rate (%) – Percentage of learners finishing courses (UTB).
-
👩🏫 Active Users – Total number of learners engaged (UTB).
-
👍 Engagement Rate – Interactions per learner/session (UTB).
-
📚 Average Training Hours per Learner – Time spent learning (UTB).
-
📑 Assessment Pass Rate (%) – Ratio of learners passing tests (UTB).
-
⏱ Drop-off Rate – Percentage of learners who don’t finish courses (LTB).
📦 What’s Inside the Template?
✅ 6 Structured Tabs (Dashboard, KPI Trend, Actual, Target, Previous Year, KPI Definition)
✅ Pre-built conditional formatting & formulas
✅ Sample data included to get started quickly
✅ Real-time updates for MTD, YTD, and YOY tracking
✅ Customizable design to add new KPIs or adjust layouts
👥 Who Can Benefit from This Dashboard?
🎓 E-learning Providers – Measure learner engagement and platform usage.
🏫 Educational Institutions – Track course completion & effectiveness.
💼 Corporate L&D Teams – Monitor compliance training & employee upskilling.
📈 Content Strategists – Identify trends in course performance.
👨🏫 Instructors & Trainers – Improve course delivery using feedback data.
🧾 How to Use the Dashboard
-
📥 Download & Copy to your Google Drive.
-
📝 Update Actual Numbers monthly in the Actual Tab.
-
🎯 Input Targets in the Target Tab for each KPI.
-
📊 View Dashboard Tab for instant performance review.
-
📈 Analyze Trends in the KPI Trend Tab.
-
🔁 Benchmark Progress using Previous Year numbers.
-
🎨 Customize KPIs or charts to fit your strategy.
No coding or technical expertise needed — just plug in your data and start monitoring. 🚀
🔗 Click here to read the Detailed blog post E-learning Platform KPI Dashboard in Google Sheets
Watch the step-by-step video Demo:


Reviews
There are no reviews yet.