Looking to boost employee morale and retention? The Employee Satisfaction Dashboard in Excel is a ready-to-use, interactive template designed to help you analyze feedback, measure engagement, and drive workplace improvements—all within Microsoft Excel.
With powerful visualizations, smart filters, and intuitive navigation, this tool transforms raw survey data into actionable insights that HR teams and executives can trust. No need for costly BI tools—Excel does it all.
✨ Key Features of the Employee Satisfaction Dashboard
🧭 Top Navigation Panel
Jump between 5 powerful analytical pages and 2 support tabs with one click—no need to scroll through endless sheets.
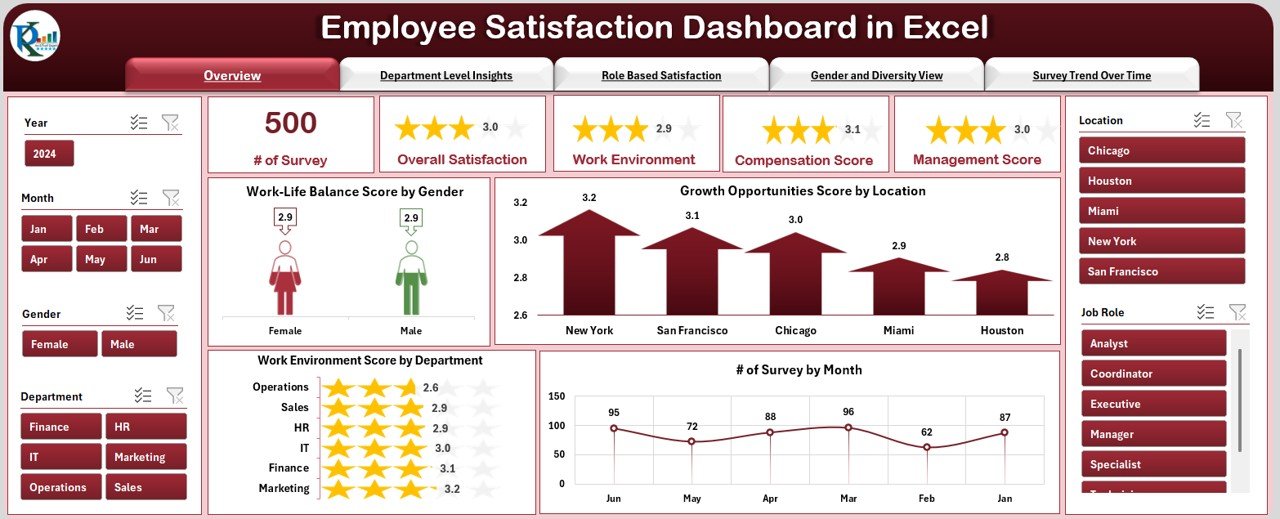
📊 Overview Page
Employee Satisfaction Dashboard
Slicers: Filter by Department, Role, Gender, Location, Month, Year
Cards: Total Surveys, Avg. Satisfaction Score, Highest/Lowest Department Score, MTD Trend
Charts:
Work-Life Balance by Gender
Growth Opportunities by Location
Work Environment by Department
Surveys by Month
🏢 Department-Level Insights
Compare satisfaction, participation, and growth scores across departments.
Spot top- and under-performing teams with data-backed clarity.
👔 Role-Based Satisfaction
Understand how satisfaction varies across roles—from entry-level to leadership.
Use insights to develop career paths, training programs, or engagement initiatives.
👩💼 Gender and Diversity Analysis
Track satisfaction and opportunities by gender.
Address equity gaps and design more inclusive HR strategies.
📈 Survey Trend Over Time
Identify seasonal dips in satisfaction (e.g., quarterly workload spikes).
Track how HR initiatives and policies impact long-term trends.
🧾 What’s Inside the Template
✅ Data Sheet: Clean format for all employee feedback with drop-down validation
✅ Support Sheet: Lookup tables, month mapping, KPI logic
✅ Pivot Charts: Auto-updating visuals driven by filters and slicers
✅ KPI Cards: Instantly updated metrics you can share with leadership
💡 Why Use This Dashboard?
Real-Time Insights: Instantly updated when new data is entered
Cost-Efficient: No extra software needed—just Excel
Customizable: Adjust slicers, charts, and KPIs to your company’s needs
Data-Driven Decisions: Improve culture, leadership, and engagement using actual feedback
Easy to Use: Built with Excel best practices—zero coding required
🛠 How to Use
📥 Download and open the template
🧾 Input survey data in the Data Sheet
🧠 Confirm departments, roles, and lookup values in Support Sheet
🔎 Explore each page via the Page Navigator
📊 Use slicers to filter by department, role, gender, time
🧮 Share insights or export reports in PDF for leadership













Reviews
There are no reviews yet.