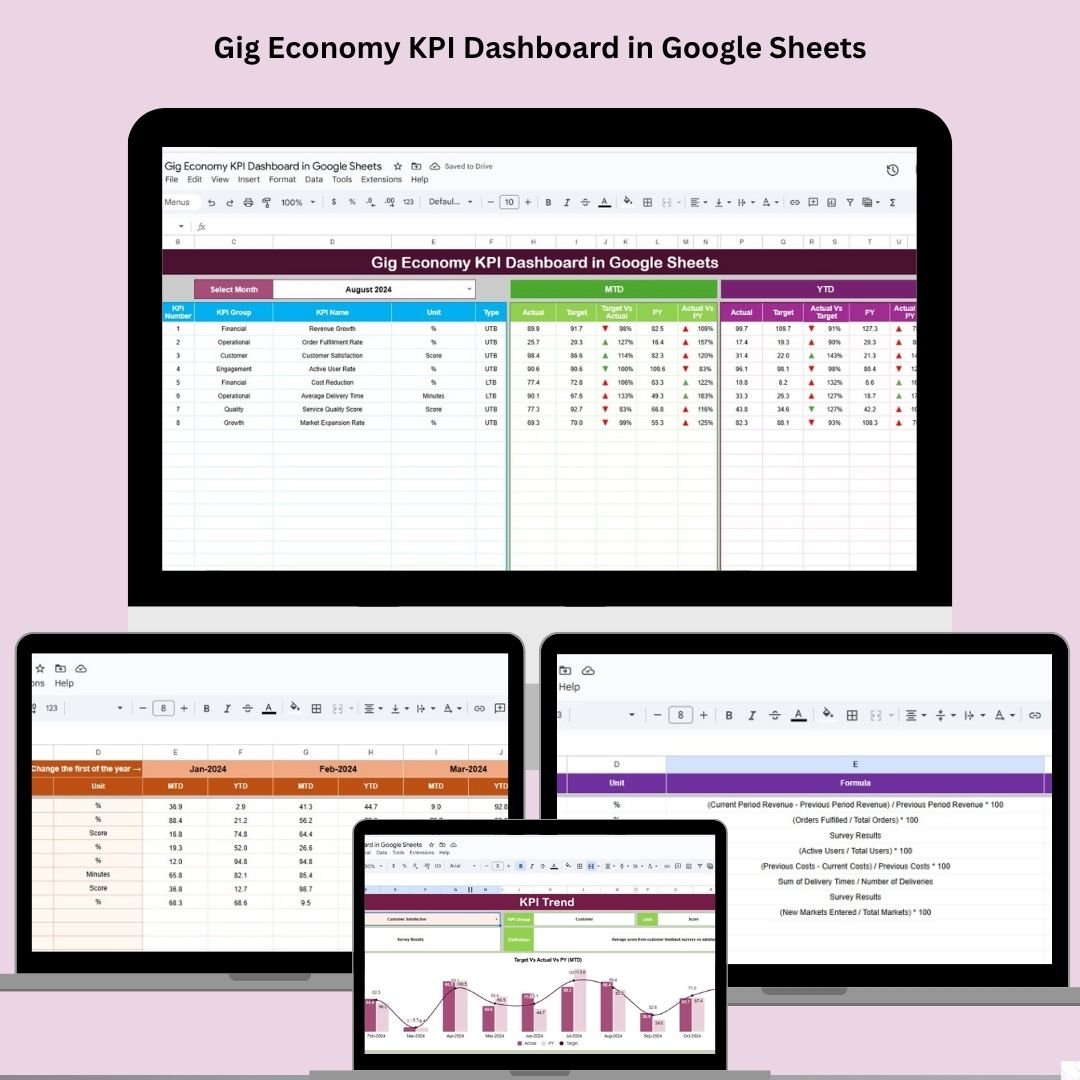
In today’s fast-paced gig economy, tracking real-time performance is non-negotiable. Whether you’re managing freelancers, delivery partners, taskers, or remote contractors — staying on top of critical metrics like earnings, task completion rates, and worker engagement can make or break your business. That’s why the Gig Economy KPI Dashboard in Google Sheets is the ultimate tool for modern gig platforms. 📈🧑💼
This ready-to-use dashboard brings structure and visibility to your gig economy operations, helping you manage workforce data with ease and confidence — all inside Google Sheets.
✨ Key Features of Gig Economy KPI Dashboard
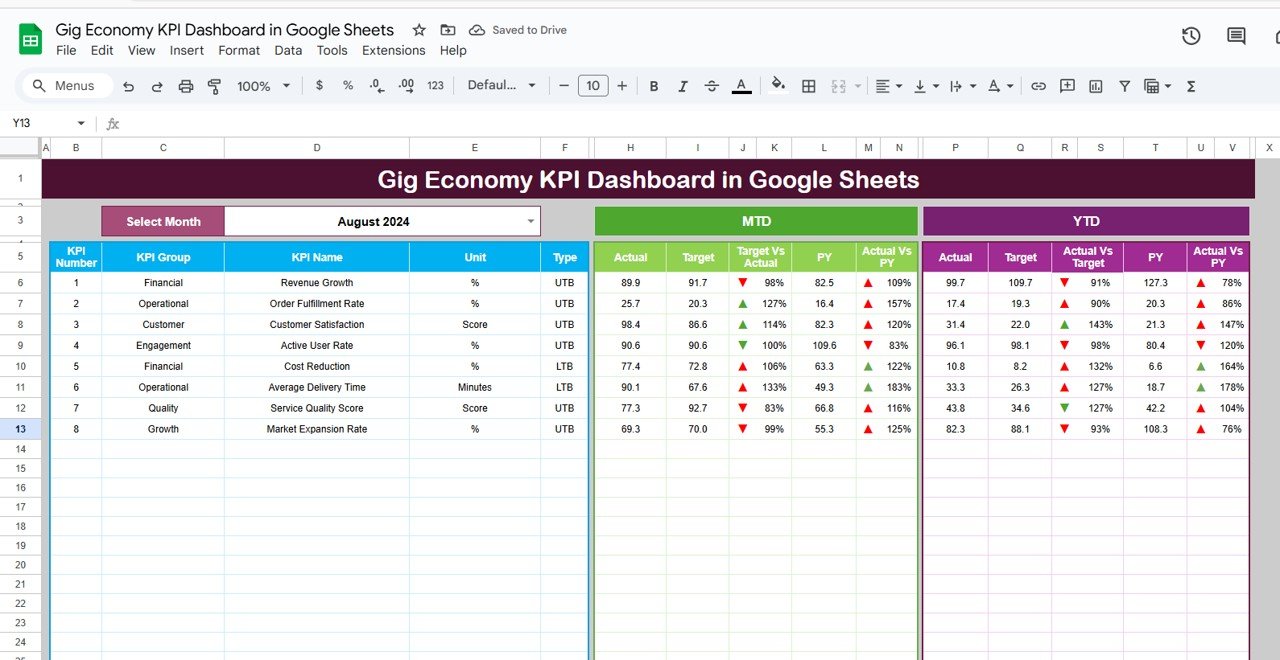
📊 Comprehensive Dashboard Sheet
Monitor Month-to-Date (MTD) and Year-to-Date (YTD) actuals, targets, and previous year comparisons. Visual indicators like arrows make it easy to see where you’re winning and where you need to focus.
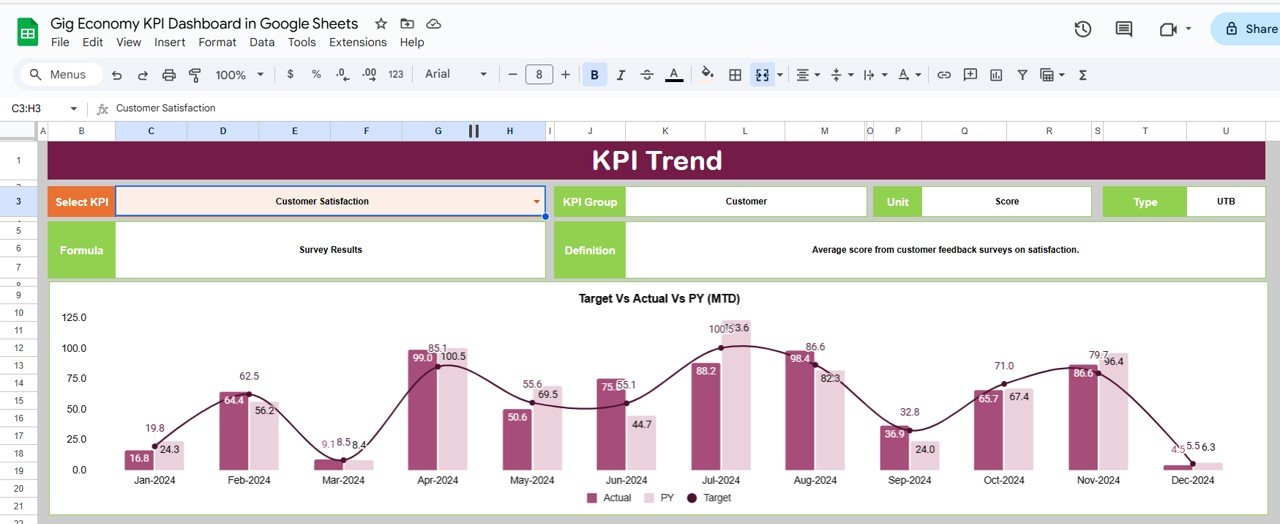
📈 Dynamic KPI Trend Sheet
Track KPI performance over time with trend charts and drop-down selection for each metric. Great for spotting seasonal trends and long-term shifts.
📋 Real-Time Data Updates
Input actuals or targets once, and the dashboard updates automatically — no need for formulas or coding.
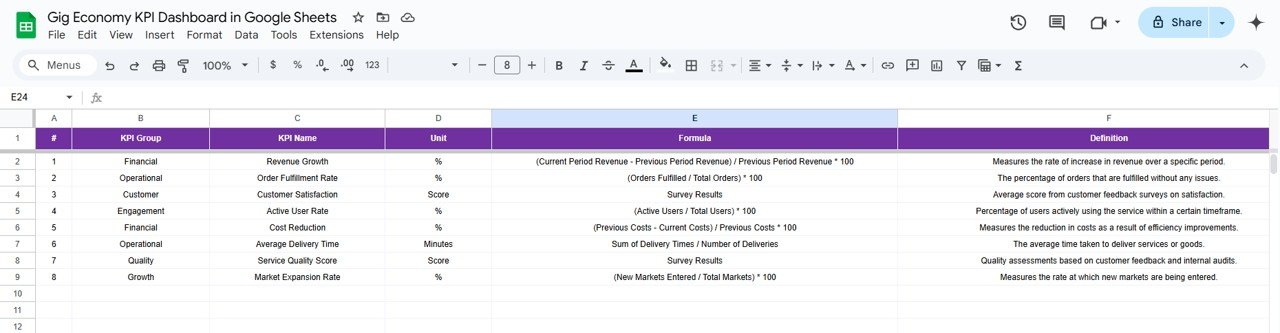
🧮 KPI Definitions for Clarity
Understand exactly what you’re tracking with a dedicated sheet that explains KPI formulas, units, and whether “Lower is Better” or “Upper is Better.”
📂 Six Linked Worksheets
From actual numbers and targets to trends and definitions — everything is structured for seamless tracking.
🧩 Fully Customizable in Google Sheets
Modify or expand KPIs, customize dropdowns, and adapt the dashboard to any type of gig operation.
📂 What’s Inside the Gig Economy KPI Dashboard
The tool includes 6 powerful worksheets tailored to manage gig workforce performance:
1️⃣ Dashboard Sheet Tab
Get an instant snapshot of campaign health with MTD and YTD comparisons, targets, and previous year figures—all enhanced with conditional formatting and intuitive visuals.
2️⃣ KPI Trend Sheet Tab
Use the dropdown in cell C3 to view trends for any KPI, and analyze its group, unit, formula, and definition—all charted for clarity.
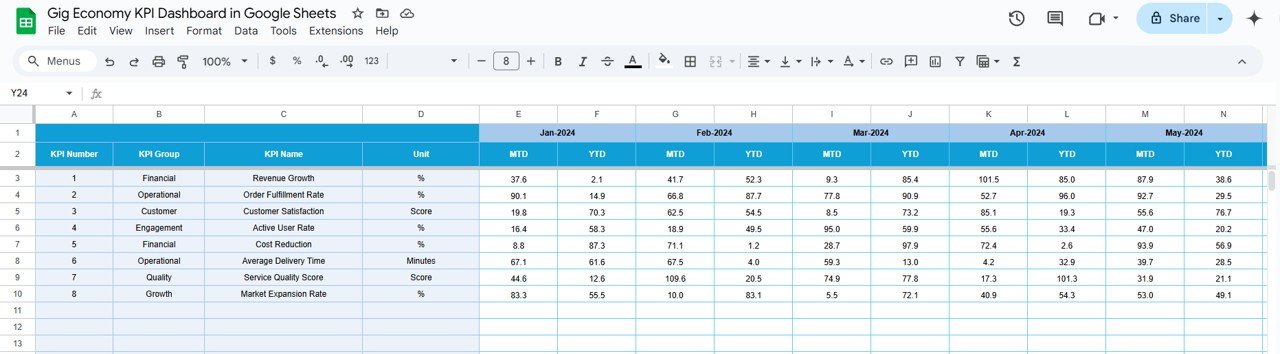
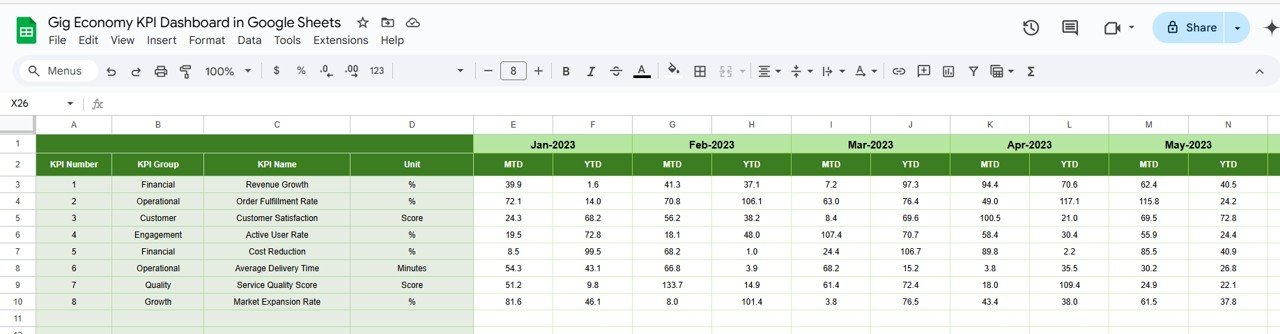
3️⃣ Actual Number Sheet Tab
Enter your current performance metrics here. Once filled, all relevant visuals and stats update across the dashboard.
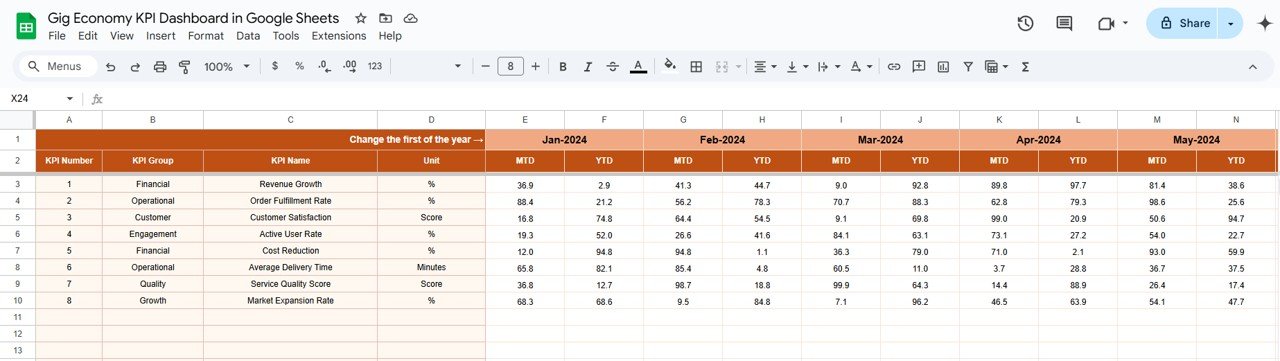
4️⃣ Target Sheet Tab
Set your monthly and yearly targets per KPI to evaluate your performance and refine your operational strategies.
5️⃣ Previous Year Number Sheet Tab
Compare your current performance against last year’s benchmarks. Great for tracking growth and setting realistic goals.
6️⃣ KPI Definition Sheet Tab
Define every metric clearly with its name, group, unit, formula, and interpretation to ensure alignment across teams.
👨💼 Who Can Benefit from This Product?
Perfect for:
🚴 Delivery Service Managers – Track delivery rates, task completion, and earnings
🧑💻 Freelance Platforms – Measure productivity, satisfaction, and service levels
📦 Gig-Based Startups – Analyze key growth metrics and optimize resources
📱 App-Based Task Managers – Ensure real-time KPI monitoring for mobile workers
📊 Consultants & Analysts – Use it to offer value-added KPI tracking to clients
Whether you run a large gig operation or a micro-service platform, this dashboard is a game-changer.
🔗 Click here to read the Detailed blog post
Watch the step-by-step video Demo:


Reviews
There are no reviews yet.