


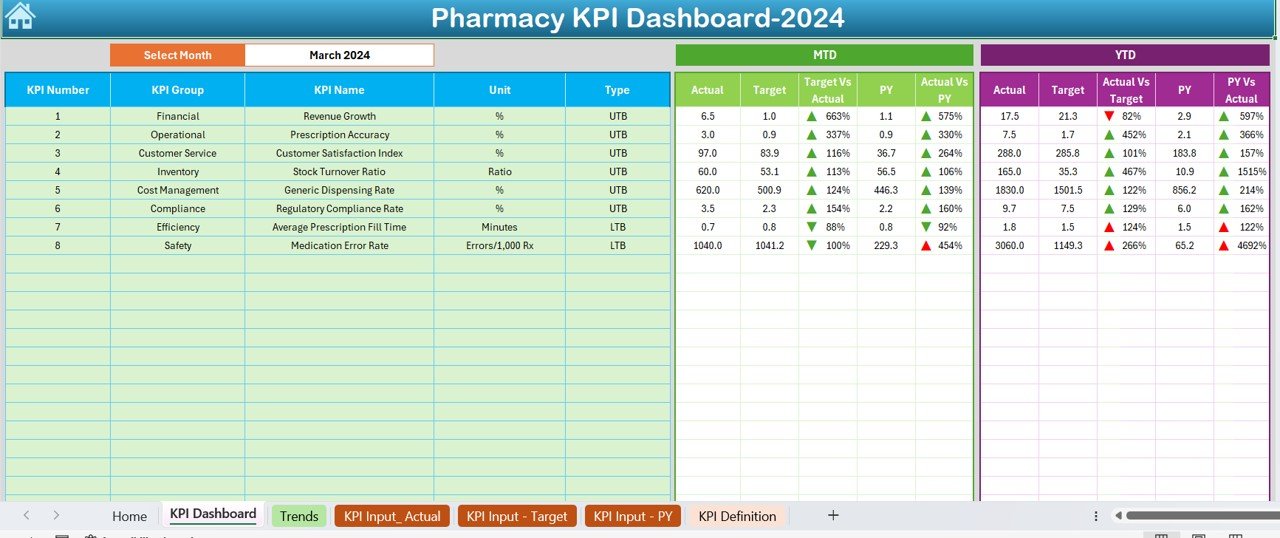



The Pharmacy KPI Dashboard in Excel is a comprehensive tool designed to help pharmacy managers, owners, and healthcare providers track and manage key performance indicators (KPIs) essential for optimizing the performance and operations of a pharmacy. Whether you’re managing a single location or overseeing a chain of pharmacies, this Excel-based dashboard offers essential insights into sales performance, inventory management, customer satisfaction, and operational efficiency.
With its user-friendly interface and customizable features, this dashboard enables you to make data-driven decisions that help improve customer service, streamline pharmacy operations, and boost profitability.

Key Features of the Pharmacy KPI Dashboard in Excel:
💊 Sales Performance Tracking
Monitor sales data, track top-selling products, and measure sales growth over time to evaluate the overall performance of your pharmacy.
📦 Inventory Management
Track inventory levels, monitor stock-outs, and ensure that high-demand products are always available to meet customer needs.
📊 Customer Satisfaction and Retention
Measure customer satisfaction through surveys, track feedback, and assess retention rates to ensure that your pharmacy is providing excellent customer service.
💰 Revenue and Profitability Tracking
Track revenue from sales, insurance claims, and other income streams, while also monitoring pharmacy expenses to ensure financial health.
⏱️ Operational Efficiency
Track key operational metrics such as prescription fulfillment time, employee productivity, and service speed to optimize the efficiency of your pharmacy.
🚀 Why You’ll Love the Pharmacy KPI Dashboard in Excel:
✅ Monitor Sales Performance – Track sales by product category, top-selling items, and overall revenue to measure the performance of your pharmacy.
✅ Optimize Inventory – Track stock levels, manage reorders, and reduce stock-outs to ensure you never run out of essential products.
✅ Enhance Customer Service – Measure customer satisfaction and retention to ensure a positive experience and build long-term relationships.
✅ Track Financial Performance – Monitor revenue, expenses, and profitability to ensure that your pharmacy remains financially viable and profitable.
✅ Improve Operational Efficiency – Track key operational metrics such as prescription fill times and employee performance to optimize pharmacy operations.
✅ Fully Customizable and Interactive – Tailor the dashboard to meet your pharmacy’s specific needs, with real-time data visualizations and interactive reports.
What’s Inside the Pharmacy KPI Dashboard in Excel:
Sales Performance: Track sales data, identify top-selling products, and measure sales growth to evaluate overall pharmacy performance.
Inventory Management: Monitor inventory levels, track stock-outs, and ensure your pharmacy is well-stocked with essential products.
Customer Satisfaction: Track customer feedback, retention rates, and satisfaction surveys to ensure your pharmacy is providing high-quality customer service.
Revenue and Profitability: Monitor revenue streams, such as sales, insurance claims, and government reimbursements, and track pharmacy expenses to maintain financial health.
Operational Efficiency: Track operational metrics such as prescription fulfillment time, employee productivity, and service delivery times to improve pharmacy operations.
Custom Reports: Generate detailed reports on sales, inventory, customer satisfaction, and financial performance to make informed business decisions.
How to Use the Pharmacy KPI Dashboard in Excel:
1️⃣ Download the Template – Instantly access your Excel file upon purchase.
2️⃣ Input Pharmacy Data – Enter sales, inventory, customer satisfaction, and operational data to start tracking key performance indicators.
3️⃣ Track Sales Performance – Use the dashboard to monitor sales by product, track revenue growth, and identify top-selling products.
4️⃣ Monitor Inventory – Track stock levels, inventory turnover, and identify items that need restocking to optimize inventory management.
5️⃣ Evaluate Customer Satisfaction – Monitor customer satisfaction and retention rates to ensure the best possible service.
6️⃣ Track Financial Performance – Monitor revenue, expenses, and profitability to ensure your pharmacy is financially healthy.
7️⃣ Generate Reports – Create detailed reports to analyze sales trends, inventory levels, customer satisfaction, and operational performance for data-driven decision-making.
Who Can Benefit from the Pharmacy KPI Dashboard in Excel:
Pharmacy Owners and Managers
Pharmacy Staff and Operators
Healthcare Providers
Financial Analysts in Healthcare
Inventory Managers
Customer Service Coordinators
Operational Managers in Pharmacies
Healthcare Consultants
Pharmacy Consultants
Healthcare Marketing Teams
The Pharmacy KPI Dashboard in Excel is an essential tool for pharmacy operations. With real-time tracking of sales, inventory, customer satisfaction, and operational efficiency, this dashboard helps you streamline pharmacy management, enhance customer service, and ensure financial sustainability.
Click here to read the Detailed blog post
https://www.pk-anexcelexpert.com/pharmacy-kpi-dashboard-in-excel/
Visit our YouTube channel to learn step-by-step video tutorials
Youtube.com/@PKAnExcelExpert
Compatibility and Requirements
- Works in Microsoft Excel desktop (Excel 2016 or later, or Microsoft 365).
- Charts and KPI views are built into the workbook, so there is nothing else to install.
- New to Excel charts? Microsoft explains the basics in Create a chart from start to finish.
Frequently Asked Questions
Which KPIs does the Pharmacy KPI Dashboard track?
Sales and top-selling products, inventory levels and stock-outs, customer satisfaction and retention, revenue and expenses, and operational metrics such as prescription fulfillment time.
Can it track revenue from insurance claims?
Yes. Revenue can be tracked from sales, insurance claims and other income streams, alongside pharmacy expenses.
Does it work for more than one pharmacy?
Yes. It suits a single location or a chain of pharmacies.
Is there a Google Sheets or Power BI version?
Yes. See the Google Sheets edition and the Power BI edition.
Related Pharmacy Templates
- Pharmacy KPI Dashboard in Google Sheets: the same KPIs online
- Pharmacy KPI Dashboard in Power BI: for Power BI reporting
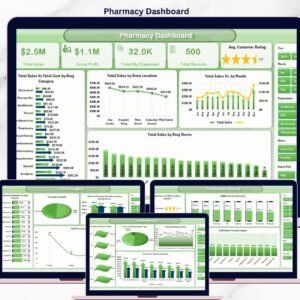
- Pharmacy Dashboard in Excel: a fuller pharmacy dashboard
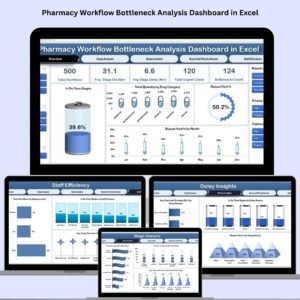
- Pharmacy Workflow Bottleneck Analysis Dashboard in Excel: find delays in the prescription workflow
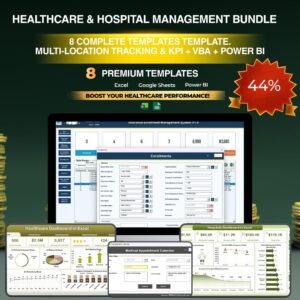
- Healthcare & Hospital Management Bundle: 8 healthcare templates in one download
Browse all Excel health and safety templates or the Excel KPI dashboards.











Reviews
There are no reviews yet.