

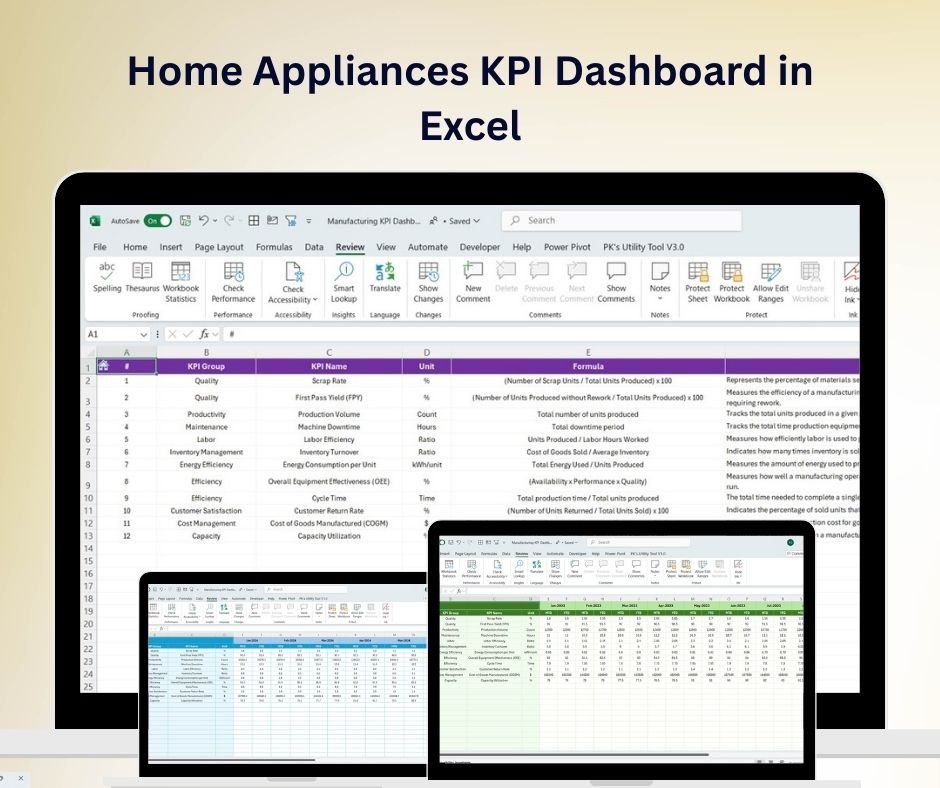



The Home Appliances KPI Dashboard in Excel is an essential tool for home appliance manufacturers, retailers, and distributors to monitor key performance indicators (KPIs) related to product sales, inventory, customer satisfaction, and overall business performance. This Excel-based dashboard provides a clear and interactive overview of critical metrics, enabling businesses to make data-driven decisions and optimize operations for improved profitability.
Whether you are managing a home appliance brand, a retail store, or an online platform, this dashboard helps you track your sales, inventory levels, customer satisfaction, and more to ensure efficient and profitable operations.

Key Features of the Home Appliances KPI Dashboard in Excel:
📊 Sales Performance Tracking
Track sales across different products, regions, and channels to identify trends and make informed decisions on pricing, promotions, and inventory.
📦 Inventory Management
Monitor the stock levels of home appliances, track product turnover rates, and ensure that you maintain optimal inventory levels to avoid stockouts or overstocking.
📉 Customer Satisfaction and Feedback
Analyze customer reviews, ratings, and satisfaction scores to assess product quality, improve offerings, and enhance customer loyalty.
💰 Profitability and Cost Analysis
Track revenue, costs, and profit margins for each product category to ensure your business is operating efficiently and maintaining healthy profitability.
⚡ Operational Efficiency
Monitor key operational metrics such as shipping times, order fulfillment, and supplier performance to streamline logistics and reduce operational costs.
🚀 Why You’ll Love the Home Appliances KPI Dashboard in Excel:
✅ Track Sales Performance – Monitor sales across products, regions, and sales channels to identify growth opportunities and optimize pricing strategies.
✅ Optimize Inventory Management – Ensure you have the right amount of stock at the right time by tracking inventory levels and product turnover.
✅ Enhance Customer Satisfaction – Track customer feedback, ratings, and reviews to continuously improve product quality and customer experience.
✅ Maximize Profitability – Analyze costs, revenue, and profit margins to maintain healthy financial performance and make informed pricing decisions.
✅ Improve Operational Efficiency – Track order fulfillment, shipping times, and supplier performance to streamline logistics and improve efficiency.
✅ Fully Customizable and Interactive – Customize the dashboard to reflect your specific business needs and track the KPIs most relevant to your business.
What’s Inside the Home Appliances KPI Dashboard in Excel:
Sales Tracking: Track sales data for home appliances by product, region, and sales channel to identify trends and optimize sales strategies.
Inventory Management: Monitor stock levels, track turnover rates, and ensure inventory is optimized to meet customer demand.
Customer Satisfaction: Analyze customer feedback, reviews, and satisfaction ratings to improve product offerings and enhance customer loyalty.
Profitability Analysis: Track revenue, costs, and profit margins for each product category to ensure financial sustainability.
Operational Performance: Monitor operational metrics such as order fulfillment, shipping times, and supplier performance to improve efficiency.
Custom Reports: Generate reports that summarize key metrics such as sales performance, customer satisfaction, and operational efficiency for strategic decision-making.
How to Use the Home Appliances KPI Dashboard in Excel:
1️⃣ Download the Template – Instantly access your Excel file upon purchase.
2️⃣ Input Sales and Inventory Data – Enter data on product sales, inventory levels, and customer feedback to start tracking key KPIs.
3️⃣ Monitor Key Metrics – Use the dashboard to track sales, inventory levels, customer satisfaction, and operational performance in real-time.
4️⃣ Analyze Profitability – Track revenue, costs, and profit margins to ensure optimal profitability across all product categories.
5️⃣ Generate Reports – Create custom reports summarizing key performance metrics for better decision-making and business planning.
Who Can Benefit from the Home Appliances KPI Dashboard in Excel:
Home Appliance Manufacturers
Retailers and Distributors
Sales and Marketing Teams
Inventory and Supply Chain Managers
Financial Analysts
Customer Service Teams
Business Analysts
Product Development Teams
The Home Appliances KPI Dashboard in Excel is an ideal tool for businesses in the home appliance industry looking to streamline their operations, track performance, and optimize profitability. With its ability to monitor key sales, inventory, and operational metrics, this dashboard helps ensure your business runs smoothly and efficiently.
Click here to read the Detailed blog post
https://www.pk-anexcelexpert.com/home-appliances-kpi-dashboard-in-excel/
Visit our YouTube channel to learn step-by-step video tutorials
Youtube.com/@PKAnExcelExpert






























Reviews
There are no reviews yet.