



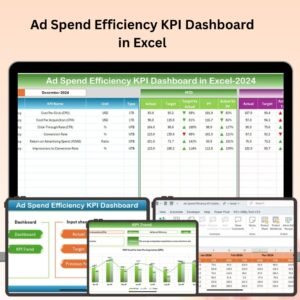
The Ad Spend Efficiency KPI Dashboard in Excel is an essential tool for businesses and marketers looking to track and optimize their advertising spend. This comprehensive Excel dashboard allows you to monitor key performance indicators (KPIs) related to your ad campaigns, such as return on ad spend (ROAS), cost-per-click (CPC), cost-per-impression (CPI), conversion rates, and overall campaign performance.
By providing real-time insights into the effectiveness of your advertising efforts, this dashboard helps you make data-driven decisions, reduce inefficiencies, and maximize your advertising budget. Whether you’re running PPC ads, social media campaigns, or display ads, this dashboard helps you optimize every aspect of your ad spend.

Key Features of the Ad Spend Efficiency KPI Dashboard in Excel:
📊 Comprehensive Ad Spend Tracking
Monitor your total ad spend across multiple campaigns and channels. Track individual ad performance and calculate key efficiency metrics such as CPC, CPI, and ROAS.
💡 Cost-Effectiveness Analysis
Analyze the cost-efficiency of your ad campaigns by comparing spending to conversions, impressions, and overall performance. Ensure you’re getting the most out of your ad budget.
📈 Real-Time Performance Metrics
Track your ad campaigns in real-time with dynamic charts and visual analytics. Get immediate insights into performance trends and identify areas for optimization.
🔄 Multi-Channel Campaign Tracking
Track ad spend efficiency across various platforms like Google Ads, Facebook, Instagram, and more. Compare performance across channels to determine which provides the best ROI.
🎯 Conversion Rate and ROI Monitoring
Measure your ad campaign’s conversion rates and ROI to evaluate the effectiveness of your ad spend. Identify high-performing campaigns and allocate resources to improve results.
📅 Customizable Reports and Dashboards
Generate custom reports for stakeholders or teams, with a clear visualization of how each campaign is performing in terms of ad spend efficiency and results.
🚀 Why You’ll Love the Ad Spend Efficiency KPI Dashboard in Excel:
✅ Maximize ROI – Track key metrics like ROAS, CPC, and conversion rates to ensure your ad campaigns are generating the best possible return on investment.
✅ Optimize Ad Spend – Monitor your ad spend and performance in real-time, helping you make adjustments to improve cost efficiency and increase conversions.
✅ Track Multi-Channel Campaigns – Analyze performance across different advertising platforms to determine which channels are most effective for your business.
✅ Simplify Reporting – Use interactive charts and reports to easily share campaign performance with stakeholders and team members.
✅ Data-Driven Decisions – Make informed decisions to optimize your advertising strategies and improve overall campaign performance.
✅ Customizable and User-Friendly – The Excel interface makes it easy to customize, update, and analyze ad spend efficiency data, even for beginners.
What’s Inside the Ad Spend Efficiency KPI Dashboard in Excel:
- Ad Spend Tracker: Monitor total ad spend for each campaign and track performance across different ad platforms and channels.
- CPC, CPI, and ROAS Metrics: Track cost-per-click, cost-per-impression, and return on ad spend to evaluate campaign cost-efficiency.
- Conversion Rate Tracking: Measure the conversion rate for each campaign to determine how effective your ads are at driving desired actions.
- ROI and Performance Analysis: Analyze the overall ROI of your ad campaigns to assess whether your ad spend is generating the desired results.
- Multi-Channel Comparison: Track ad performance across platforms like Google Ads, Facebook, Instagram, and more, and compare performance for effective budgeting.
- Customizable Reports and Dashboards: Generate tailored reports that present data in an easy-to-read format, helping you communicate campaign performance to key stakeholders.
How to Use the Ad Spend Efficiency KPI Dashboard in Excel:
1️⃣ Download the Template – Access your Excel file instantly upon purchase.
2️⃣ Input Ad Spend Data – Enter your ad spend, impressions, clicks, conversions, and other campaign data into the tracker.
3️⃣ Track Key Metrics – Monitor your KPIs such as CPC, ROAS, and conversion rates for each ad campaign in real-time.
4️⃣ Optimize Campaigns – Use the data to identify high-performing ads and adjust underperforming campaigns to maximize your ad spend efficiency.
5️⃣ Generate Reports – Create customized reports that summarize the performance of your ad campaigns, ideal for stakeholders, managers, or clients.
Who Can Benefit from the Ad Spend Efficiency KPI Dashboard in Excel:
- Digital Marketers
- PPC Campaign Managers
- E-commerce Businesses
- Marketing Teams
- Advertising Agencies
- Brand Managers
- Business Owners
- Data Analysts
The Ad Spend Efficiency KPI Dashboard in Excel helps businesses optimize their ad campaigns by providing clear insights into the performance of each ad dollar spent. It’s an essential tool for ensuring that your advertising efforts are cost-effective, delivering high returns, and aligned with your business goals.
Click here to read the Detailed blog post
https://www.pk-anexcelexpert.com/ad-spend-efficiency-kpi-dashboard-in-excel/
Visit our YouTube channel to learn step-by-step video tutorials
Youtube.com/@PKAnExcelExpert
Compatibility and Requirements
- Works in Microsoft Excel desktop (Excel 2016 or later, or Microsoft 365).
- Results are shown in charts. Microsoft explains Excel charts in Create a chart from start to finish.
Frequently Asked Questions
Which KPIs does the Ad Spend Efficiency KPI Dashboard track?
It tracks total ad spend, return on ad spend (ROAS), cost per click (CPC), cost per impression (CPI), conversion rates and ROI.
Can I compare ad channels?
Yes. You can track spend and results across platforms such as Google Ads, Facebook and Instagram and compare which gives the best ROI.
Can I share results with my team?
Yes. You can build reports for stakeholders that show how each campaign performs.
Is there a Power BI or Google Sheets version?
Yes. The Ad Spend Efficiency KPI Dashboard in Power BI and the Google Sheets edition cover the same topic.
Related Advertising Templates
- Ad Spend Efficiency KPI Dashboard in Power BI: the same topic in Power BI
- Ad Spend Efficiency KPI Dashboard in Google Sheets: the same topic in Google Sheets
- Advertising KPI Dashboard in Excel: track advertising KPIs in Excel
- Digital Advertising KPI Dashboard in Excel: KPIs for digital advertising in Excel
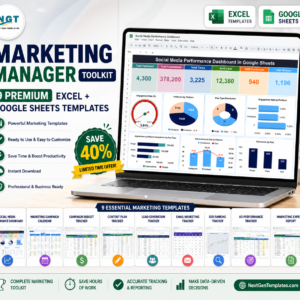
- Marketing Manager Toolkit: 9 marketing templates in one download
Browse all Excel KPI dashboards or the Excel sales and marketing templates.































Reviews
There are no reviews yet.