

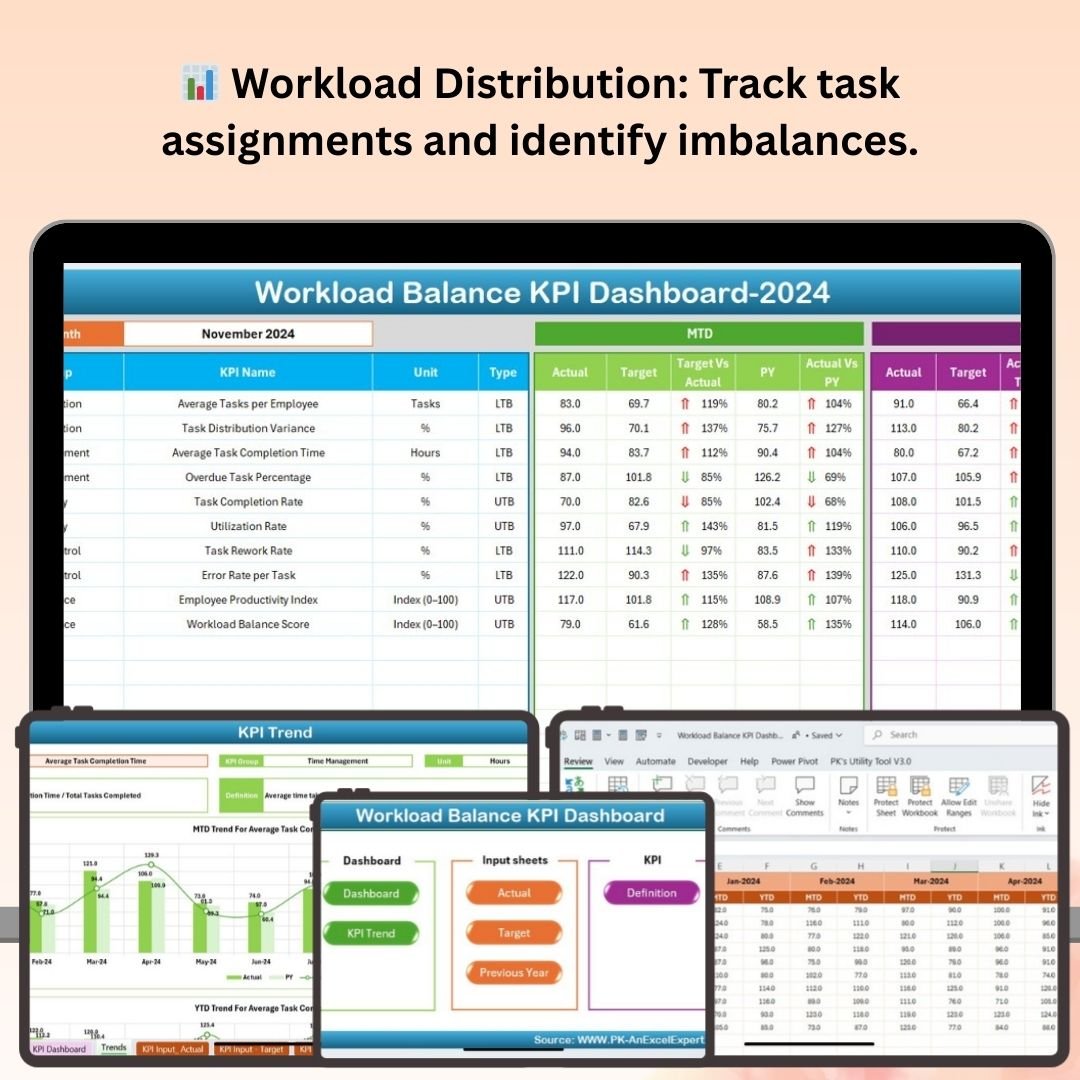
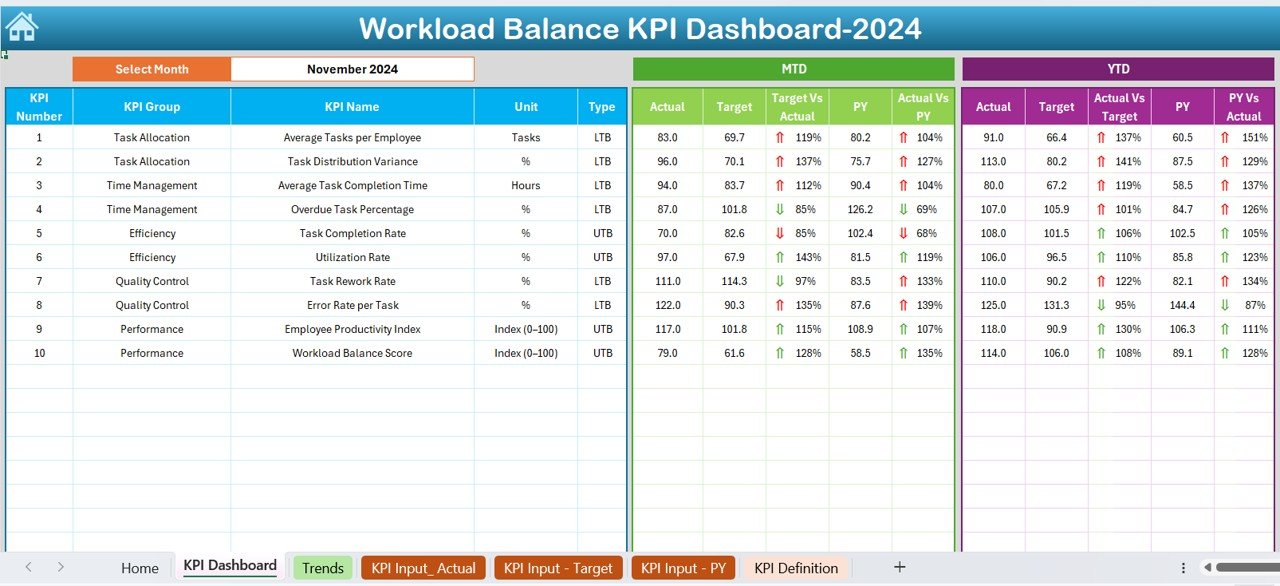
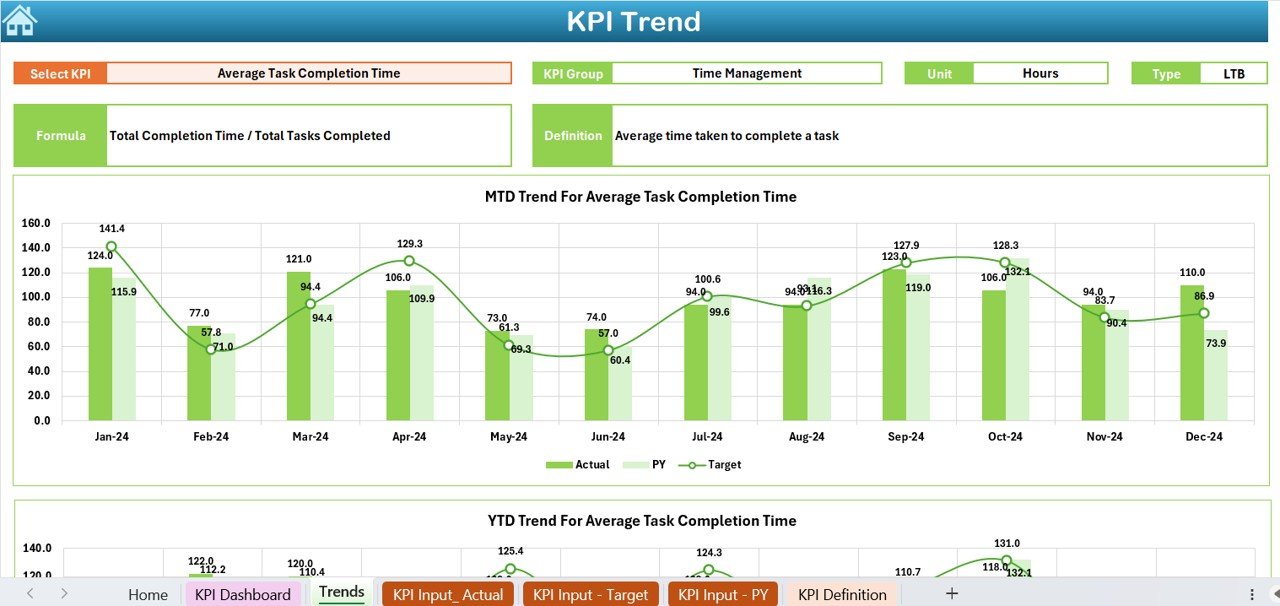
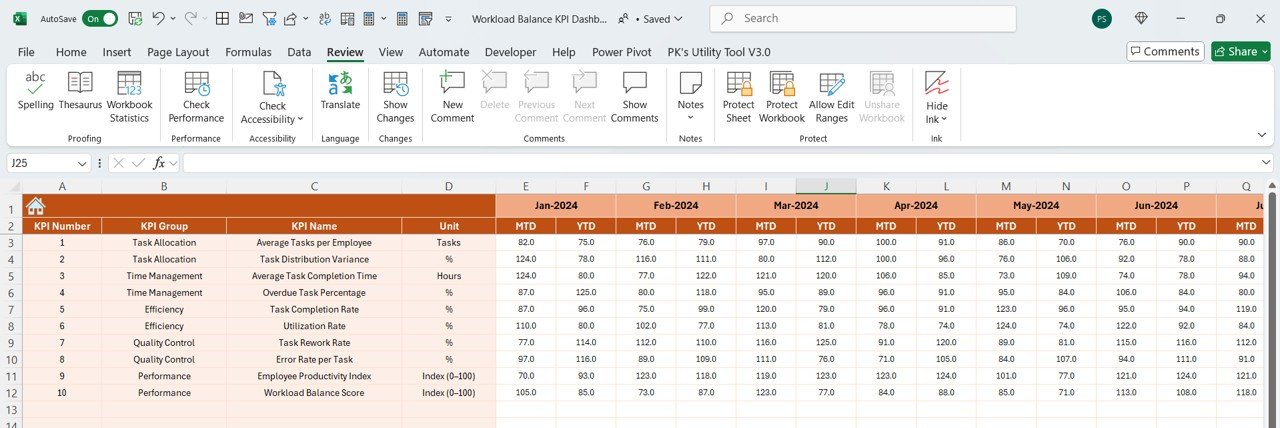
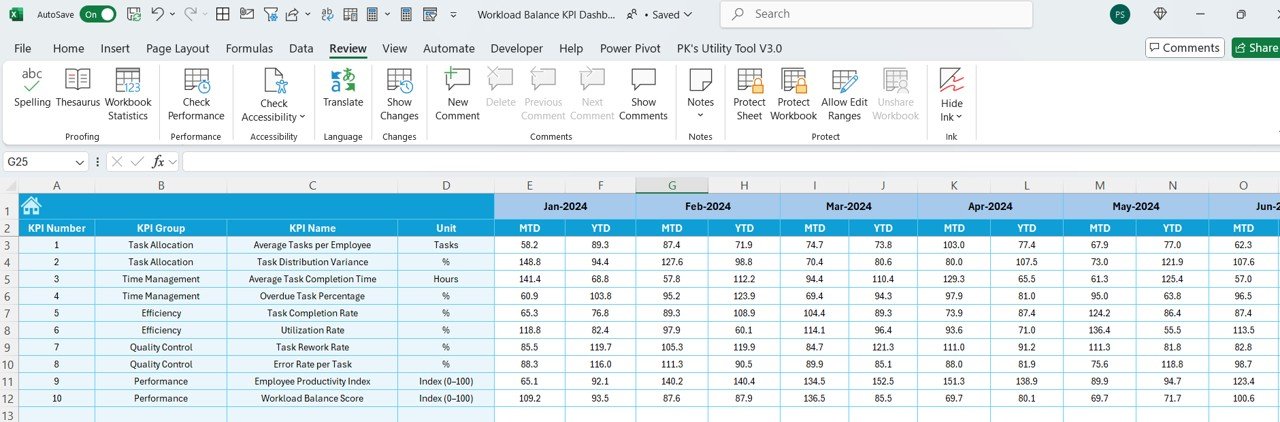
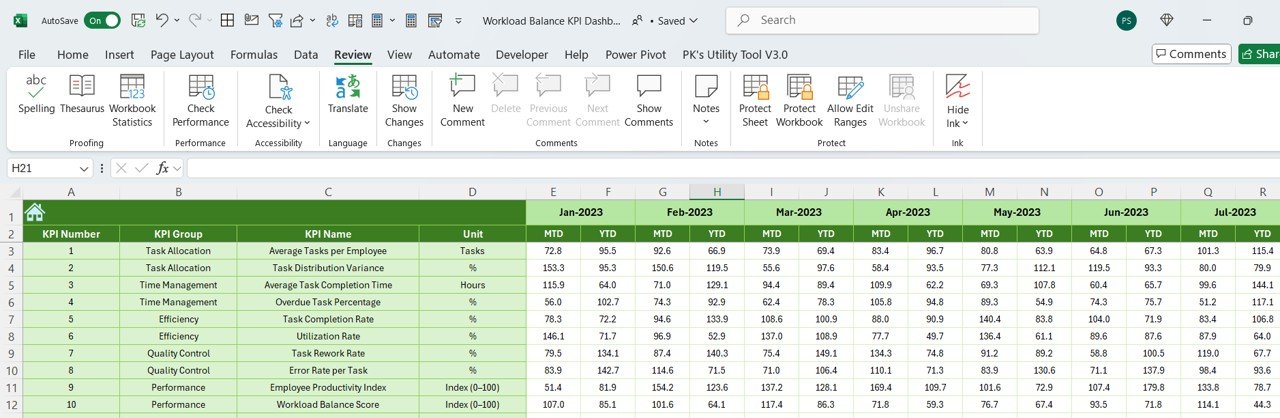
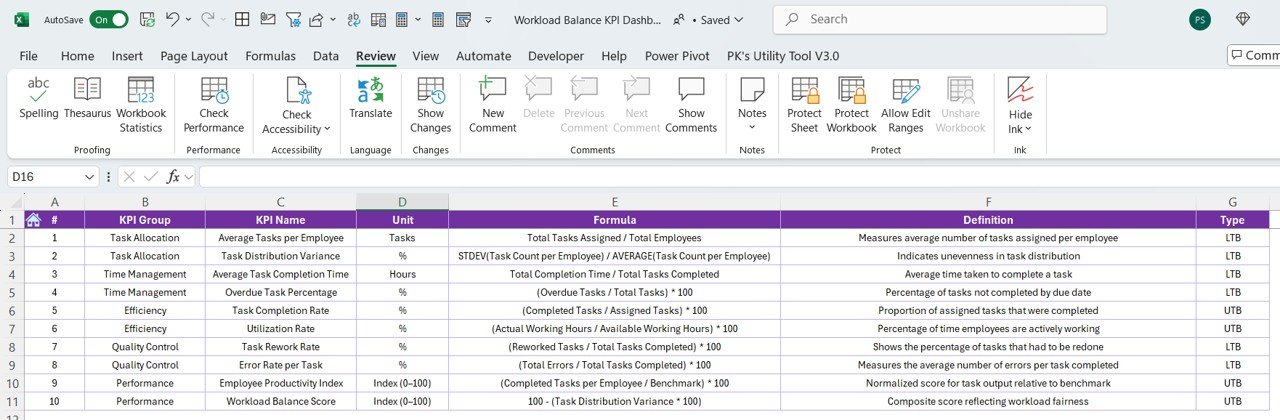

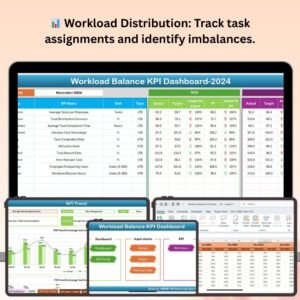
The Workload Balance KPI Dashboard in Excel is a powerful tool designed to help managers, HR professionals, and team leaders effectively monitor and balance workloads across teams and departments. This Excel-based dashboard provides real-time insights into key performance indicators (KPIs) related to workload distribution, employee productivity, and task completion rates, allowing you to ensure that workloads are evenly distributed and employees are not overwhelmed or underutilized.
With this dashboard, you can track employee task allocation, identify resource gaps, and optimize team performance. The visual interface makes it easy to understand workload distribution, assess the performance of individual team members, and make data-driven decisions that improve team productivity and overall efficiency.
Key Features of the Workload Balance KPI Dashboard in Excel
📊 Workload Distribution Monitoring
Track the number of tasks assigned to each team member and monitor workload distribution across departments. Easily identify employees who are overburdened or underworked and take corrective actions to ensure balanced workload allocation.
📝 Task Completion & Performance Tracking
Monitor task completion rates, deadlines, and performance metrics to evaluate employee productivity. This allows you to assess whether tasks are completed on time and if any adjustments need to be made to task assignments.
📅 Time-Based Performance Analysis
Analyze team and individual performance over different time periods (daily, weekly, monthly). Use historical data to identify trends, improve future task allocation, and forecast workload needs.
⚙️ Resource Allocation Insights
Gain insights into how well resources (time, manpower, and skills) are being utilized. Make data-driven decisions about resource allocation to optimize team efficiency.
📈 Customizable KPIs & Metrics
Customize the dashboard to track the most relevant KPIs for your team’s or organization’s workload management. Whether it’s task completion rates, productivity scores, or time spent on tasks, you can tailor the dashboard to fit your specific needs.
🔑 Real-Time Data Integration
Integrate data from various project management tools, HR systems, or time-tracking software to get real-time updates. Monitor KPIs and workload balance without delays and stay up to date with accurate data.
Why You’ll Love the Workload Balance KPI Dashboard in Excel
✅ Streamlined Workload Monitoring
Efficiently monitor how tasks are distributed across your team and identify areas where work needs to be reassigned to ensure balanced workloads.
✅ Improve Employee Productivity
Track task completion, deadlines, and performance to ensure that all employees are meeting expectations. Use the insights to implement strategies for boosting productivity.
✅ Enhance Team Efficiency
Use the dashboard’s insights to ensure resources are utilized optimally, preventing both burnout and inefficiency.
✅ Data-Driven Decision Making
Make informed decisions based on real-time data and historical trends. Improve task allocation, resource planning, and workforce management with actionable insights.
✅ Fully Customizable & Scalable
Adapt the dashboard to meet the specific needs of your team or organization. Customize KPIs, adjust data inputs, and modify reporting sections to fit your unique workload management processes.
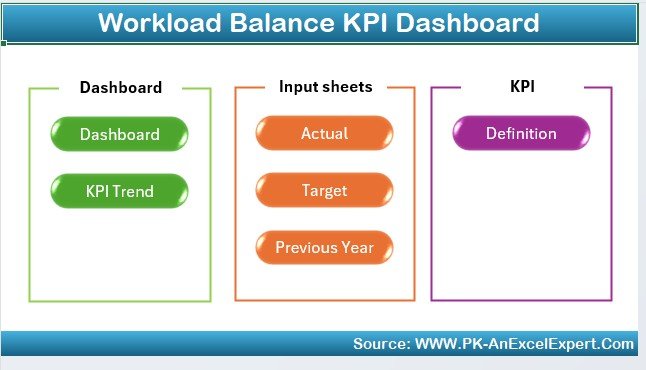
What’s Inside the Workload Balance KPI Dashboard in Excel?
Workload Distribution Monitoring: Track and balance workload across teams and departments.
Task Completion & Performance Tracking: Monitor task completion rates, deadlines, and performance.
Time-Based Analysis: Evaluate workload distribution and team performance over different time periods.
Resource Allocation Insights: Analyze how well resources are being utilized across teams.
Customizable KPIs: Tailor the dashboard to track the KPIs most relevant to your team’s needs.
Real-Time Data Integration: Sync data from various project management or time-tracking tools.
How to Use the Workload Balance KPI Dashboard in Excel
1️⃣ Download the Template: Get access to the Workload Balance KPI Dashboard in Excel instantly.
2️⃣ Input Your Team Data: Enter employee details, assigned tasks, deadlines, and workload data into the dashboard.
3️⃣ Monitor Workload Distribution: Track how tasks are distributed and identify any imbalances.
4️⃣ Analyze Task Completion & Performance: Assess how well tasks are being completed on time and track individual performance.
5️⃣ Optimize Resource Allocation: Use the insights to allocate resources more efficiently and balance workloads across your team.
Who Can Benefit from the Workload Balance KPI Dashboard in Excel?
🔹 HR & Workforce Managers
🔹 Team Leaders & Supervisors
🔹 Project Managers
🔹 Operations & Resource Managers
🔹 Small & Medium Enterprises (SMBs)
🔹 Large Enterprises with Multiple Teams
🔹 Organizational Efficiency Experts
Ensure balanced workloads and optimize productivity across your teams with the Workload Balance KPI Dashboard in Excel. Track task distribution, monitor team performance, and make data-driven decisions to improve workforce efficiency.
Click here to read the Detailed blog post
Visit our YouTube channel to learn step-by-step video tutorials
Youtube.com/@PKAnExcelExpert






























Reviews
There are no reviews yet.