

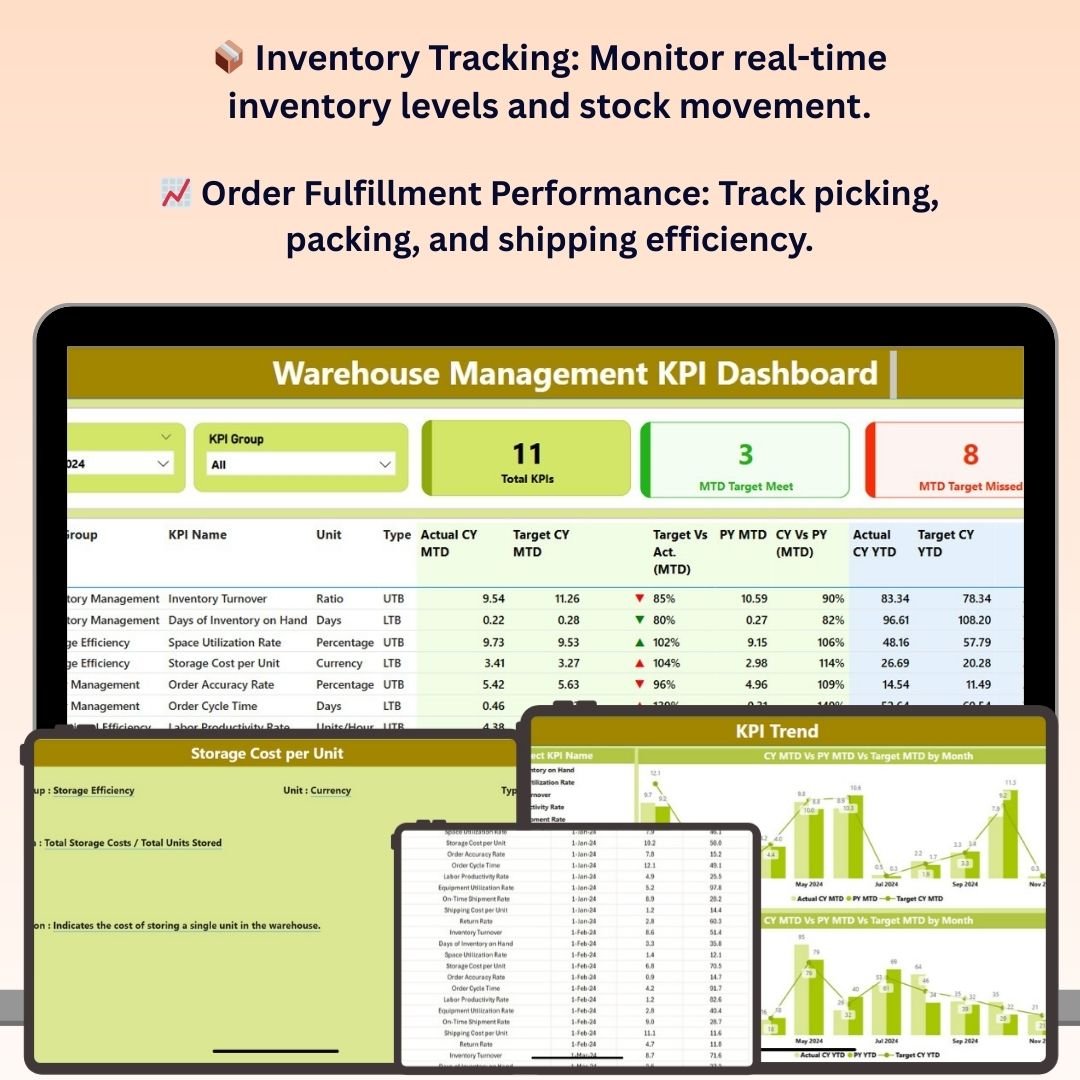
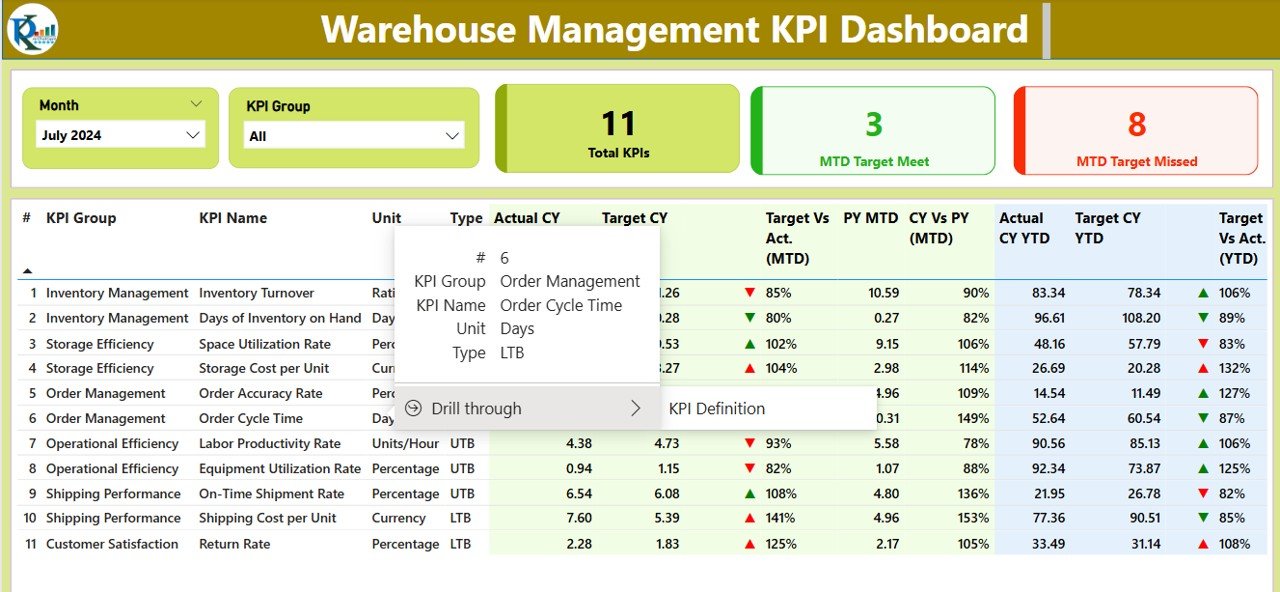
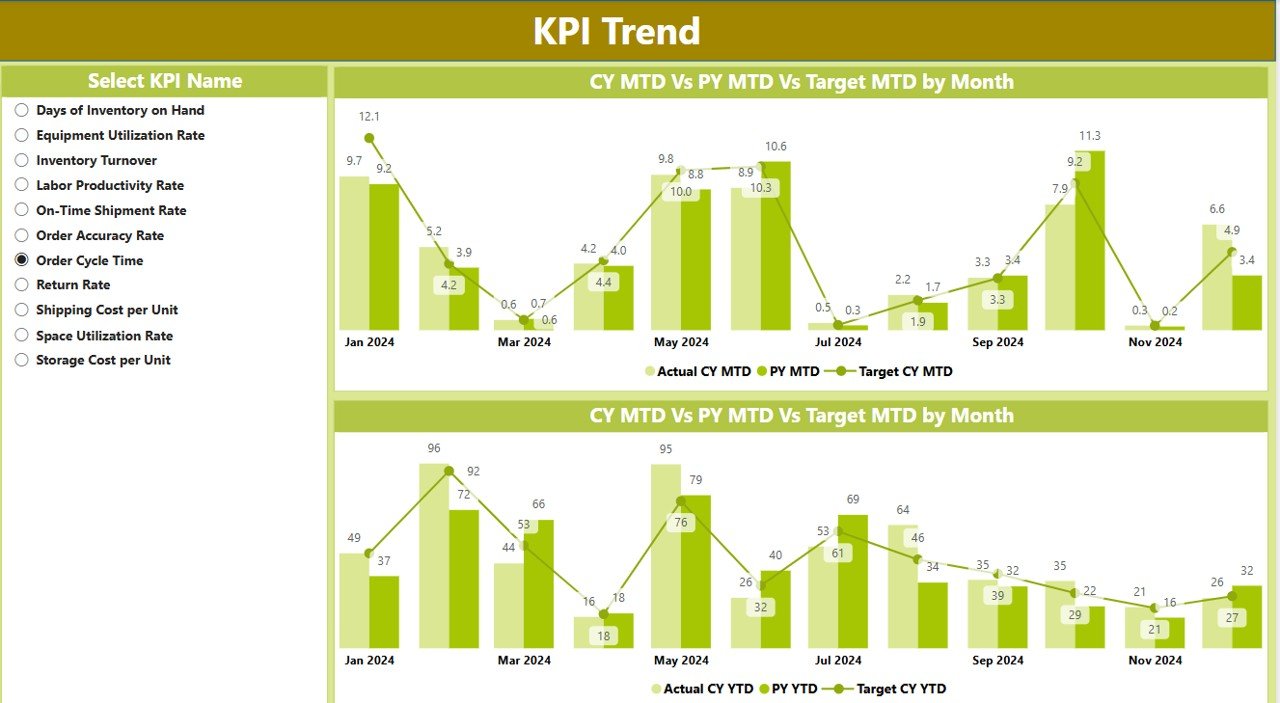
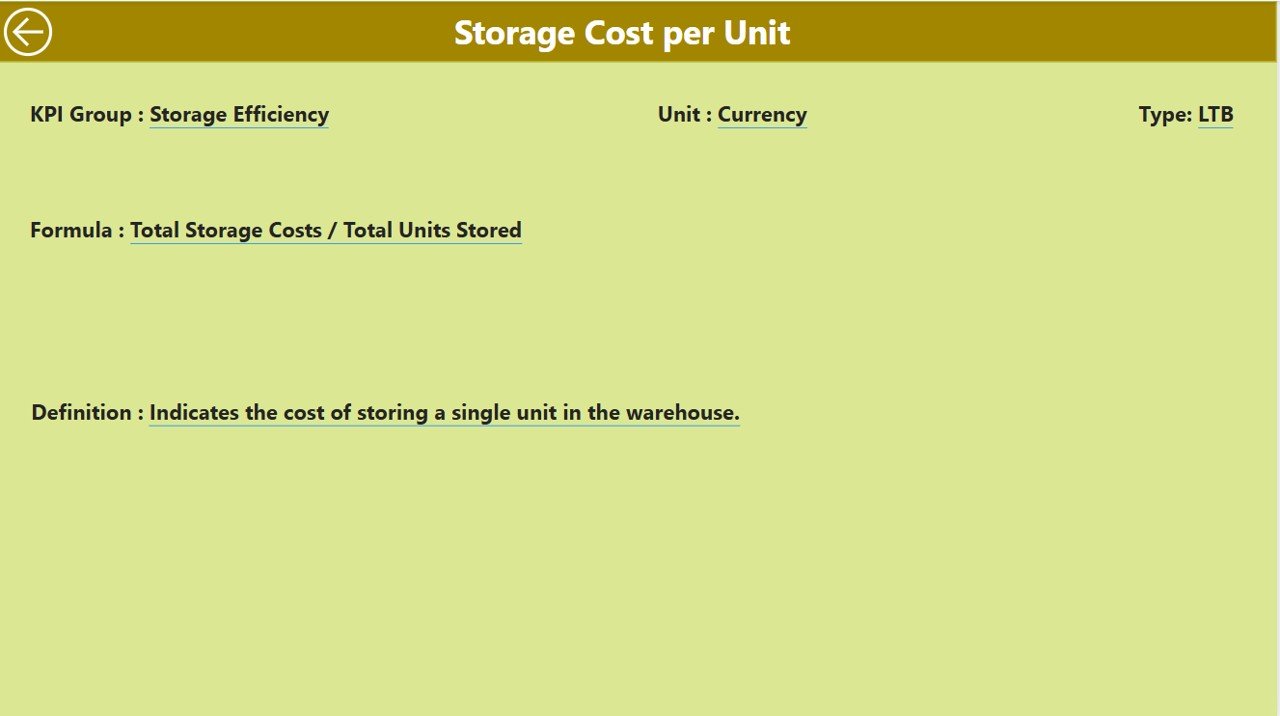
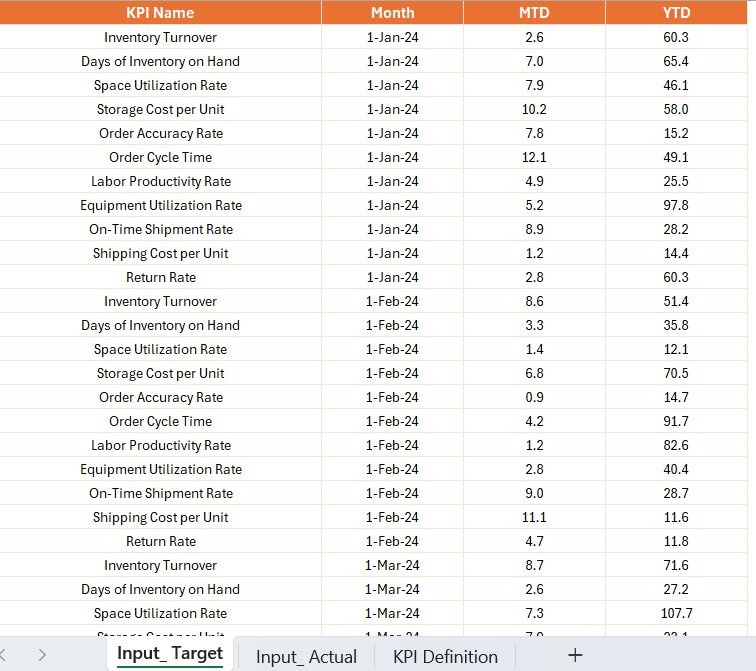
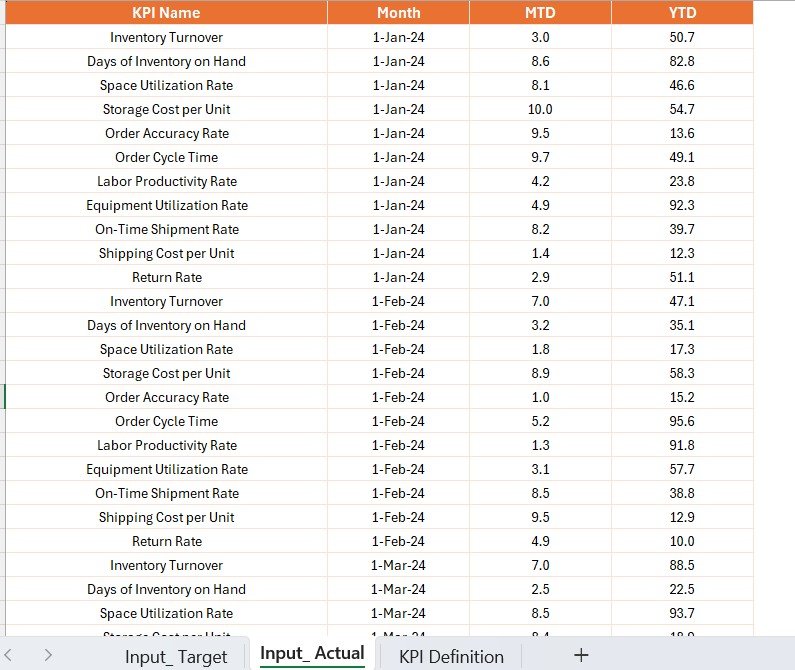
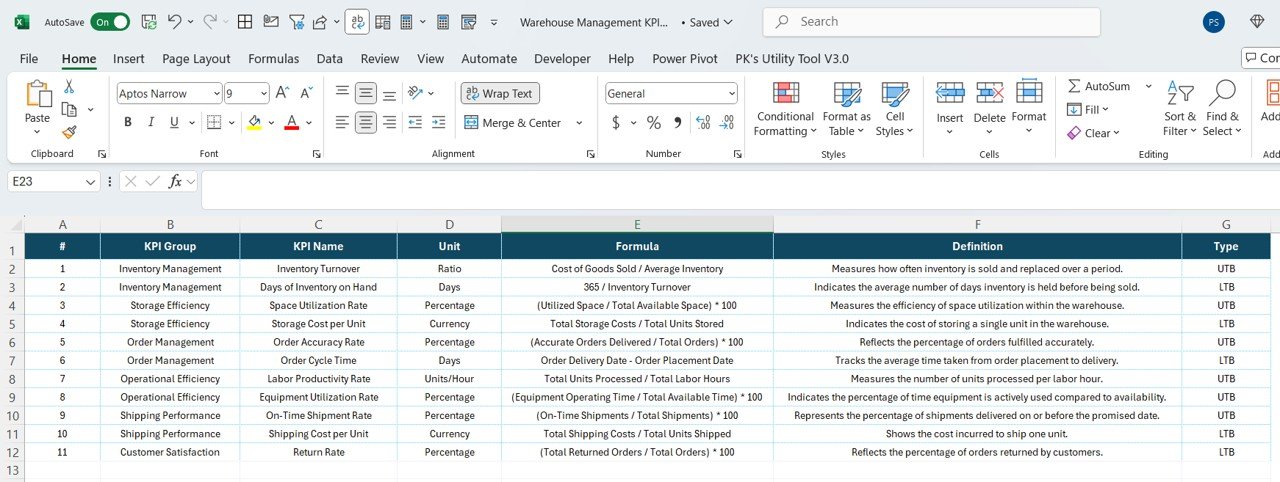

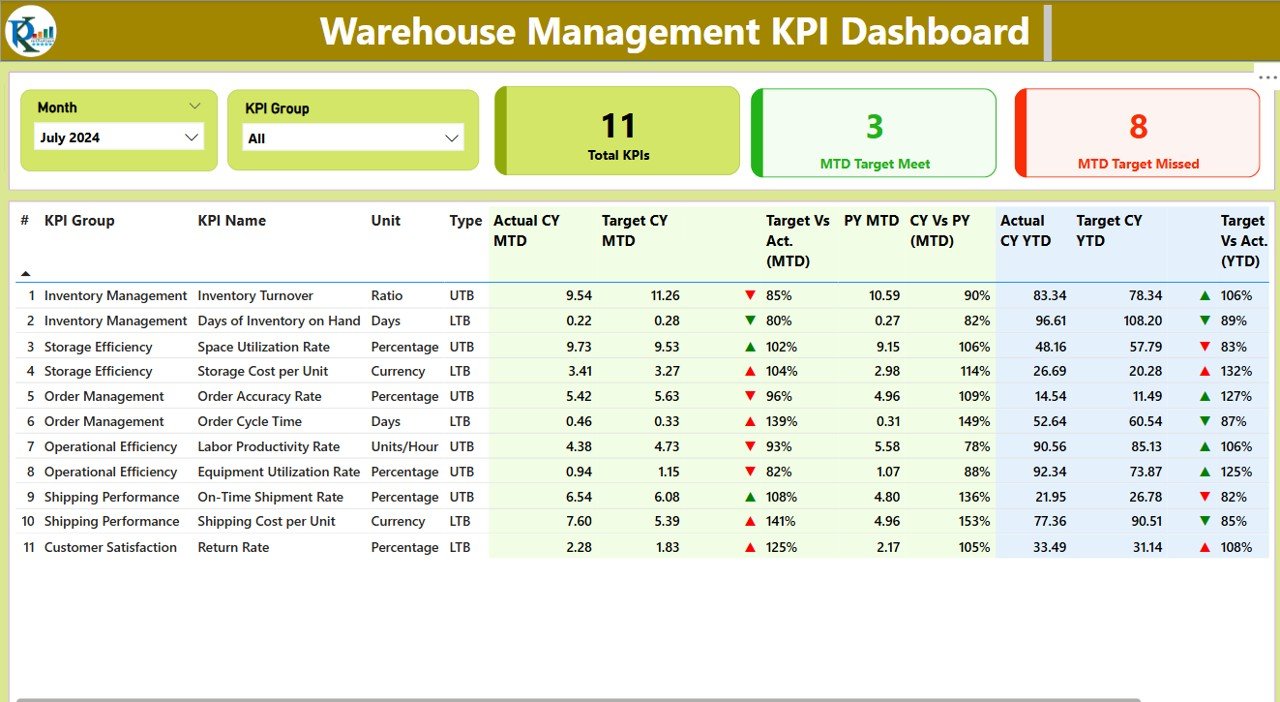
The Warehouse Management KPI Dashboard in Power BI is an advanced tool designed to help warehouse managers, supply chain professionals, and business owners optimize their operations by tracking key performance indicators (KPIs) in real time. With this Power BI-based dashboard, you can monitor inventory levels, order fulfillment, picking and packing efficiency, and warehouse productivity, ensuring that your warehouse is running smoothly and efficiently.
This dashboard provides valuable insights into warehouse operations, helping you reduce operational costs, improve inventory management, enhance employee performance, and ultimately deliver a superior customer experience. Whether you’re managing a small warehouse or a large-scale distribution center, this tool will give you the data-driven insights you need to enhance operational efficiency.
Key Features of the Warehouse Management KPI Dashboard in Power BI
📦 Inventory Tracking & Management
Monitor real-time inventory levels, stock movement, and product performance. Ensure that your warehouse is always stocked and avoid stockouts or overstocking with efficient inventory tracking.
📈 Order Fulfillment Performance
Track the performance of order fulfillment processes such as picking, packing, and shipping. Monitor order accuracy, processing time, and timely delivery to ensure that customer orders are fulfilled on time.
⏱ Picking and Packing Efficiency
Analyze the efficiency of picking and packing operations. Track the time it takes for warehouse employees to pick and pack items and identify areas for improvement to speed up the process.
🚚 Shipment & Delivery Monitoring
Monitor shipping times, delivery schedules, and transportation efficiency. Track on-time deliveries and identify shipping delays to improve delivery accuracy and customer satisfaction.
📊 Warehouse Productivity Metrics
Track the overall productivity of the warehouse, including labor productivity, throughput rates, and operational efficiency. Analyze employee performance to optimize staffing and maximize warehouse output.
⚙️ Customizable KPIs & Reporting
Customize the dashboard to include the most relevant KPIs for your warehouse operations. Create custom reports to analyze trends, track performance, and make data-driven decisions to improve operations.
Why You’ll Love the Warehouse Management KPI Dashboard in Power BI
✅ Real-Time Insights
Get real-time insights into your warehouse operations, helping you make faster, more informed decisions that improve efficiency.
✅ Optimize Inventory Management
Track inventory levels, product movement, and replenishment needs to avoid stockouts and optimize warehouse space.
✅ Improve Order Fulfillment Efficiency
Monitor the performance of picking, packing, and shipping processes to identify bottlenecks and streamline operations for quicker order processing.
✅ Increase Warehouse Productivity
Analyze productivity metrics and identify areas for improvement to optimize workforce performance and maximize output.
✅ Data-Driven Decision Making
Make better, more informed decisions using comprehensive data analysis to optimize warehouse operations and reduce costs.
What’s Inside the Warehouse Management KPI Dashboard in Power BI?
- Inventory Tracking & Management: Monitor real-time stock levels and movements.
- Order Fulfillment Performance: Track the accuracy and efficiency of order processing.
- Picking & Packing Efficiency: Analyze the time and efficiency of picking and packing operations.
- Shipment & Delivery Monitoring: Track shipping performance and on-time deliveries.
- Warehouse Productivity Metrics: Monitor overall warehouse productivity and labor efficiency.
- Customizable Features: Tailor the dashboard to fit your warehouse needs.
How to Use the Warehouse Management KPI Dashboard in Power BI
1️⃣ Download the Template: Access the Warehouse Management KPI Dashboard in Power BI instantly.
2️⃣ Connect Your Data Sources: Integrate data from your warehouse management systems, inventory tools, and shipping platforms.
3️⃣ Track Key Performance Metrics: Monitor inventory, order fulfillment, labor productivity, and more in real time.
4️⃣ Analyze Trends & Performance: Use time-based analysis to identify trends and areas for improvement in warehouse operations.
5️⃣ Optimize Your Operations: Make data-driven decisions that improve warehouse efficiency, reduce costs, and enhance customer satisfaction.
Who Can Benefit from the Warehouse Management KPI Dashboard in Power BI?
🔹 Warehouse Managers & Supervisors
🔹 Supply Chain & Logistics Managers
🔹 Operations Managers
🔹 E-commerce Businesses & Retailers
🔹 Distribution Centers & Fulfillment Centers
🔹 Small, Medium, & Large Enterprises
🔹 Business Owners Looking to Optimize Warehouse Operations
Streamline your warehouse operations and optimize performance with the Warehouse Management KPI Dashboard in Power BI. Track essential metrics, improve efficiency, and make data-driven decisions to enhance your business’s logistics and warehouse management processes.
Click here to read the Detailed blog post
Visit our YouTube channel to learn step-by-step video tutorials
Youtube.com/@PKAnExcelExpert














Reviews
There are no reviews yet.