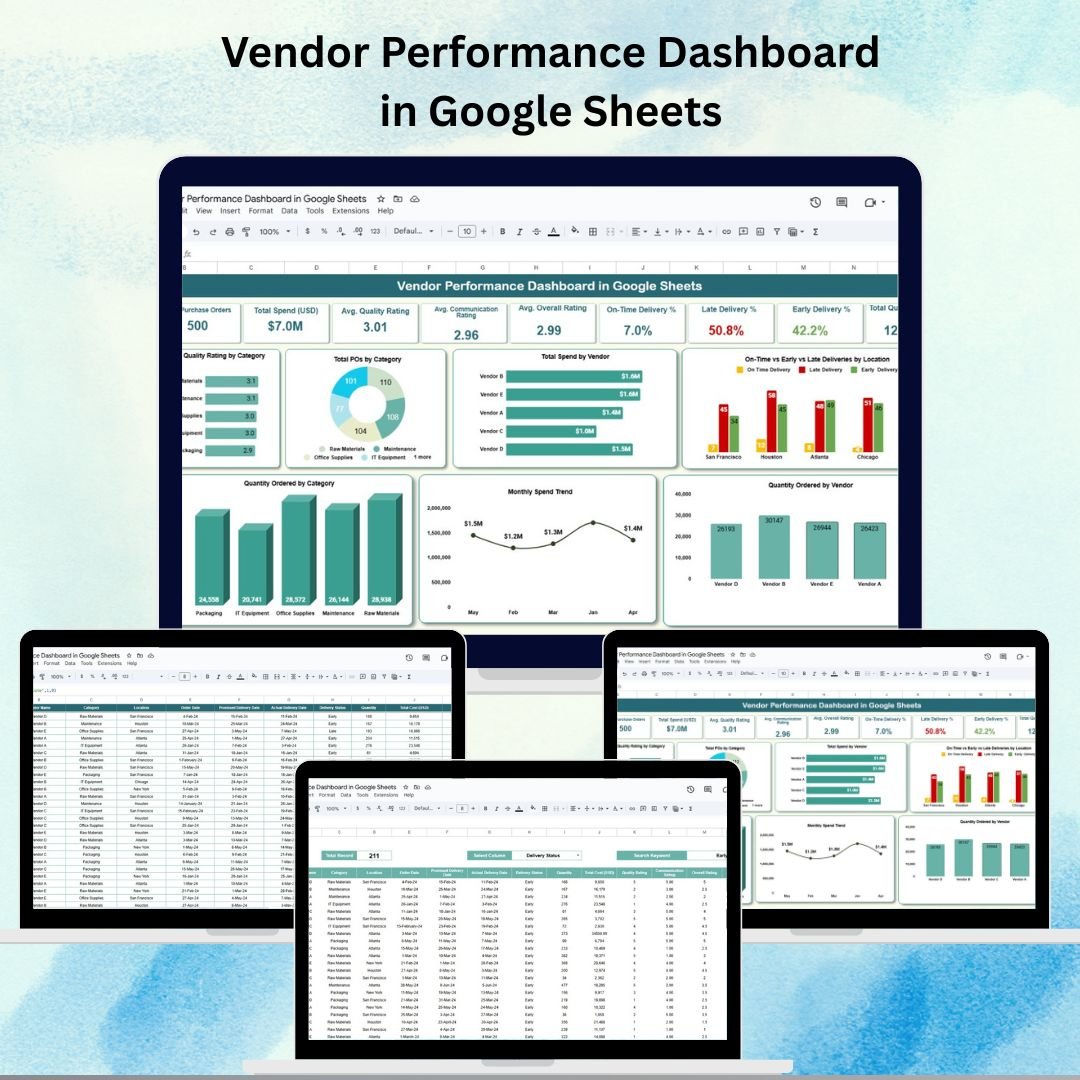
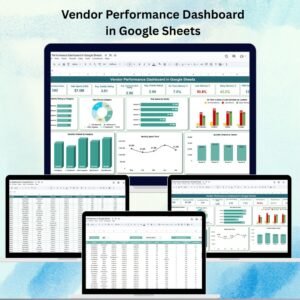
Strong vendor relationships are built on data, not just trust. The Vendor Performance Dashboard in Google Sheets is a ready-to-use, fully interactive solution for tracking, comparing, and optimizing supplier performance.
Whether you manage a small group of suppliers or a large procurement network, this dashboard consolidates purchase orders, spend, delivery performance, and ratings into one streamlined tool — enabling faster decision-making and better vendor management.
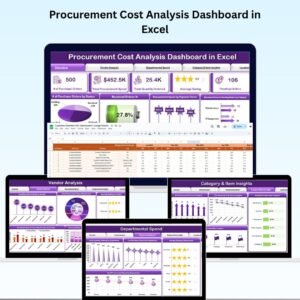
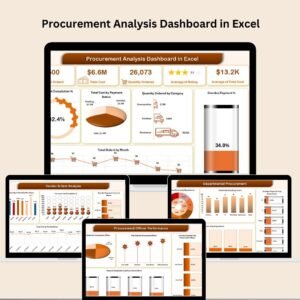
🔑 Key Features of the Vendor Performance Dashboard
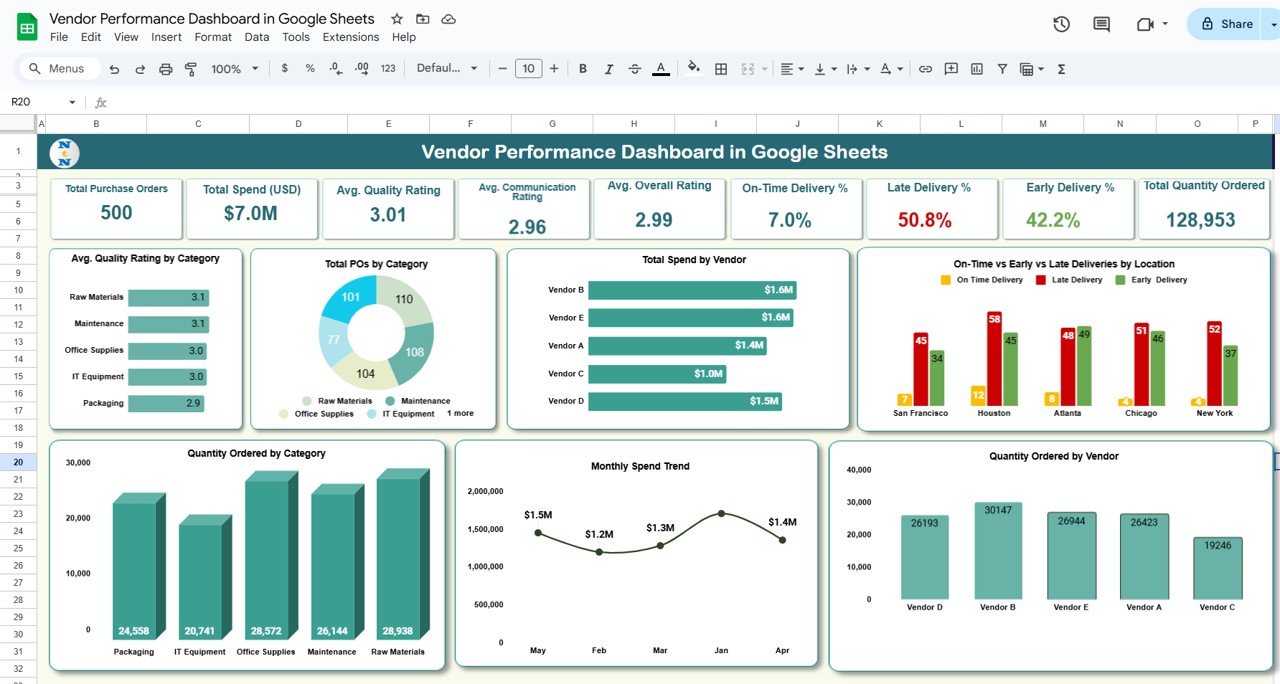
📌 Dashboard Sheet – Your Command Center
-
Quick KPI Cards:
-
Total Purchase Orders
-
Total Spend (USD)
-
Average Quality Rating
-
Average Communication Rating
-
Average Overall Rating
-
On-Time Delivery %
-
Late Delivery %
-
Early Delivery %
-
Total Quantity Ordered
-
-
Category & Vendor Analysis:
-
Average Quality Rating by Category
-
Total POs by Category
-
Total Spend by Vendor
-
Quantity Ordered by Vendor
-
Quantity Ordered by Category
-
-
Delivery & Trend Insights:
-
On-Time vs Early vs Late Deliveries by Location
-
Monthly Spend Trend
-
-
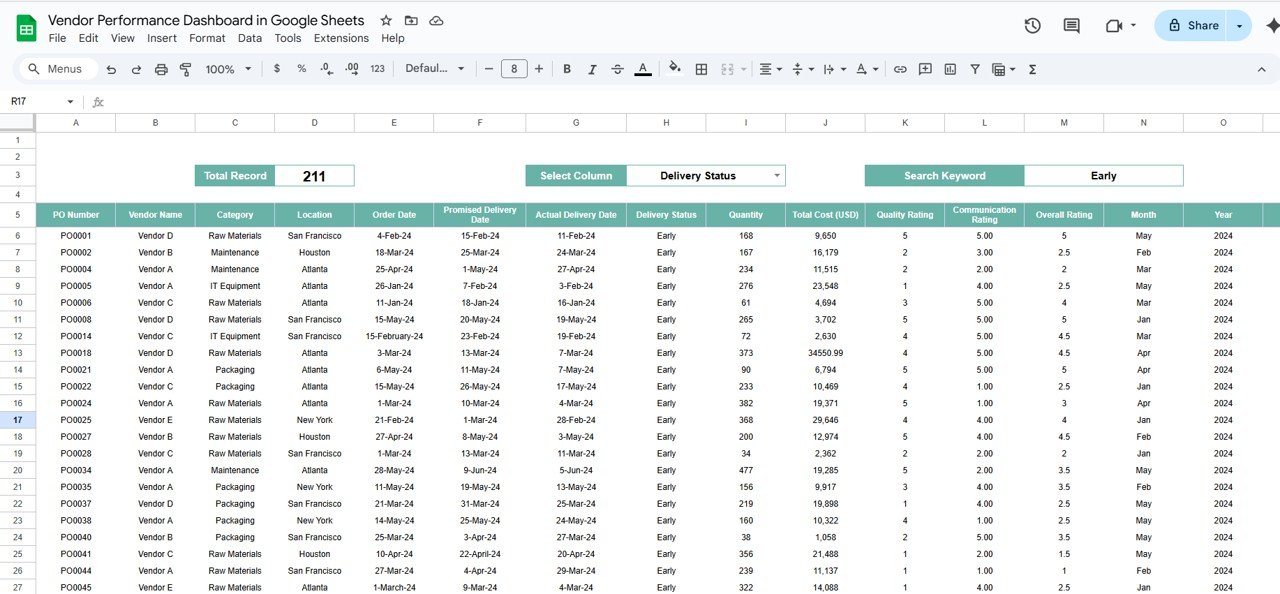
Interactive Search: Filter instantly by delivery status, vendor, category, or month.
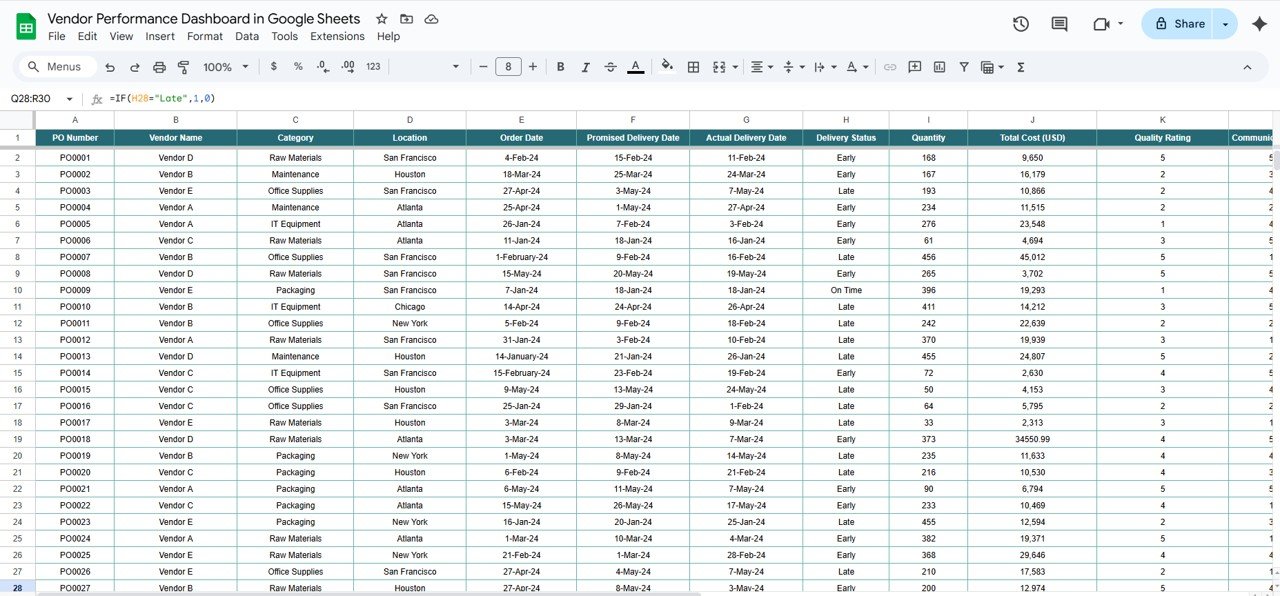
📌 Data Sheet – Centralized Data Management
-
Fields include:
-
PO Number
-
Vendor Name
-
Category
-
Location
-
Order Date, Promised Date, Actual Date
-
Delivery Status (On-Time, Early, Late)
-
Quantity Ordered
-
Total Cost (USD)
-
Quality Rating, Communication Rating, Overall Rating
-
Month & Year
-
-
Fully structured for dynamic KPI calculation and automated chart updates.
📦 What’s Inside the Vendor Performance Dashboard?
✅ Dashboard Tab – Interactive KPIs & charts
✅ Data Tab – Complete purchase order records
✅ Search Filters – Slice data by vendor, status, category, or date
✅ Pre-Built Formulas & Visuals – No setup required
✅ Customizable Layout – Add your own KPIs or modify charts
✅ Sample Data – Understand functionality instantly
🧠 How to Use the Vendor Performance Dashboard
-
Make a Copy in your Google Drive.
-
Enter Purchase Order Data in the Data Sheet.
-
Review KPIs and charts in the Dashboard Tab.
-
Use filters to analyze specific vendors, categories, or delivery statuses.
-
Update data regularly to keep performance tracking accurate.
👥 Who Can Benefit from This Dashboard?
-
📦 Procurement Managers – Track vendor efficiency and delivery reliability.
-
🏭 Manufacturing Businesses – Monitor supply timelines and product quality.
-
🏢 Retail Chains – Compare vendor performance across regions.
-
🚚 Supply Chain Teams – Identify bottlenecks and negotiate better terms.
🔗 Click here to read the Detailed blog post
Watch the step-by-step video Demo:


%20in%20Google%20Sheets&url=https://nextgentemplates.com/product/weekly-project-plan-gantt-chart-in-google-sheets/&media=https://nextgentemplates.com/wp-content/uploads/2025/06/Weekly-Project-Plan-Gantt-Chart-in-Google-Sheets-2-1024x1024.jpg)
Reviews
There are no reviews yet.