


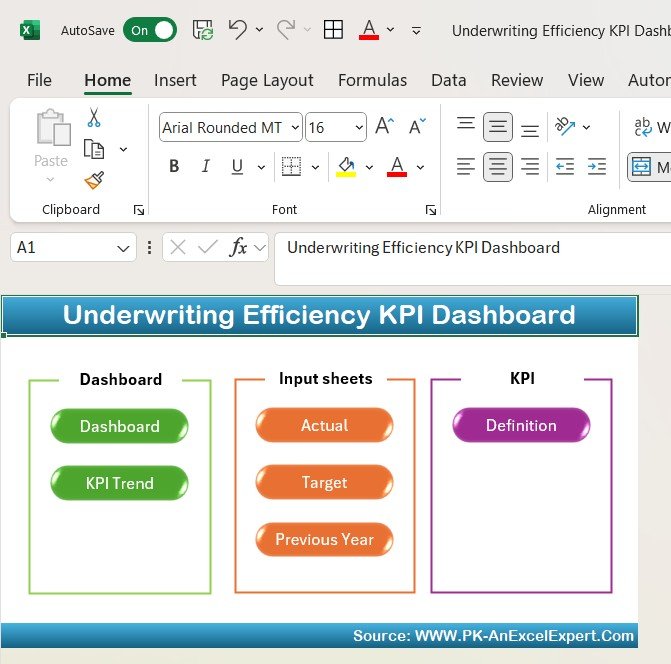



The Underwriting Efficiency KPI Dashboard in Excel is a comprehensive tool designed for insurance companies, underwriting managers, and teams to track key performance indicators (KPIs) that measure the effectiveness and efficiency of the underwriting process. Whether you’re managing personal, commercial, or specialty lines of insurance, this Excel-based dashboard helps you monitor and optimize underwriting operations by tracking productivity, approval rates, cycle times, and risk exposure.
With real-time tracking and interactive features, this dashboard enables you to identify bottlenecks, improve underwriting efficiency, and make data-driven decisions that improve profitability and reduce risk.
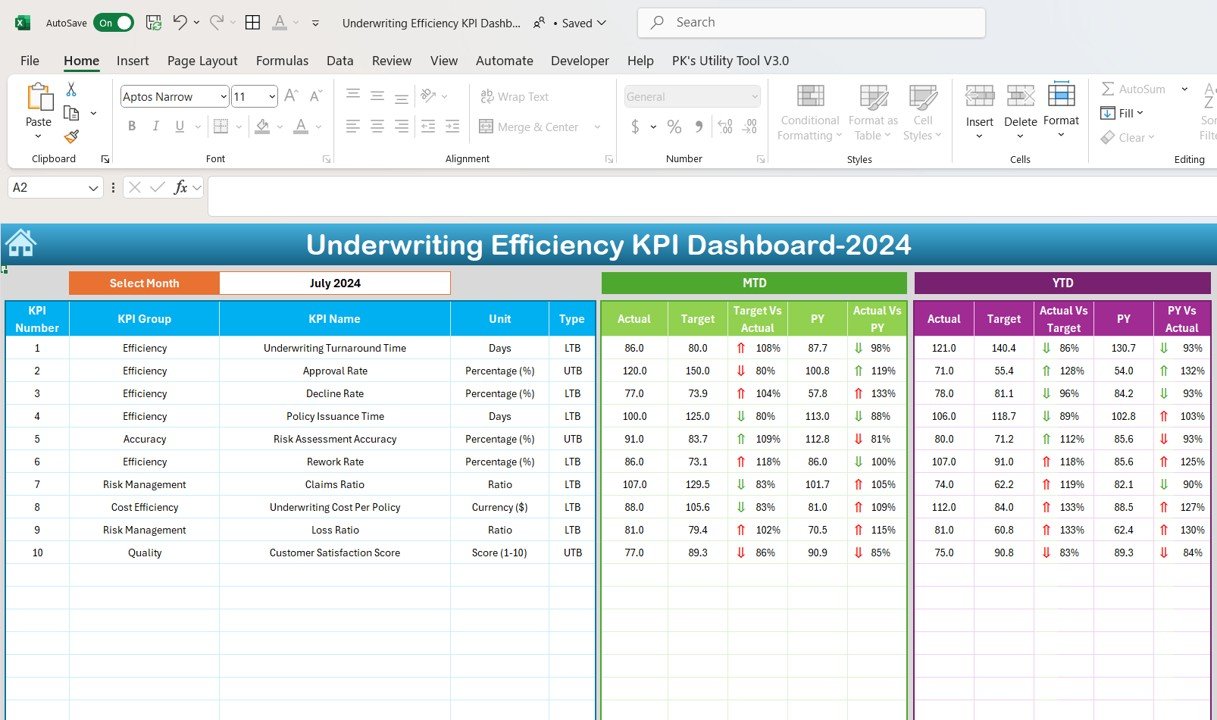
Key Features of the Underwriting Efficiency KPI Dashboard in Excel:
📊 Underwriting Cycle Time Tracking
Monitor the time it takes to process applications from submission to approval, identifying areas where delays can be minimized and efficiency can be improved.
💼 Approval and Decline Rates
Track the approval and decline rates for applications to assess the effectiveness of the underwriting process and ensure that the right decisions are being made.
📅 Volume and Productivity Metrics
Monitor the number of applications processed by underwriters, track productivity levels, and evaluate individual or team performance to ensure efficient workflow.
⚖️ Risk Exposure Monitoring
Track the risk exposure per policy or business line to ensure that your underwriting decisions align with your company’s risk management policies.
💰 Profitability and Loss Ratios
Track loss ratios, premiums written, and claims to evaluate the profitability of underwriting operations and identify trends that may indicate areas of concern.
🚀 Why You’ll Love the Underwriting Efficiency KPI Dashboard in Excel:
✅ Track Underwriting Efficiency – Monitor the time it takes to process applications and identify opportunities to streamline the underwriting process and reduce cycle times.
✅ Evaluate Approval and Decline Rates – Track approval and decline rates to assess the effectiveness of your underwriting decisions and improve risk assessment.
✅ Measure Productivity – Monitor the number of applications processed by underwriters to identify high performers and optimize team productivity.
✅ Track Risk Exposure – Ensure that underwriting decisions are aligned with the company’s risk management policies by tracking risk exposure across various policies.
✅ Ensure Profitability – Track key financial metrics such as loss ratios and premiums written to ensure that underwriting operations contribute to overall profitability.
✅ Fully Customizable and Interactive – Tailor the dashboard to meet the specific needs of your underwriting team, with interactive features for real-time insights and analysis.
What’s Inside the Underwriting Efficiency KPI Dashboard in Excel:
Cycle Time Tracking: Monitor the time taken to process underwriting applications, identify delays, and find ways to improve the speed of approvals.
Approval and Decline Rate Tracking: Track the number of applications approved versus those declined to assess the accuracy and effectiveness of your underwriting decisions.
Productivity Metrics: Measure the number of applications processed per underwriter or team, allowing for performance evaluation and optimization.
Risk Exposure Monitoring: Track the exposure level of each policy or line of business to ensure underwriting decisions adhere to company risk management guidelines.
Profitability and Loss Ratios: Monitor loss ratios, premiums written, and claims to evaluate the profitability of underwriting decisions and adjust strategies accordingly.
Custom Reports: Generate custom reports summarizing key underwriting metrics such as cycle times, approval rates, risk exposure, and profitability to make informed business decisions.
How to Use the Underwriting Efficiency KPI Dashboard in Excel:
1️⃣ Download the Template – Instantly access your Excel file upon purchase.
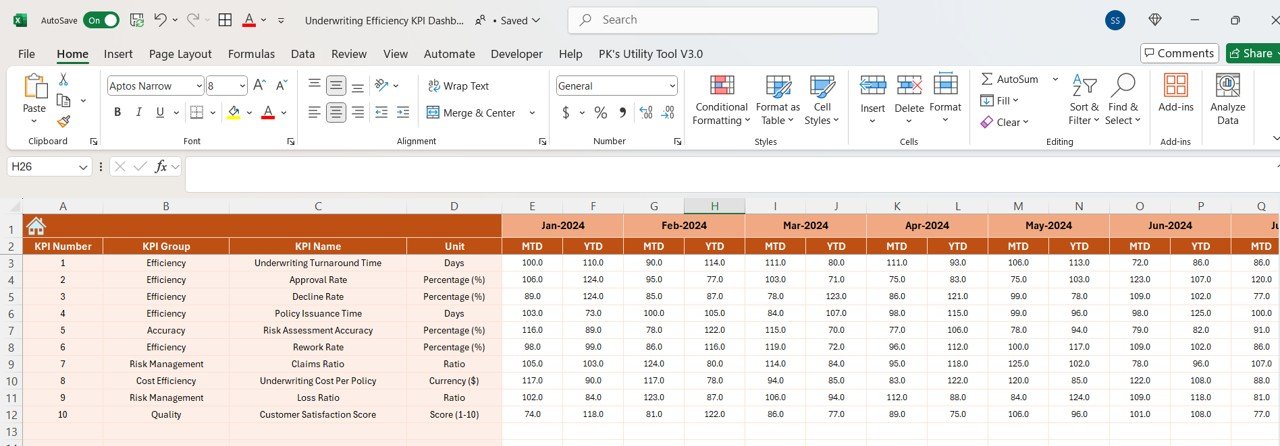
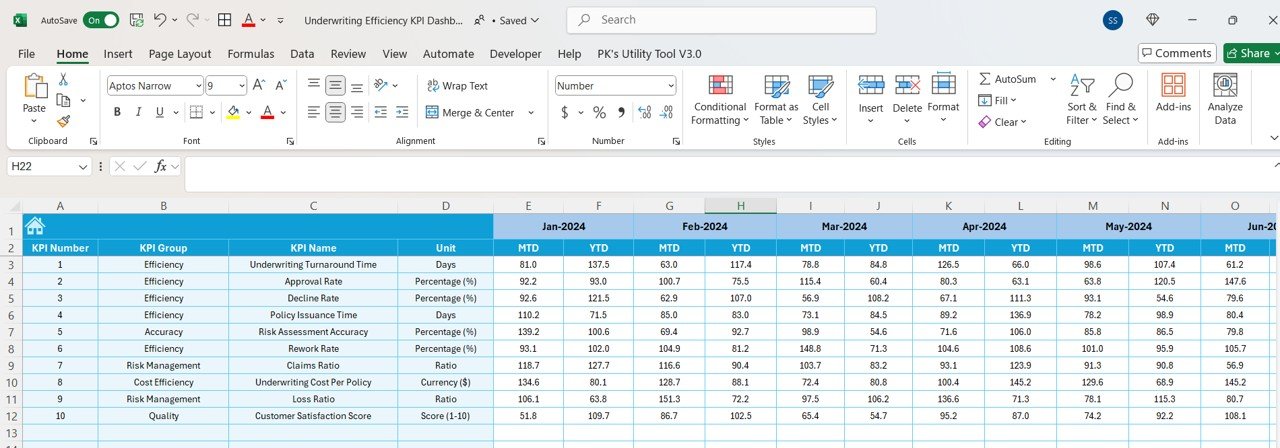
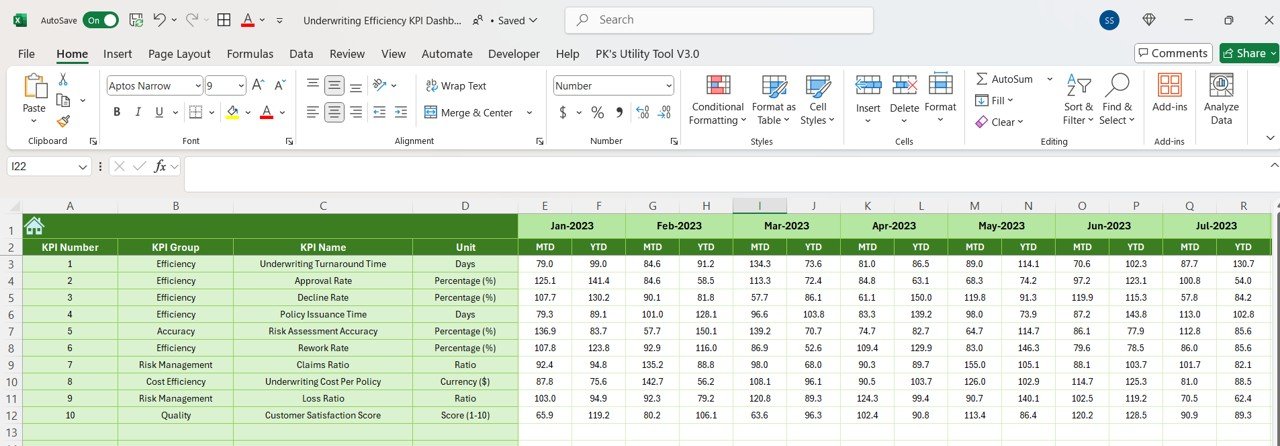
2️⃣ Input Underwriting Data – Enter data such as the number of applications processed, approval/decline rates, and cycle times to begin tracking your KPIs.
3️⃣ Monitor Key Metrics – Use the dashboard to track underwriting efficiency, approval rates, cycle times, and financial performance in real-time.
4️⃣ Evaluate Risk and Profitability – Track risk exposure and monitor loss ratios to ensure your underwriting operations are aligned with the company’s profitability goals.
5️⃣ Generate Reports – Create custom reports to summarize underwriting efficiency, approval rates, and financial performance to guide decision-making and improve operational performance.
Who Can Benefit from the Underwriting Efficiency KPI Dashboard in Excel:
Underwriting Managers
Insurance Company Owners and Executives
Risk Managers
Claims and Operations Teams
Financial Analysts in Insurance
Data Analysts and Business Intelligence Teams
Insurance Underwriters
Insurance Brokers
Actuarial Teams
Compliance and Regulatory Teams
The Underwriting Efficiency KPI Dashboard in Excel is an invaluable tool for optimizing underwriting operations and ensuring that your team is making efficient, profitable, and risk-managed decisions. By tracking cycle times, approval rates, productivity, and financial performance, this dashboard enables you to monitor the health of your underwriting process and make informed decisions that benefit your bottom line.
Click here to read the Detailed blog post
https://www.pk-anexcelexpert.com/underwriting-efficiency-kpi-dashboard-in-excel/
Visit our YouTube channel to learn step-by-step video tutorials
Youtube.com/@PKAnExcelExpert






























Reviews
There are no reviews yet.