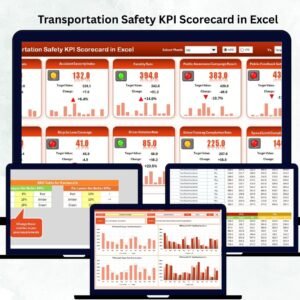
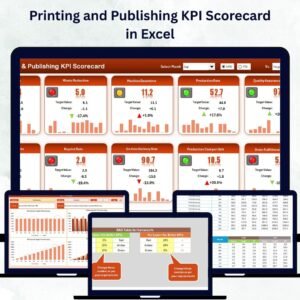
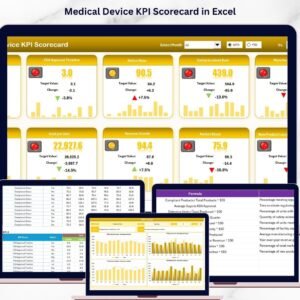
The Transportation Safety KPI Dashboard in Excel is an essential tool for businesses and organizations in the transportation industry that want to monitor and improve safety performance. Whether you manage a fleet of vehicles, oversee logistics, or handle public transportation, this dashboard helps you track key safety indicators such as accident rates, vehicle maintenance, compliance, and driver performance.
This user-friendly Excel template provides real-time tracking of transportation safety metrics, allowing you to identify areas of risk, optimize safety measures, and improve operational efficiency. With this dashboard, you can ensure that your fleet and drivers are adhering to safety standards and regulations, reducing accidents and improving overall safety.
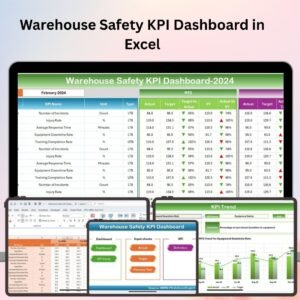
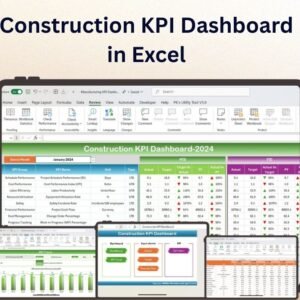
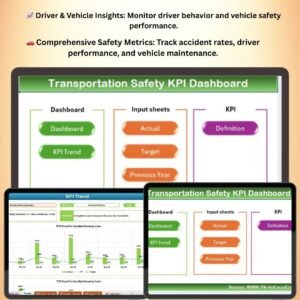
Key Features of the Transportation Safety KPI Dashboard
🚗 Comprehensive Safety Metrics Tracking
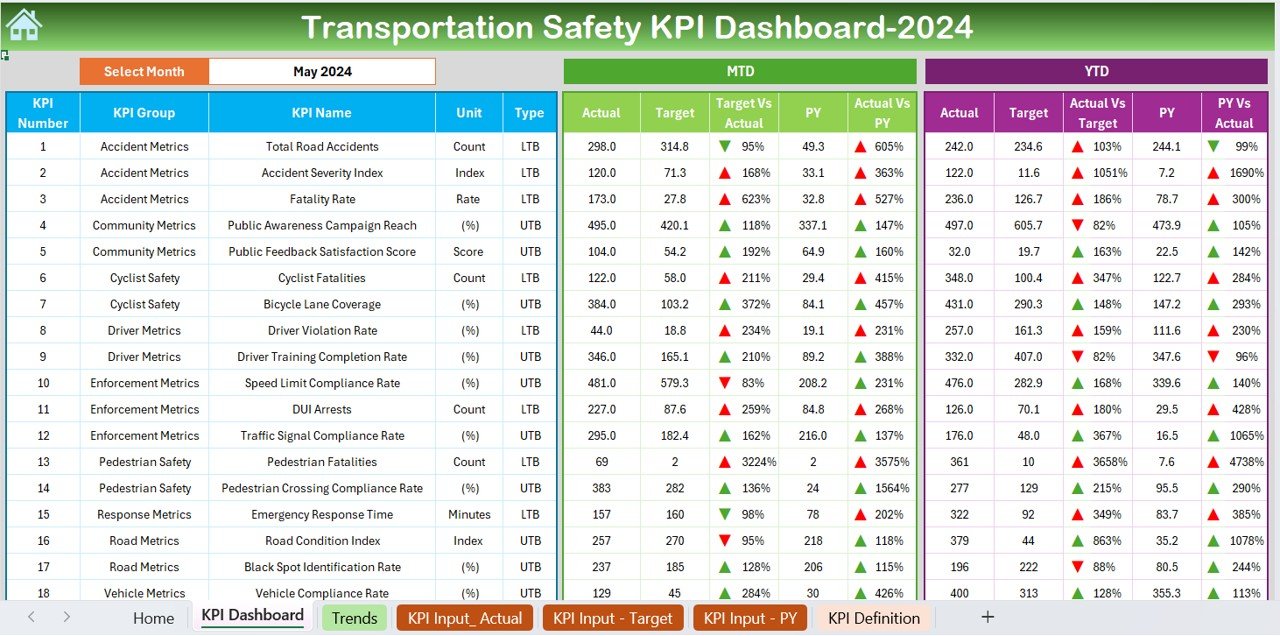
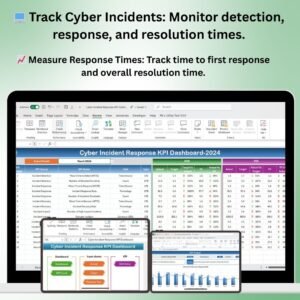
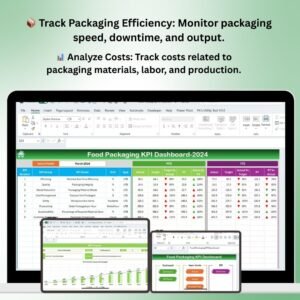
Track critical safety KPIs such as accident frequency, vehicle maintenance schedules, driver performance, compliance with safety regulations, and incident response times. Get a comprehensive overview of your transportation safety performance.
⚡ Real-Time Monitoring of Safety Data
Monitor safety metrics in real-time, enabling you to compare actual performance against safety targets. Adjust strategies promptly to ensure that safety standards are consistently met.
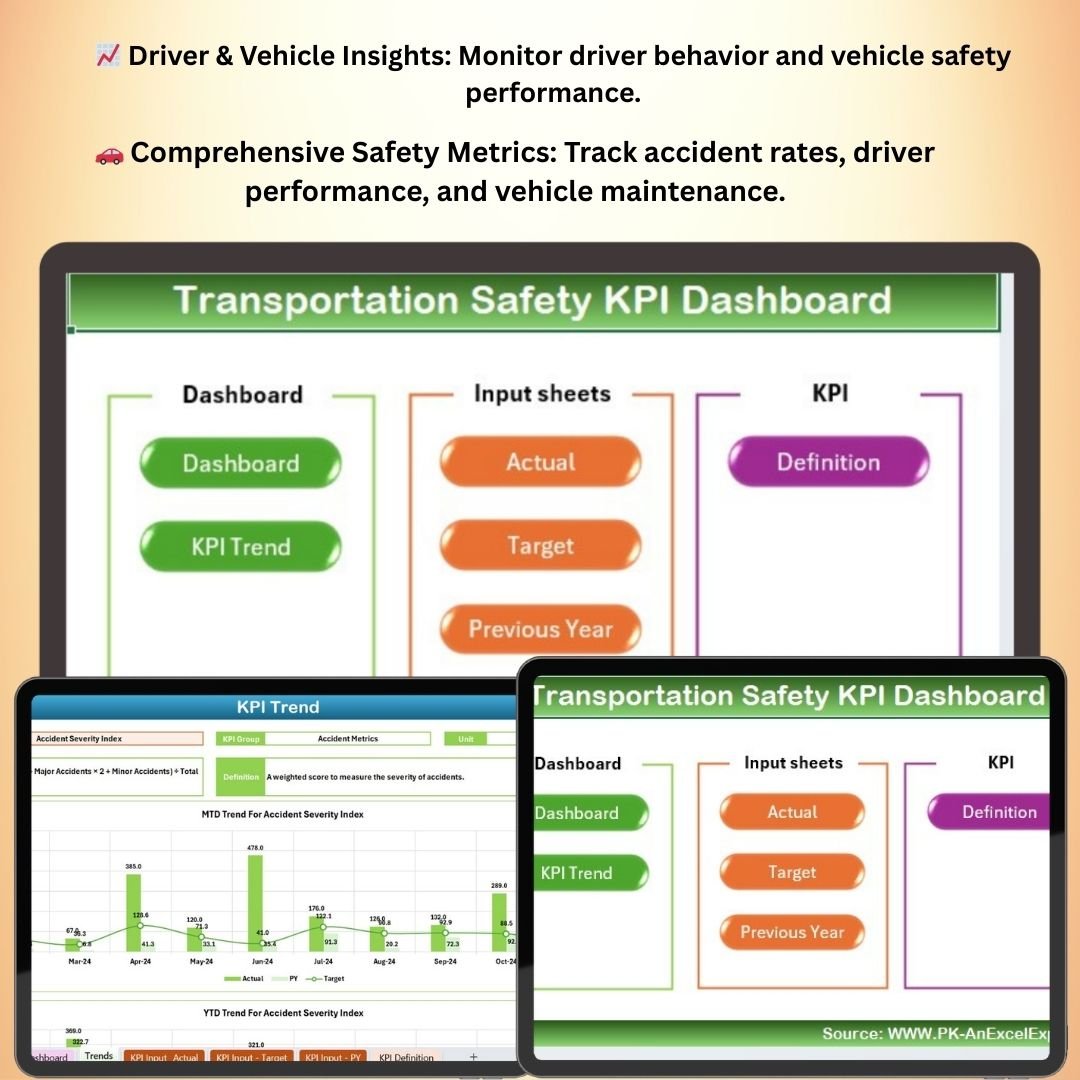
📈 Driver and Vehicle Safety Insights
Track key driver performance metrics like safety violations, training hours, and driving behavior. Monitor vehicle maintenance schedules and performance to minimize breakdowns and ensure safety on the road.
📅 Customizable Safety KPIs
Easily adjust the dashboard to focus on the specific safety metrics that are most relevant to your business or fleet, such as accident severity, fuel efficiency, or route safety.
🖥️ Interactive & User-Friendly Interface
The dashboard is designed to be intuitive and easy to use, with an interactive interface that allows for quick data input, analysis, and visualization. Visualize safety data through interactive charts and graphs for easy decision-making.
Why You’ll Love the Transportation Safety KPI Dashboard
✅ Track Key Transportation Safety Metrics
Monitor important safety indicators such as accident rates, vehicle maintenance, and driver performance to ensure that safety is prioritized across your operations.
✅ Enhance Fleet & Driver Safety
Ensure your drivers are performing safely by tracking metrics such as safety violations, driving behavior, and compliance with safety training. Prevent accidents and improve overall fleet safety.
✅ Optimize Vehicle Maintenance & Compliance
Track vehicle maintenance schedules and compliance with safety regulations to minimize downtime, reduce maintenance costs, and enhance safety.
✅ Make Data-Driven Decisions
Use real-time data and insights to make informed decisions about safety improvements, training programs, and fleet management strategies.
✅ Visualize Safety Data
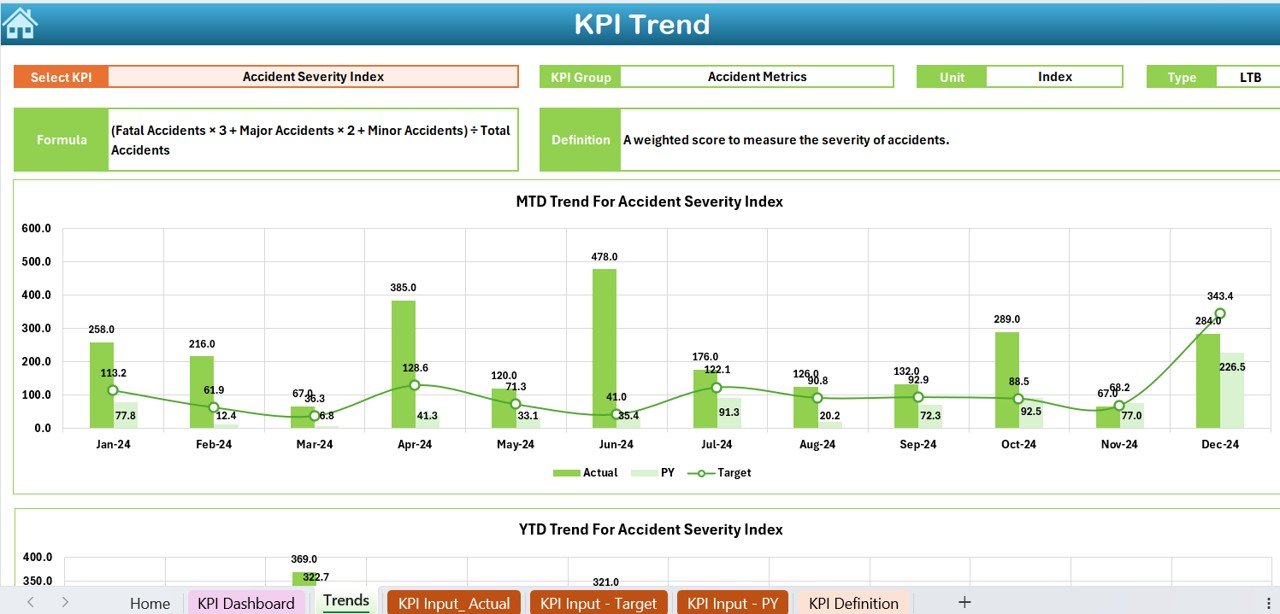
With interactive charts and graphs, quickly visualize safety performance trends, identify areas for improvement, and optimize your safety initiatives.
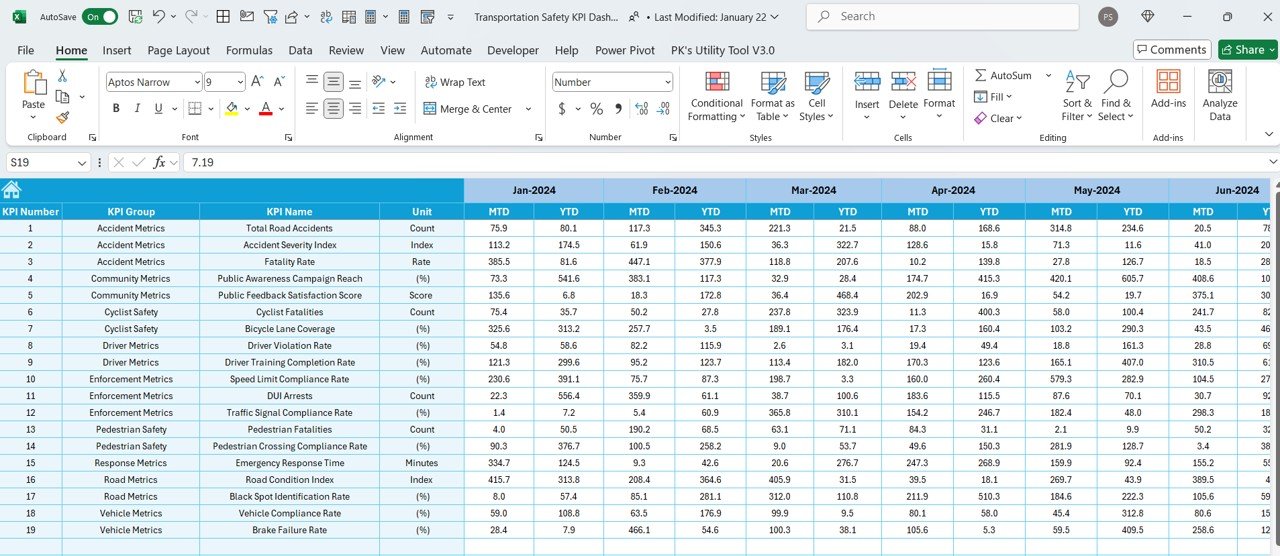
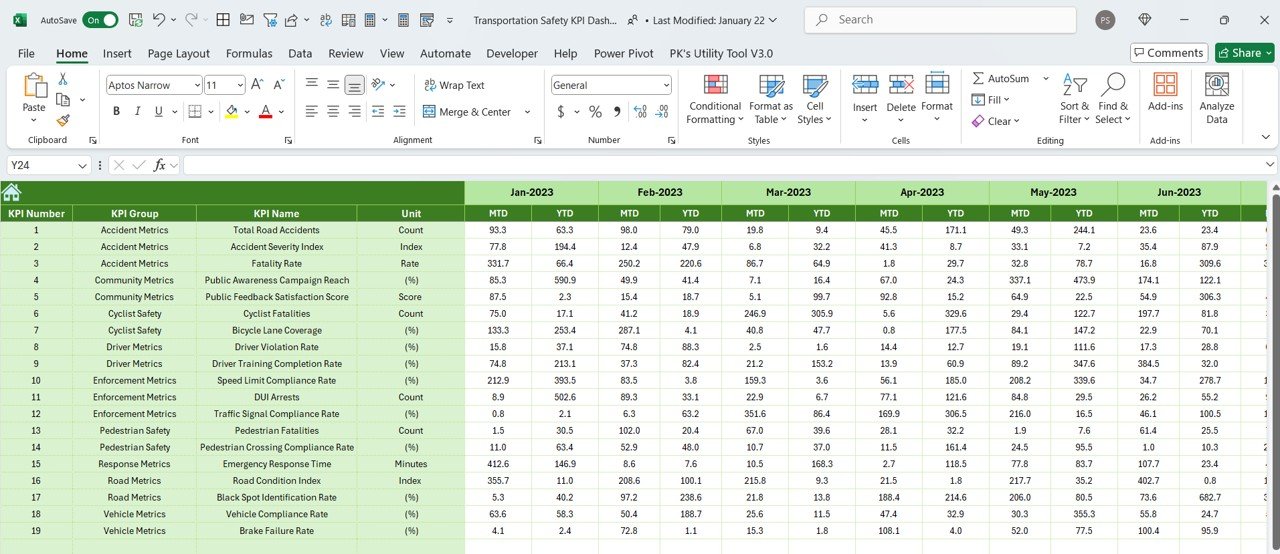
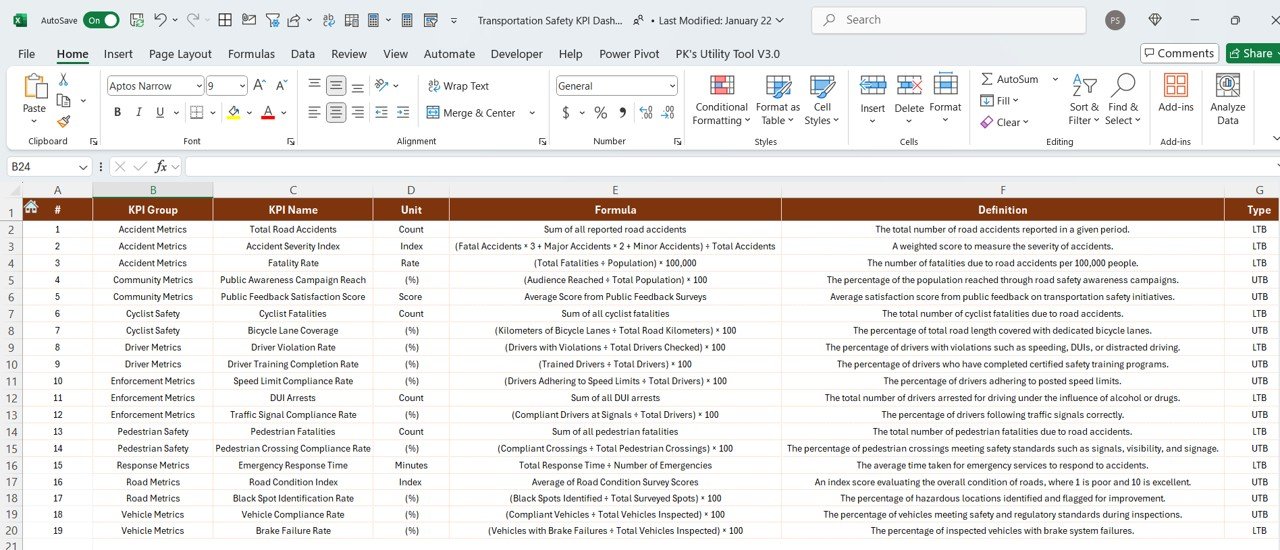
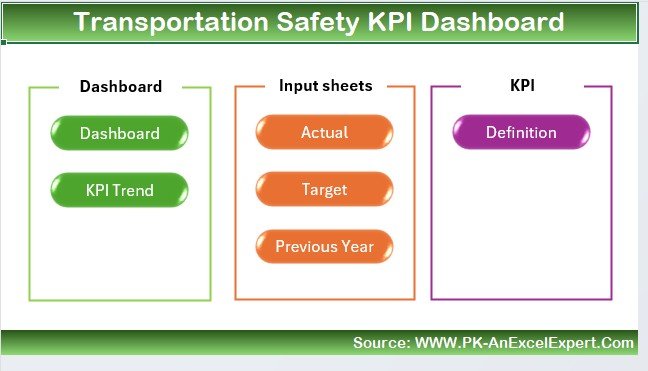
What’s Inside the Transportation Safety KPI Dashboard Template?
- Safety KPI Tracking: Track accident rates, driver safety performance, maintenance schedules, and compliance.
- Driver Performance Insights: Monitor driver behavior, safety violations, and adherence to safety protocols.
- Vehicle Maintenance Monitoring: Keep track of vehicle maintenance schedules and ensure your fleet is in top condition.
- Safety Compliance Metrics: Track your fleet’s compliance with safety regulations and standards.
- Customizable Dashboard: Tailor the dashboard to track safety metrics specific to your fleet or transportation operations.
- Interactive Reporting: Visualize your data with charts and graphs to make quick, data-driven decisions.
How to Use the Transportation Safety KPI Dashboard
1️⃣ Download the Template: Instantly access your Transportation Safety KPI Dashboard.
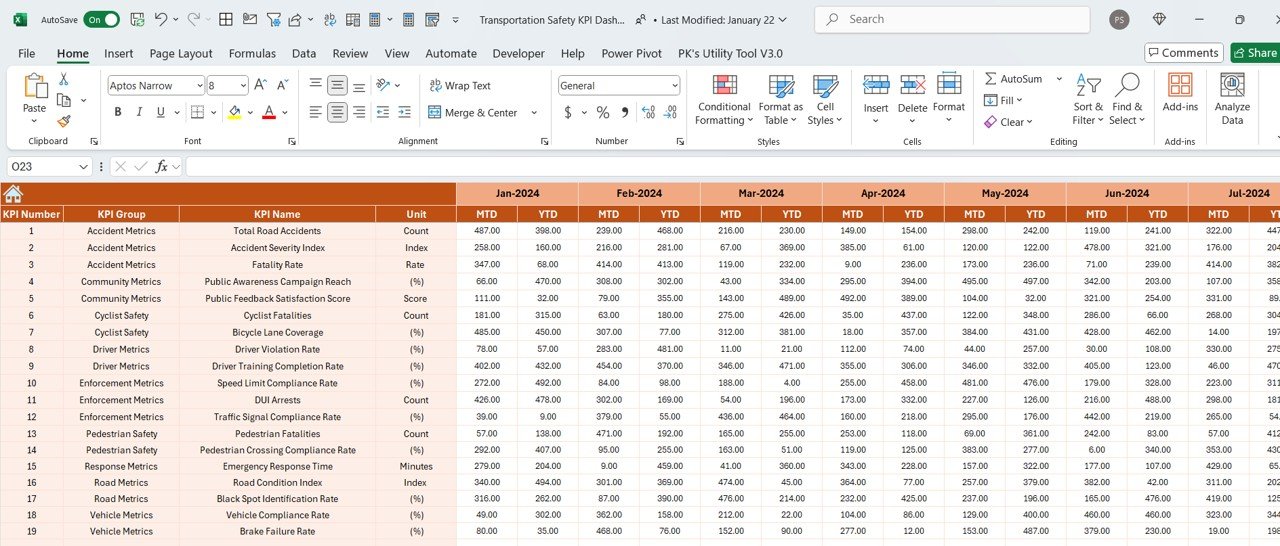
2️⃣ Input Safety Data: Enter data such as accident reports, driver safety metrics, and vehicle maintenance records.
3️⃣ Monitor Safety Performance: Use the dashboard to track and compare safety performance against set targets.
4️⃣ Analyze & Optimize: Use the insights from the dashboard to improve safety protocols, driver training, and fleet maintenance.
Who Can Benefit from the Transportation Safety KPI Dashboard?
🔹 Fleet Managers & Transportation Coordinators
🔹 Logistics and Transportation Companies
🔹 Safety Managers and Compliance Officers
🔹 Public Transportation Authorities
🔹 Companies with a Large Fleet of Vehicles
🔹 Anyone Responsible for Improving Transportation Safety
Track, optimize, and improve the safety performance of your fleet with the Transportation Safety KPI Dashboard in Excel. Stay on top of key safety metrics, reduce accidents, and ensure the safety of your drivers and vehicles.
Click here to read the Detailed blog post
Visit our YouTube channel to learn step-by-step video tutorials
Youtube.com/@PKAnExcelExpert


Reviews
There are no reviews yet.