


The Ride-Sharing KPI Dashboard in Excel is a powerful tool designed for ride-sharing service providers, fleet managers, and business owners who want to track, analyze, and optimize key performance indicators (KPIs) for their operations. This Excel-based dashboard allows you to monitor crucial metrics such as ride volume, driver performance, customer satisfaction, revenue, and efficiency, helping you improve service quality, maximize profitability, and enhance the customer experience.
With real-time tracking, interactive visualizations, and customizable reports, this dashboard provides the insights you need to manage your ride-sharing business more effectively, increase driver productivity, and optimize your operations.

Key Features of the Ride Sharing KPI Dashboard in Excel:
🚗 Ride Volume and Demand Tracking
Track the number of rides completed, ride requests, peak hours, and areas of high demand, helping you optimize fleet allocation and driver availability.
💰 Revenue and Profitability Monitoring
Monitor daily, weekly, or monthly revenues from rides, including tips, cancellations, and discounts, to ensure you’re maximizing profitability.
📊 Driver Performance Metrics
Evaluate key metrics such as average ride completion time, driver ratings, and earnings to monitor individual driver performance and incentivize top performers.
🔄 Customer Satisfaction Tracking
Measure customer satisfaction with ratings, reviews, and feedback to ensure a high-quality customer experience and improve service delivery.
📈 Cost Efficiency and Fleet Utilization
Track costs related to fleet maintenance, fuel, and driver compensation, while also analyzing fleet utilization rates to improve cost efficiency and vehicle management.
🚀 Why You’ll Love the Ride Sharing KPI Dashboard in Excel:
✅ Track Ride Volume and Demand – Monitor ride requests and completed rides across different timeframes and locations to optimize fleet allocation.
✅ Maximize Revenue – Analyze revenues and expenses to ensure that your business remains profitable and efficient.
✅ Optimize Driver Performance – Monitor individual driver metrics, including ratings, completion times, and earnings, to improve performance and incentivize top drivers.
✅ Improve Customer Experience – Use customer satisfaction metrics to ensure that riders are having a positive experience, leading to better retention and ratings.
✅ Customizable and User-Friendly – The Excel dashboard is easy to use and fully customizable to fit your business’s specific needs and performance tracking.
✅ Make Data-Driven Decisions – Use real-time insights to make informed decisions about fleet management, driver incentives, and customer service.
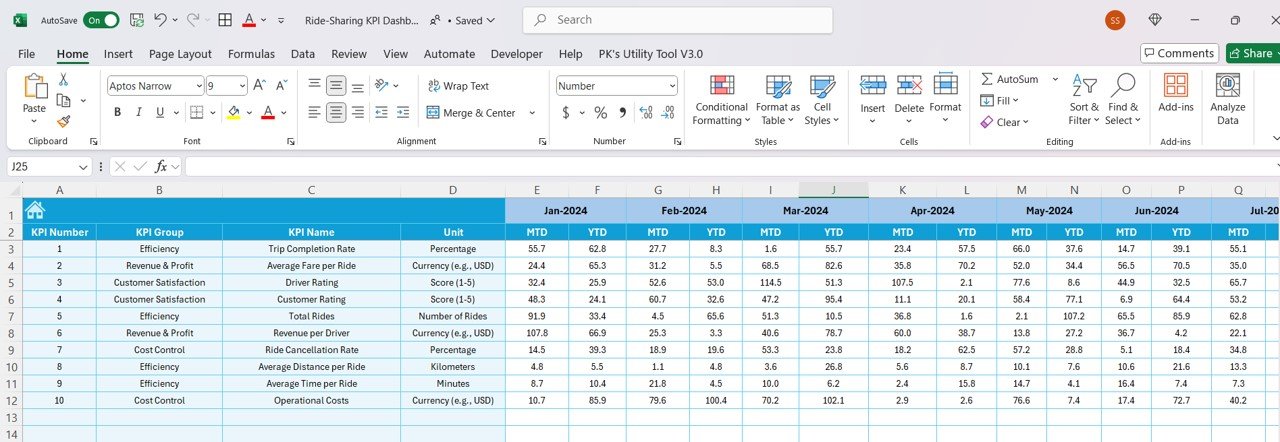
What’s Inside the Ride Sharing KPI Dashboard in Excel:
- Ride Volume Tracking: Monitor the number of rides completed and requested during various time periods to identify trends in demand.
- Revenue and Profitability Monitoring: Track daily, weekly, and monthly revenues from rides, including tips, cancellations, and discounts.
- Driver Performance Metrics: Track individual driver performance, including ride completion time, customer ratings, and earnings to assess performance.
- Customer Satisfaction: Analyze rider feedback, ratings, and reviews to monitor customer satisfaction levels and improve service delivery.
- Fleet Utilization and Cost Tracking: Track fleet usage, maintenance costs, fuel consumption, and other operational expenses to ensure that your fleet is being used efficiently.
- Custom Reports and Dashboards: Create customized reports to provide stakeholders or management with detailed insights into ride-sharing performance.
How to Use the Ride Sharing KPI Dashboard in Excel:
1️⃣ Download the Template – Instantly access your Excel file upon purchase.
2️⃣ Enter Ride Data – Input ride data such as ride requests, completed rides, revenue, and driver performance into the dashboard.
3️⃣ Monitor Key Metrics – Track KPIs like revenue, customer satisfaction, driver performance, and ride volume in real time.
4️⃣ Analyze Trends – Use interactive charts to identify trends in ride volume, peak demand, and other key metrics to optimize your operations.
5️⃣ Generate Reports – Create customized reports to showcase key performance metrics and share them with management or stakeholders.
Who Can Benefit from the Ride Sharing KPI Dashboard in Excel:
- Ride Sharing Service Providers
- Fleet Managers
- Operations Managers
- Business Owners in Ride Sharing
- Data Analysts
- Marketing Teams
- Customer Service Managers
- Finance Teams
The Ride Sharing KPI Dashboard in Excel is the ideal tool for managing your ride-sharing operations. It helps you optimize fleet utilization, track driver performance, improve customer satisfaction, and maximize revenue, all from one easy-to-use Excel dashboard.
Click here to read the Detailed blog post
https://www.pk-anexcelexpert.com/ride-sharing-kpi-dashboard-in-excel/
Visit our YouTube channel to learn step-by-step video tutorials
Youtube.com/@PKAnExcelExpert


Reviews
There are no reviews yet.