


The Compliance Audit KPI Dashboard in Excel is a powerful and customizable tool that provides businesses with an easy way to monitor and track compliance performance. Whether you are managing a regulatory audit, internal compliance process, or risk management plan, this dashboard will keep you on top of your key performance indicators (KPIs) related to compliance audits.
The dashboard provides an intuitive overview of your organization’s compliance efforts, tracking everything from audit findings to corrective actions, compliance rates, and non-compliance incidents. Here’s how it can help you:

📊 What’s Inside the Compliance Audit KPI Dashboard 📊
The Compliance Audit KPI Dashboard is organized into multiple worksheets to make compliance tracking efficient and comprehensive:
-
Home Sheet Tab
-
Quick Navigation: Easily navigate to different sections of the dashboard.
-
Overview: Provides a snapshot of key compliance metrics and quick access to important sheets.
-
-
Dashboard Sheet Tab
-
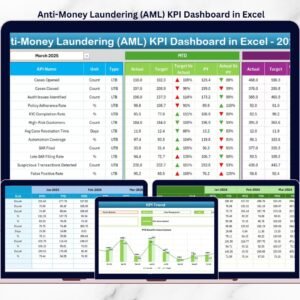
MTD & YTD Tracking: Monitor Month-to-Date (MTD) and Year-to-Date (YTD) performance for each KPI.
-
Conditional Formatting: Visual indicators (up and down arrows) show whether KPIs meet or miss targets.
-
Month Selection Dropdown: Choose a specific month and instantly update the dashboard data.
-
-
KPI Trend Sheet Tab
-
Trend Analysis: Select any KPI and view its trend over time for better insights into performance.
-
KPI Details: Access the formula used to calculate each KPI and its full definition for clarity.
-
-
Actual Numbers Sheet Tab
-
Data Entry: Input actual values for MTD and YTD metrics to track progress.
-
Month Selection: Update the dashboard by entering the first month of the year, automatically adjusting the data.
-
-
Target Sheet Tab
-
Set Targets: Define monthly and YTD targets for each KPI, providing clear benchmarks for your team.
-
-
Previous Year Number Sheet Tab
-
Historical Data: Compare current year data with previous year data to identify trends and improvements.
-
-
KPI Definition Sheet Tab
-
KPI Clarification: Provides the name, group, unit of measurement, and detailed explanation for each KPI.
-
🛠️ How to Use the Compliance Audit KPI Dashboard 🛠️
-
Input Data: Enter your MTD and YTD compliance data in the Actual Numbers Sheet and set your targets in the Target Sheet.
-
Monitor Trends: Use the KPI Trend Sheet to analyze the performance of each KPI over time.
-
Track Compliance Performance: Keep track of your progress through the Dashboard Sheet, which visually represents the data with graphs and trends.
-
Make Informed Decisions: Use the insights from the dashboard to adjust compliance strategies and ensure that all targets are met.
👥 Who Can Benefit from This Compliance Audit KPI Dashboard 👥
-
Compliance Officers: Stay on top of all compliance-related metrics to ensure your organization meets regulations.
-
Auditors: Track audit findings and corrective actions, ensuring that your organization adheres to required standards.
-
Risk Managers: Monitor compliance risks and identify areas where your organization may be exposed to potential risks.
-
Managers: Make data-driven decisions about compliance priorities, corrective actions, and resource allocation.
🚀 Advantages of Using the Compliance Audit KPI Dashboard 🚀
-
Centralized Data: All your compliance KPIs are organized in one place for easy access and management.
-
Real-Time Monitoring: Track performance as it happens, allowing for quick decisions and improvements.
-
Visual Insights: The use of charts and conditional formatting ensures that you can easily interpret complex compliance data.
-
Informed Decision-Making: With real-time data and trend analysis, decision-makers can focus on the most important compliance issues.
-
User-Friendly: No complicated software is needed; the Excel dashboard is easy to use and customize for your specific needs.


Reviews
There are no reviews yet.