


The Autonomous Vehicle KPI Dashboard in Excel is a comprehensive and powerful tool designed to help automotive companies, engineers, and fleet managers track and monitor key performance indicators (KPIs) related to autonomous vehicle operations. This Excel-based dashboard is perfect for anyone working with self-driving technologies, as it helps track performance metrics such as vehicle safety, reliability, system efficiency, and overall fleet performance.
From vehicle testing to real-world deployment, this KPI dashboard ensures that all aspects of autonomous vehicle performance are continuously monitored and optimized. It provides a central hub for tracking important metrics like sensor data accuracy, vehicle uptime, incident reports, and autonomous decision-making processes, enabling data-driven decision-making and improving the safety and efficiency of autonomous fleets.’

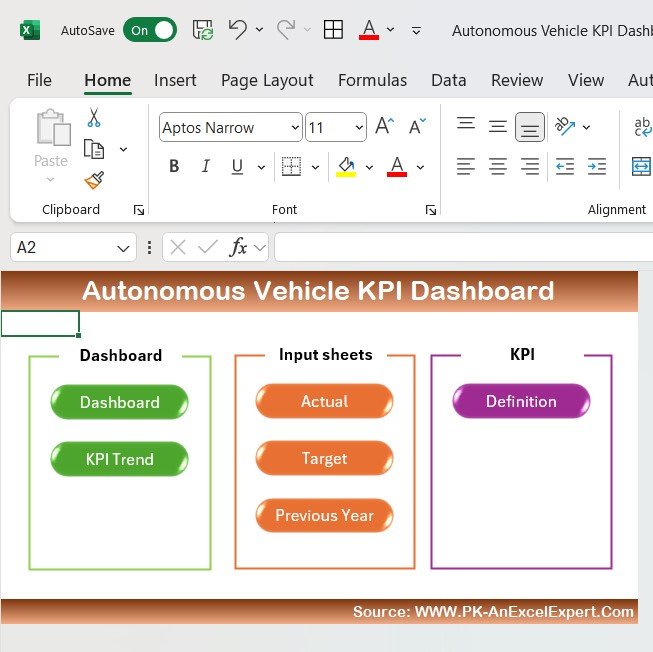
Key Features of the Autonomous Vehicle KPI Dashboard in Excel
📊 Comprehensive KPI Tracking
Monitor essential metrics such as vehicle uptime, system errors, incident rates, safety measures, and sensor accuracy. Keep track of how well autonomous vehicles are performing across different tests and environments.
🚗 Vehicle Performance Metrics
Track the performance of individual autonomous vehicles in the fleet. Monitor key metrics such as speed, fuel efficiency, and sensor performance to ensure optimal operation at all times.
🔍 Safety Monitoring & Incident Reporting
Stay on top of safety measures by tracking incidents, near-misses, and system failures. Record incident data and track resolution progress, ensuring that safety improvements are implemented.
⏱ Real-Time Performance Data
Get real-time updates on the status of your autonomous vehicles. This includes monitoring battery levels, system health, and the status of different vehicle components to ensure smooth operation.
⚙️ Efficiency Monitoring
Monitor the operational efficiency of each vehicle. Track how well autonomous vehicles perform in terms of fuel consumption, speed, and route optimization to improve overall fleet performance.
📈 Customizable Reporting
Generate detailed reports and data visualizations to assess performance trends, identify areas for improvement, and make data-driven decisions. Customize the dashboard to reflect the most important KPIs for your organization.
Why You’ll Love the Autonomous Vehicle KPI Dashboard in Excel
✅ Real-Time Monitoring & Insights
Track and manage performance metrics in real-time to ensure that each vehicle operates at peak efficiency and safety.
✅ Optimize Fleet Performance
By tracking KPIs such as fuel efficiency, speed, and system health, the dashboard helps you optimize autonomous vehicle performance and ensure the vehicles are running smoothly.
✅ Improve Safety Protocols
Monitor incidents and failures to identify patterns and areas where safety measures need to be improved. This helps reduce risk and improve the overall safety of autonomous vehicle systems.
✅ Data-Driven Decision Making
Leverage the data gathered through the dashboard to make informed decisions that optimize vehicle performance, reduce costs, and improve operational efficiency.
✅ Customizable for Your Needs
Tailor the dashboard to suit the specific needs of your autonomous vehicle fleet, adding relevant KPIs, adjusting reporting formats, and more.
What’s Inside the Autonomous Vehicle KPI Dashboard in Excel?
- Comprehensive KPI Tracking: Monitor vehicle uptime, sensor accuracy, system performance, and more.
- Vehicle Performance Metrics: Track key performance data such as speed, fuel efficiency, and reliability.
- Safety Monitoring & Incident Tracking: Monitor and record incidents, near-misses, and failures for better safety management.
- Real-Time Performance Monitoring: Get up-to-date data on system health, battery levels, and sensor data.
- Efficiency Metrics: Track operational efficiency to optimize fuel consumption, speed, and route planning.
- Customizable Reporting: Generate reports and visualizations to help you analyze data and identify areas for improvement.
How to Use the Autonomous Vehicle KPI Dashboard in Excel
1️⃣ Download the Template: Get instant access to the Autonomous Vehicle KPI Dashboard in Excel.
2️⃣ Input Vehicle Data: Add data on vehicle performance, sensor readings, and incidents.
3️⃣ Track Safety & System Health: Use the dashboard to monitor key safety metrics and ensure the vehicle systems are performing correctly.
4️⃣ Analyze Trends & Performance: Review trends in vehicle efficiency, incident rates, and sensor accuracy to optimize performance.
5️⃣ Generate Reports: Customize the dashboard to generate reports and insights on the fleet’s overall performance and safety.
Who Can Benefit from the Autonomous Vehicle KPI Dashboard in Excel?
🔹 Automotive Engineers & Technicians
🔹 Autonomous Vehicle Fleet Managers
🔹 R&D Teams in Autonomous Vehicle Development
🔹 Vehicle Safety & Compliance Managers
🔹 Fleet Management Teams
🔹 Companies Implementing Autonomous Driving Technologies
🔹 Researchers & Developers in Autonomous Vehicle Industry
Ensure your autonomous vehicles are running safely, efficiently, and effectively with the Autonomous Vehicle KPI Dashboard in Excel. Track key metrics, optimize fleet performance, and improve safety across your autonomous vehicle fleet.
Click here to read the Detailed blog post
Visit our YouTube channel to learn step-by-step video tutorials
Youtube.com/@PKAnExcelExpert


Reviews
There are no reviews yet.