
The biotechnology industry operates in a highly data-intensive environment where research progress, laboratory efficiency, regulatory compliance, and financial performance must be monitored simultaneously. However, many biotech organizations still rely on disconnected spreadsheets and manual reporting systems, which often lead to delayed insights and poor visibility.
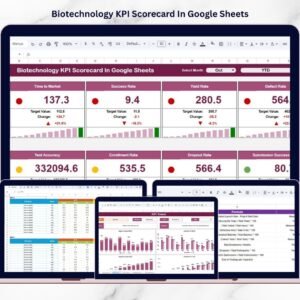
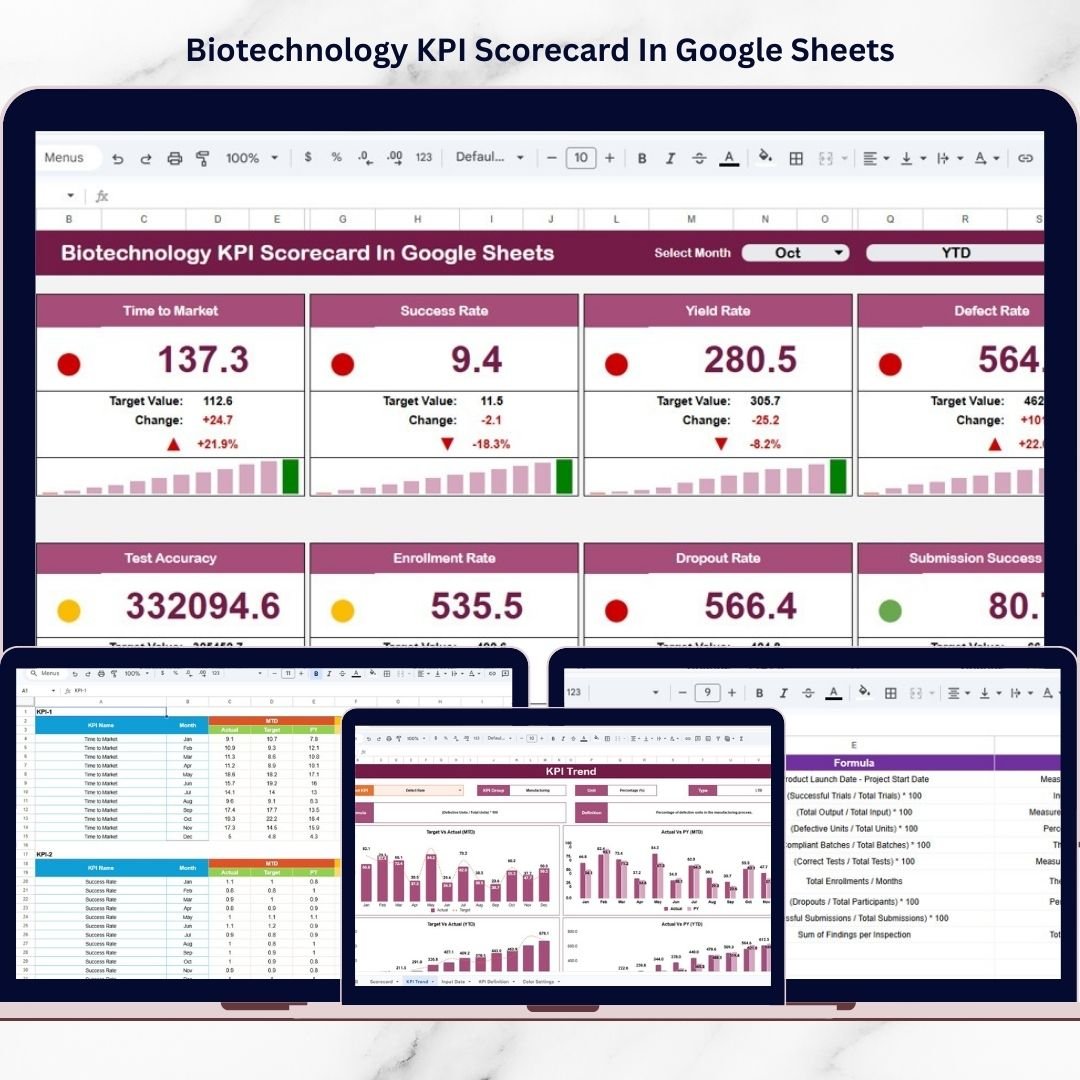
The Biotechnology KPI Scorecard in Google Sheets provides a structured and automated solution to track performance using measurable KPIs, visual indicators, and centralized analytics. Instead of reviewing lengthy reports, teams can evaluate operational performance through a clear monthly and yearly scorecard designed for faster decision-making.
This ready-to-use template helps biotechnology organizations transform complex operational data into actionable insights — all within a collaborative cloud environment.
⭐ Key Features of Biotechnology KPI Scorecard in Google Sheets
📊 Centralized KPI Monitoring
Track multiple biotechnology performance indicators in one structured scorecard.
📅 Dynamic Month Selection
Choose a reporting month using a dropdown and instantly update dashboard results.
🚦 Traffic Light Performance Indicators
Green, Yellow, and Red signals clearly show KPI performance status.
📈 MTD & YTD Analysis
Monitor both short-term and long-term organizational performance.
🔄 Automated Calculations
Dashboard updates automatically after data entry.
📉 Trend Analysis for KPIs
Analyze performance movement and percentage changes over time.
🤝 Cloud Collaboration
Teams update and review KPIs together in real time using Google Sheets.
📂 What’s Inside the Biotechnology KPI Scorecard
The template includes multiple worksheets designed for structured KPI tracking.
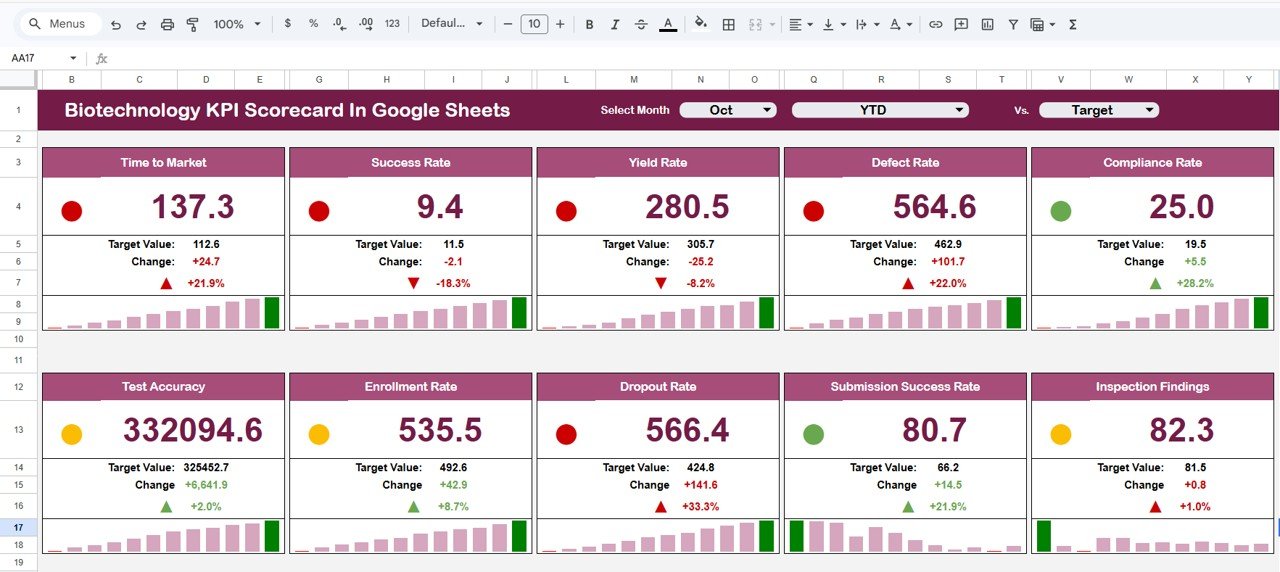
1️⃣ Scorecard Dashboard – Monthly & Yearly Overview
The main performance control center displaying:
Month dropdown selector
MTD (Month-To-Date) performance
YTD (Year-To-Date) performance
Traffic light indicators
Performance trend arrows
Because visuals update automatically, users instantly understand organizational performance.
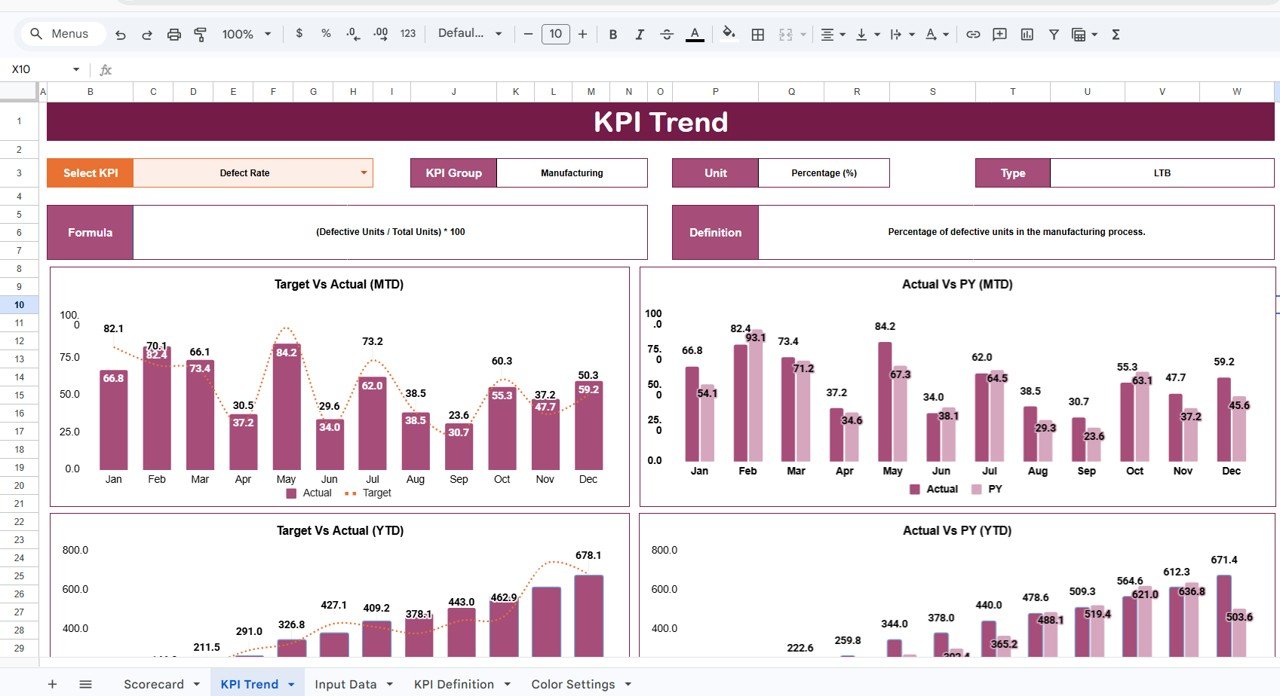
2️⃣ KPI Trend Sheet – Detailed KPI Analysis
Select a KPI (Cell C3) to view:
KPI Group
KPI Unit
KPI Type (LTB / UTB)
Performance direction
Trend comparison
This ensures KPI transparency across departments.
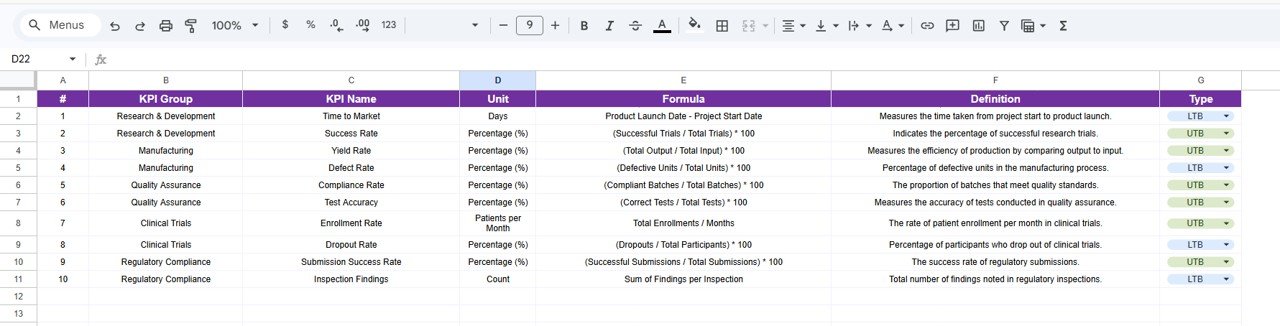
3️⃣ KPI Definition Sheet – KPI Documentation Center
A centralized reference including:
KPI Name
KPI Group
Unit of Measurement
KPI Formula
KPI Definition
Helps maintain consistent performance measurement standards.
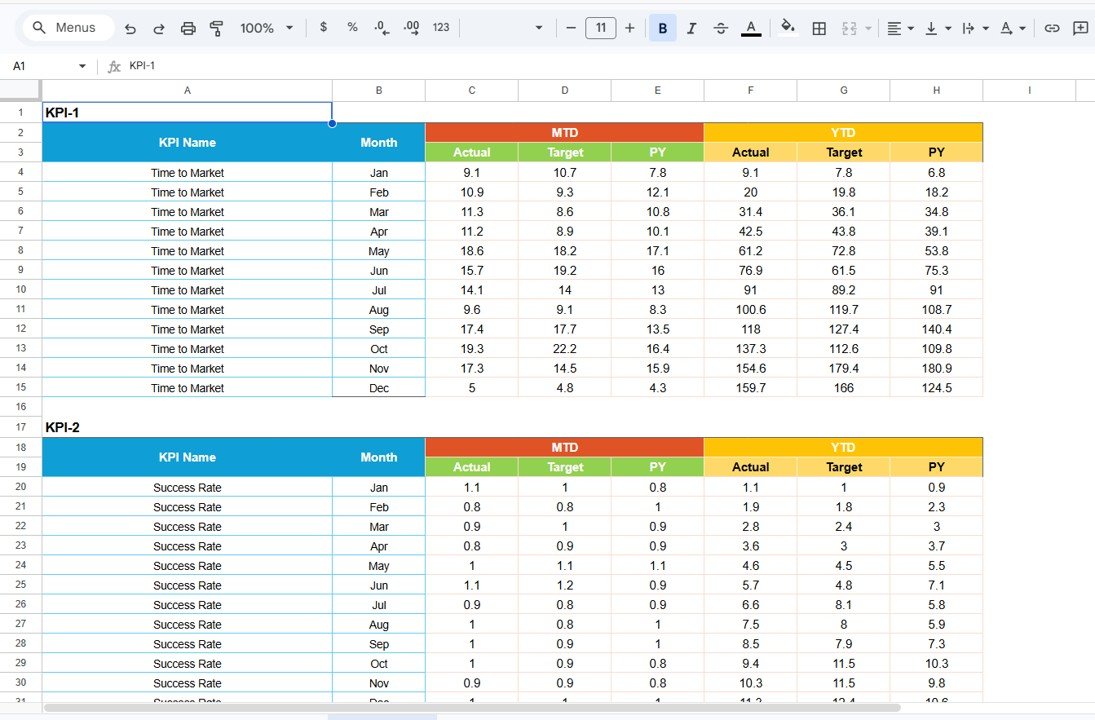
4️⃣ Data Input Sheet – Performance Data Entry
Simple and structured data entry:
Enter monthly KPI values
Update actual performance numbers
Dashboard refreshes automatically
Minimizes manual reporting errors.
5️⃣ Colour Settings – Visual Performance Signals
Built-in visual indicators include:
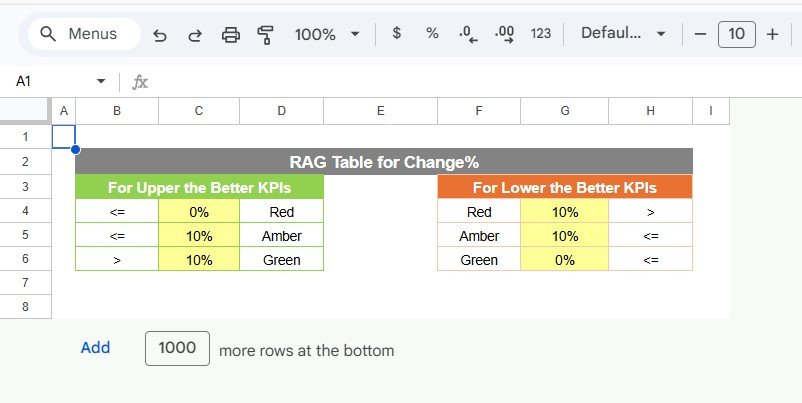
🟢 Green → Strong performance
🟡 Yellow → Needs attention
🔴 Red → Requires improvement
⬆️ Improvement indicator
⬇️ Performance decline indicator
These visuals allow quick performance evaluation without deep analysis.
📊 KPIs You Can Track
The scorecard tracks 10 customizable KPIs, typically covering:
Research Progress Metrics
Laboratory Efficiency
Compliance Performance
Operational Productivity
Quality Indicators
Financial Performance Metrics
Organizations can easily modify KPIs according to research or operational goals.
🚀 Advantages of Biotechnology KPI Scorecard in Google Sheets
✅ Centralized performance monitoring
✅ Automated KPI calculations
✅ Easy collaboration across teams
✅ Visual performance evaluation
✅ Monthly and yearly comparisons
✅ Flexible KPI customization
✅ Cost-effective analytics solution
💡 Best Practices for Using the KPI Scorecard
Define clear KPI objectives aligned with strategy
Update KPI data regularly
Maintain consistent measurement units
Review KPIs monthly
Train teams on KPI interpretation
Monitor trends instead of isolated numbers
Ensure accurate data entry
Following these practices ensures reliable performance insights.
☁️ Why Google Sheets Is Ideal for KPI Scorecards
Google Sheets offers powerful advantages:
Cloud-based accessibility
Real-time collaboration
Automatic saving
Easy sharing and permissions
Flexible customization
No additional software cost
Therefore, biotechnology teams can implement analytics quickly without complex systems.
🎯 Who Can Benefit from This Scorecard?
This template is ideal for:
Biotechnology Companies
Research Laboratories
Pharmaceutical R&D Teams
Clinical Research Organizations
Lab Operations Managers
Strategy & Performance Analysts
🏁 Conclusion
The Biotechnology KPI Scorecard in Google Sheets provides a structured and efficient way to monitor biotechnology performance using measurable KPIs and automated analytics. Instead of relying on scattered reports, organizations gain centralized visibility into operational and strategic performance.
With traffic light indicators, trend analysis, and collaborative access, teams can evaluate progress faster, improve accountability, and make data-driven decisions confidently.
Ultimately, organizations that consistently measure performance achieve stronger research outcomes, operational efficiency, and sustainable growth.
### Click hare to read the Detailed blog post
Watch the step-by-step video tutorial:
Visit our YouTube channel to learn step-by-step video tutorials
👉 Youtube.com/@NeotechNavigators
Compatibility and Requirements
- Works in Google Sheets. You need a free Google account and a web browser.
- You choose the reporting month from a dropdown on the Scorecard Dashboard, and you pick a KPI from the cell C3 selector on the KPI Trend sheet. Google explains dropdowns in Create an in-cell dropdown list.
Frequently Asked Questions
Which sheets are included?
Five sheets: Scorecard Dashboard, KPI Trend, KPI Definition, Data Input and Colour Settings.
How many KPIs can I track?
The scorecard tracks 10 customizable KPIs. You can change them to match your research or operational goals.
How do I update the scorecard?
Enter your monthly KPI values on the Data Input sheet. The Scorecard Dashboard then updates automatically, and you select the month from the dropdown.
What do the colors and arrows mean?
Green shows strong performance, yellow means the KPI needs attention and red means it requires improvement. An up arrow marks an improvement and a down arrow marks a decline.
Can I see MTD and YTD results?
Yes. The Scorecard Dashboard shows Month-To-Date and Year-To-Date performance for the month you select.
Is there an Excel version?
Yes. See the Biotechnology KPI Scorecard in Excel.
Related KPI Scorecard Templates
- Biotechnology KPI Scorecard in Excel: the same scorecard for Excel
- Manufacturing KPI Scorecard in Google Sheets: a Google Sheets scorecard for production teams
- HR KPI Scorecard in Google Sheets: a Google Sheets scorecard for HR metrics
- Healthcare KPI Scorecard in Excel: a scorecard for healthcare organizations
- KPI Scorecard Mega Pack: 12 scorecard templates in one download
Browse all Google Sheets KPI dashboards.