
Running a theater involves far more than selling tickets. From managing audience engagement and show schedules to optimizing revenue and costs, success depends on monitoring the right metrics at the right time. The Theater Management KPI Dashboard in Google Sheets is a ready-to-use tool designed to give theater managers and decision-makers a complete, real-time view of their operations. 🎭📊
This interactive dashboard consolidates performance data into clear visuals, making it easy to track ticket sales, occupancy, customer satisfaction, and expenses. By comparing actuals with targets and previous years, you can quickly identify trends, highlight problem areas, and take data-driven actions to improve both profitability and audience experience.
🔑 Key Features of Theater Management KPI Dashboard in Google Sheets
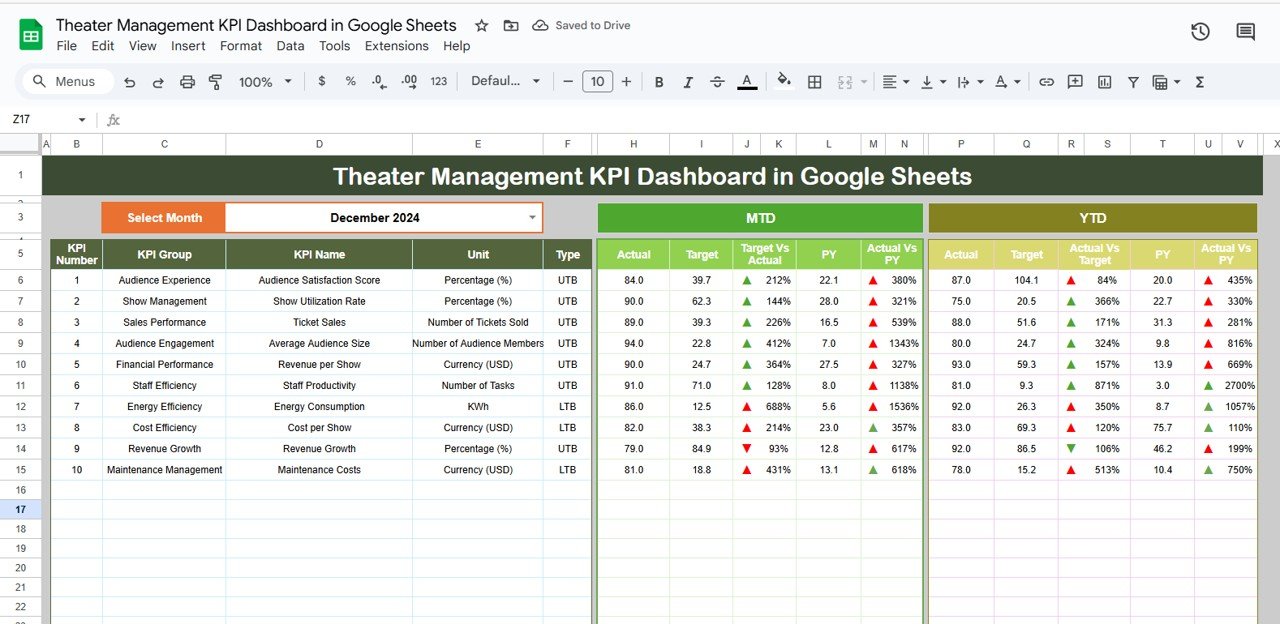
📋 Dashboard Sheet (High-Level Overview)
-
Month selection dropdown to filter KPIs dynamically.
-
Cards for MTD and YTD Metrics – Actual, Target, and Previous Year.
-
Conditional formatting with arrows for quick performance insights.
-
A single page view of all critical theater operations.
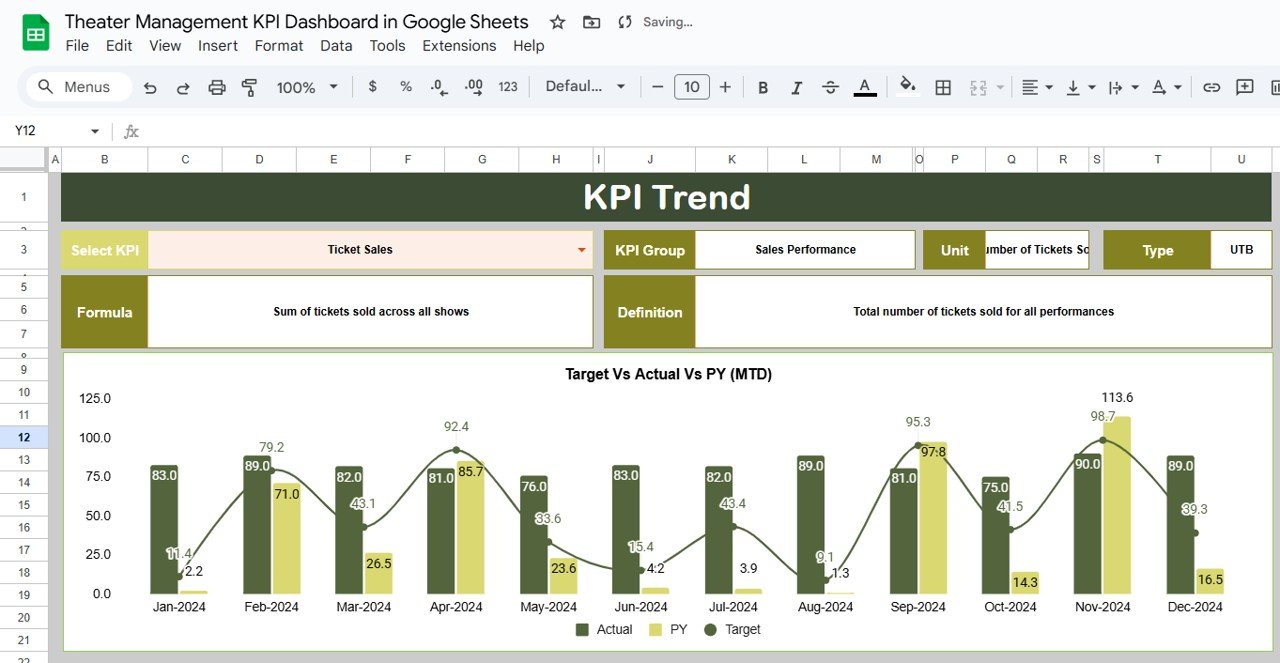
📈 KPI Trend Sheet
-
Choose any KPI from a dropdown to analyze trends.
-
Displays KPI Group, Unit, Type (Upper-the-Better or Lower-the-Better).
-
Includes KPI definition and formula for transparency.
-
Charts show month-to-month improvements or declines.
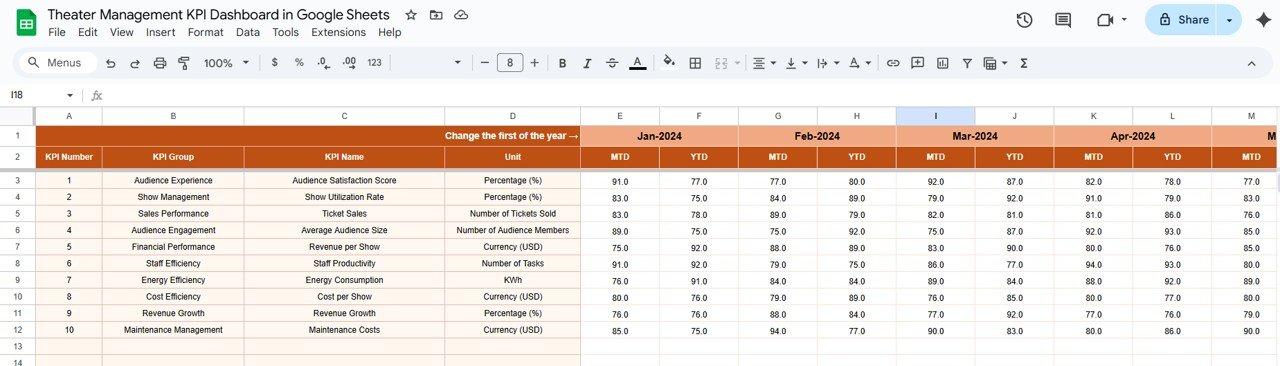
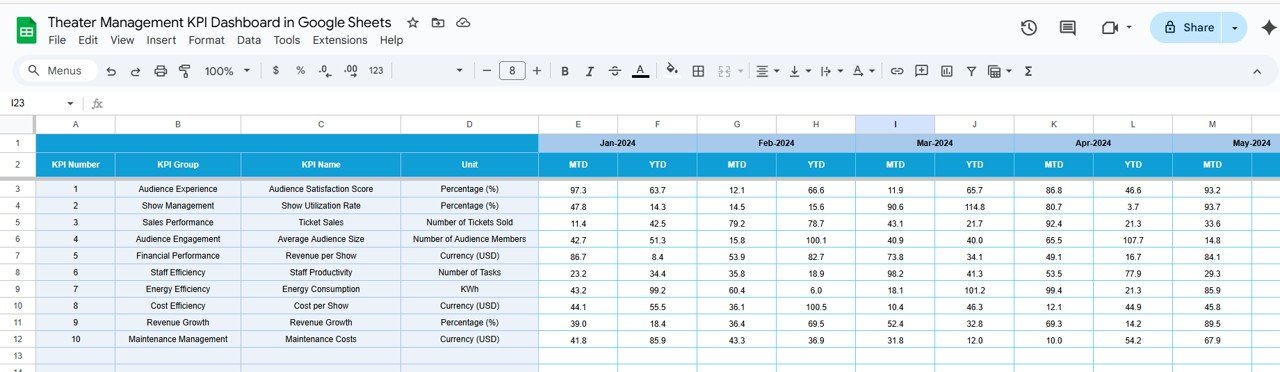
🧾 Actual Numbers Sheet
-
Enter actual MTD and YTD values per KPI.
-
Auto-adjusts when the first month of the year is updated.
-
Accurate, consistent reporting made simple.
🎯 Target Sheet
-
Define monthly and yearly targets.
-
Compare targets vs. actuals to measure success.
-
Highlight gaps early to make timely adjustments.
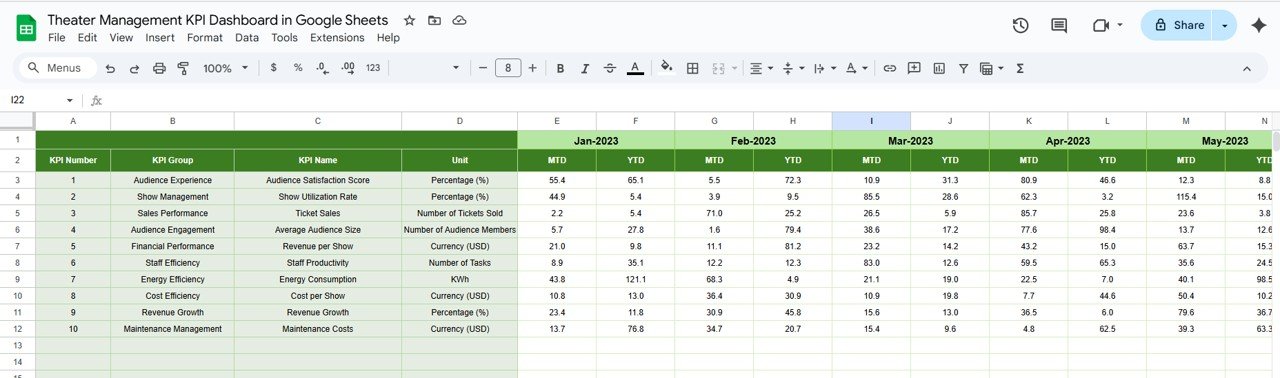
📊 Previous Year Numbers Sheet
-
Store last year’s performance metrics.
-
Enables powerful year-over-year comparisons.
-
Essential for spotting seasonal patterns and growth.
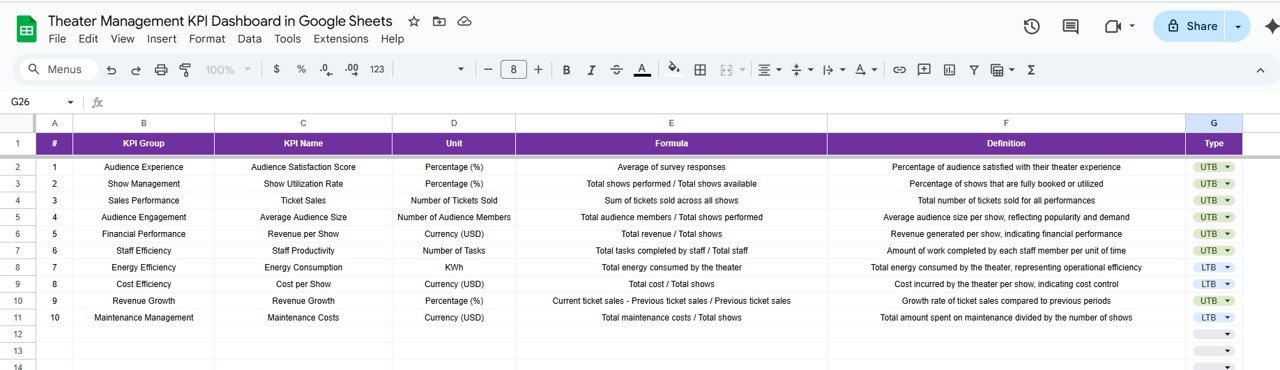
📘 KPI Definition Sheet
-
Reference guide listing each KPI’s name, group, unit, formula, and type.
-
Ensures standardization and clarity across all team members.
📦 What’s Inside the Dashboard?
✅ 6 Interactive Tabs – Dashboard, KPI Trend, Actuals, Targets, Previous Year, KPI Definitions
✅ Pre-Built Formulas – Automated MTD & YTD calculations
✅ Sample Data – Preloaded to help you get started instantly
✅ Dynamic Visuals – Conditional formatting and trend charts
✅ Customizable Layout – Add/remove KPIs as needed
🎯 Who Can Benefit from This Dashboard?
🎭 Theater Managers – Gain visibility into revenue, occupancy, and satisfaction.
📊 Operations Teams – Monitor performance across shows and departments.
💼 Executives & Owners – Evaluate profitability and long-term trends.
🎟️ Marketing Teams – Track campaign effectiveness and audience demographics.
🏢 Multi-Theater Chains – Replicate dashboards for multiple locations.
🧠 How to Use the Theater Management KPI Dashboard
-
Enter survey and ticketing data in the Actual Numbers Tab.
-
Define monthly and annual targets in the Target Tab.
-
Add previous year’s metrics in the Previous Year Tab.
-
Use the Dashboard Tab for high-level insights.
-
Explore the KPI Trend Tab to analyze trends over time.
-
Refer to the KPI Definition Tab for clarity on formulas and performance types.
No advanced technical skills required — just plug in your data and start analyzing. ✅
🎭 Examples of Theater KPIs
-
🎟️ Ticket Sales ($) – Total revenue from bookings
-
👥 Audience Attendance (%) – Seats filled vs. total capacity
-
🏛️ Show Occupancy Rate – Occupancy performance across shows
-
💵 Revenue per Show ($) – Profitability of each performance
-
🌟 Customer Satisfaction Score – Ratings from audience feedback
-
💸 Operational Costs ($) – Expenses per show/month
-
📣 Marketing Campaign Effectiveness (%) – Conversion from promotions
Each KPI includes unit of measure, formula, and performance type (UTB/LTB) for easy interpretation.
🚀 Advantages of Using This Dashboard
-
Centralized Data – All performance metrics in one Google Sheet.
-
Real-Time Updates – Instant recalculations with every entry.
-
Trend Analysis – Compare MTD, YTD, and previous year.
-
Target Tracking – Spot gaps between goals and results quickly.
-
Customizable – Adapt KPIs and layouts to fit your theater.
-
Data-Driven Insights – Support strategic decisions with accurate reporting.
🔗 Click here to read the Detailed blog post
Watch the step-by-step video Demo:


Reviews
There are no reviews yet.