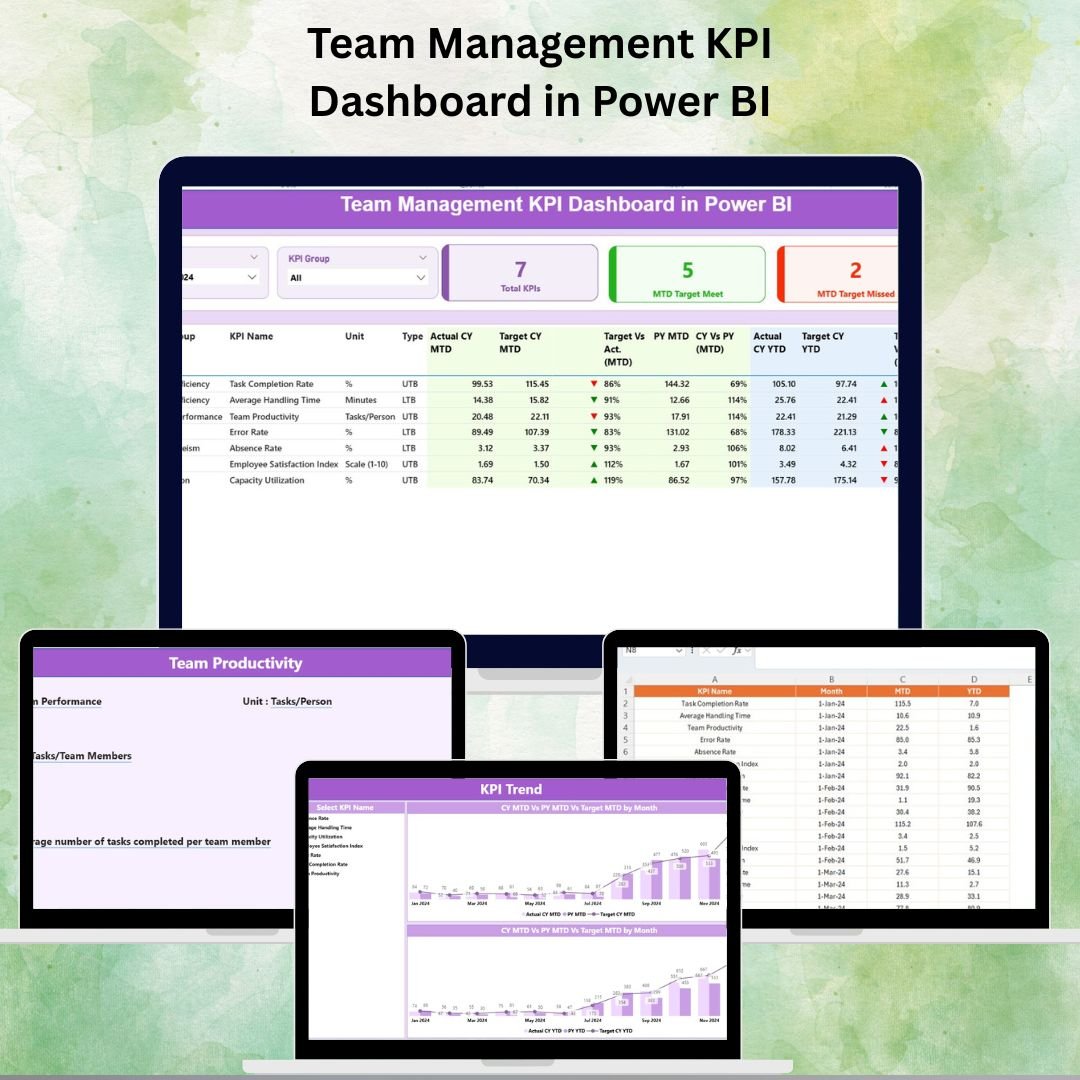
📊 Team Management KPI Dashboard in Power BI
Team performance directly impacts the success of any organization — and the only way to improve performance is to measure it accurately. When managers rely on fragmented spreadsheets and manual reports, they risk delayed decisions and limited visibility. That’s why the Team Management KPI Dashboard in Power BI is an essential tool for modern business operations.
This ready-to-use dashboard pulls data from a simple Excel file and transforms it into dynamic, interactive visual reports using the powerful features of Power BI. It enables managers and team leaders to analyze performance in real time, monitor progress against targets, spot trends, and quickly identify KPIs that need improvement.
✨ Key Features of the Team Management KPI Dashboard
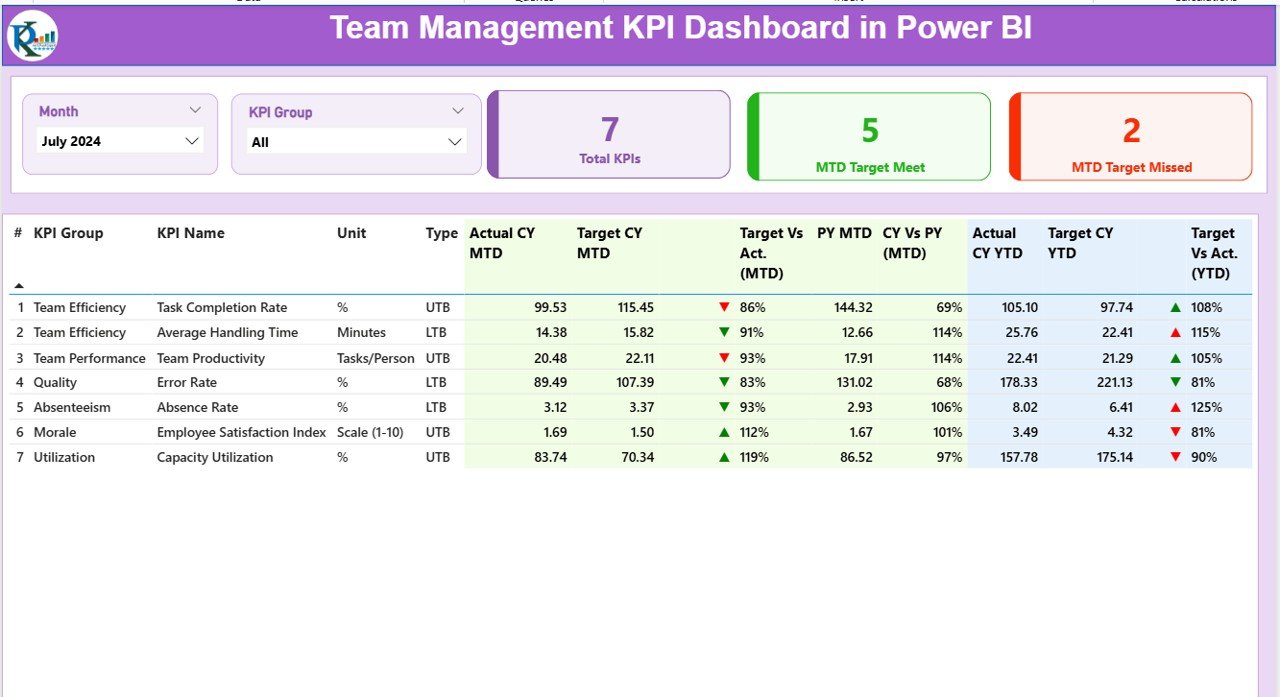
✅ Summary Page (Performance Snapshot)
-
Month and KPI Group slicers
-
Cards showing Total KPIs Tracked, MTD Target Met, and MTD Target Missed
-
Detailed KPI table including:
• KPI Number
• KPI Group & KPI Name
• Unit & KPI Type (LTB/UTB)
• Actual vs Target (MTD & YTD)
• Previous Year comparison
• Trend icons (▲ or ▼) to signal performance status
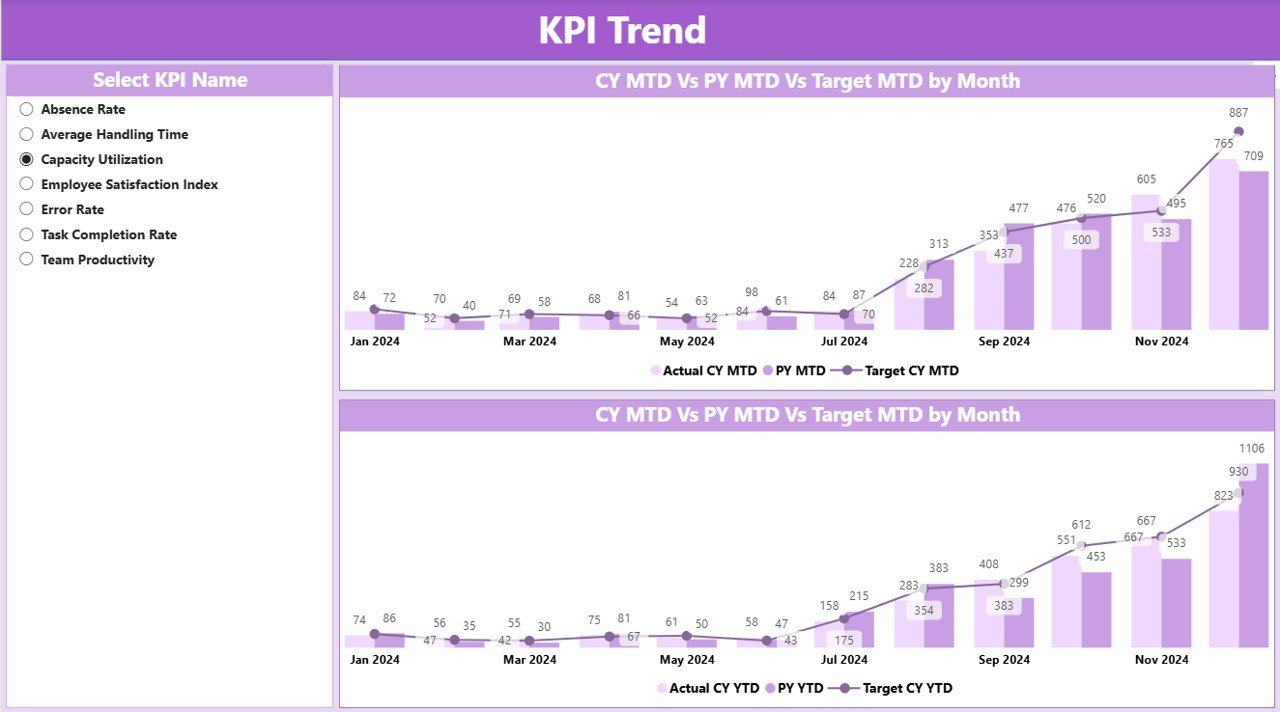
✅ KPI Trend Page (Performance Over Time)
-
Combo charts for CY Actual vs Target vs PY Actual
-
Separate MTD and YTD views
-
KPI Name slicer for focused analysis
-
Detect long-term trends and pattern changes
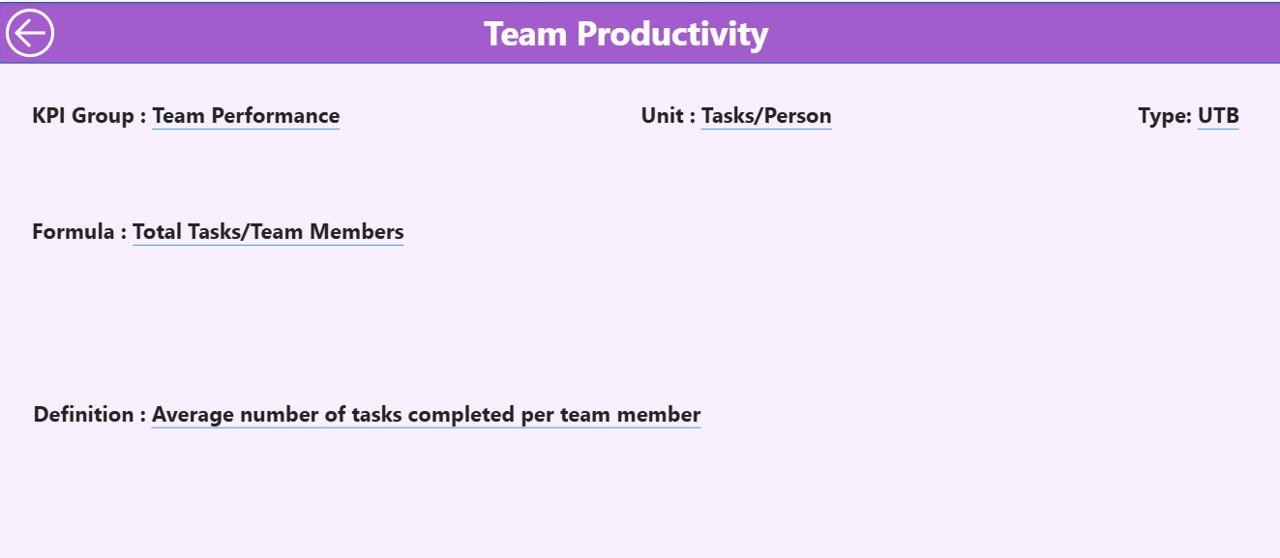
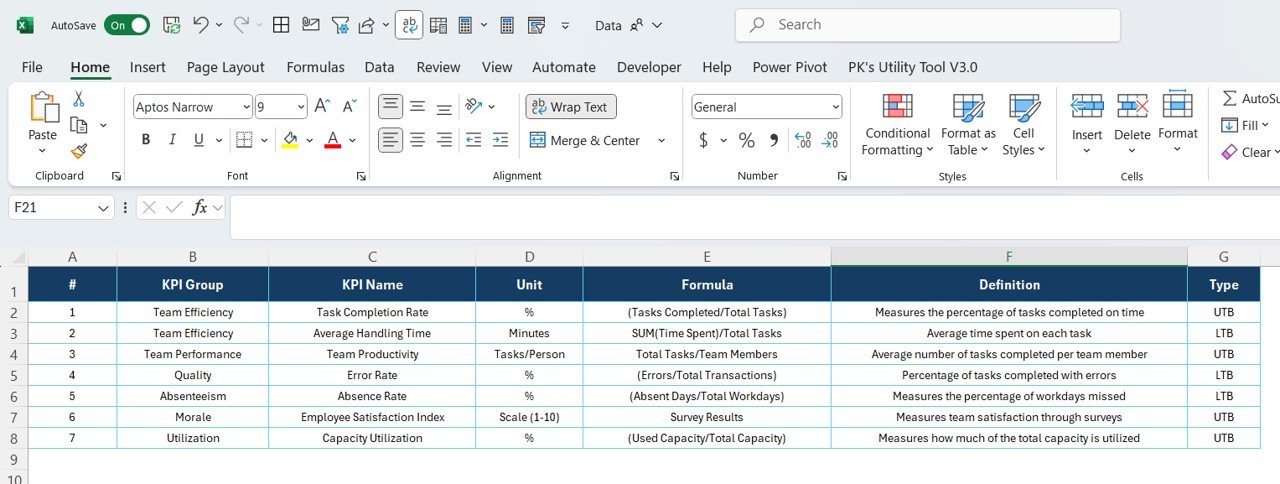
✅ KPI Definition Page (Drill-through View)
-
Formula and definition of each KPI
-
Accessed directly by right-clicking a KPI in the Summary Page
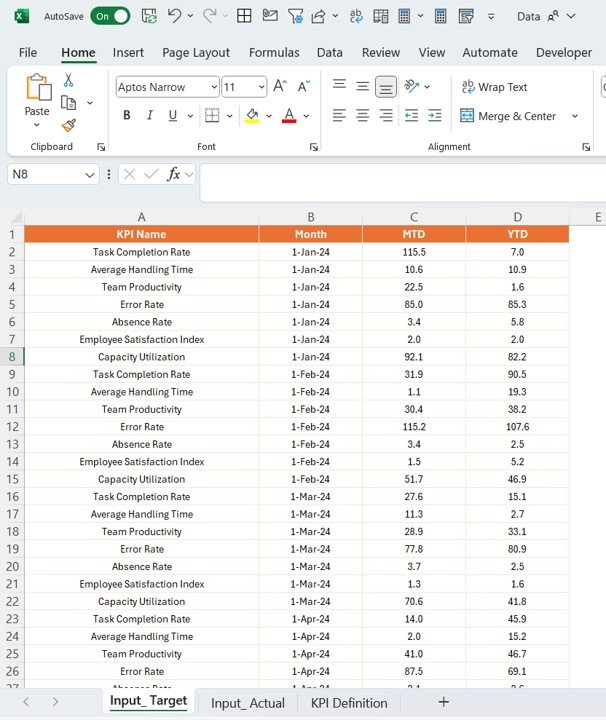
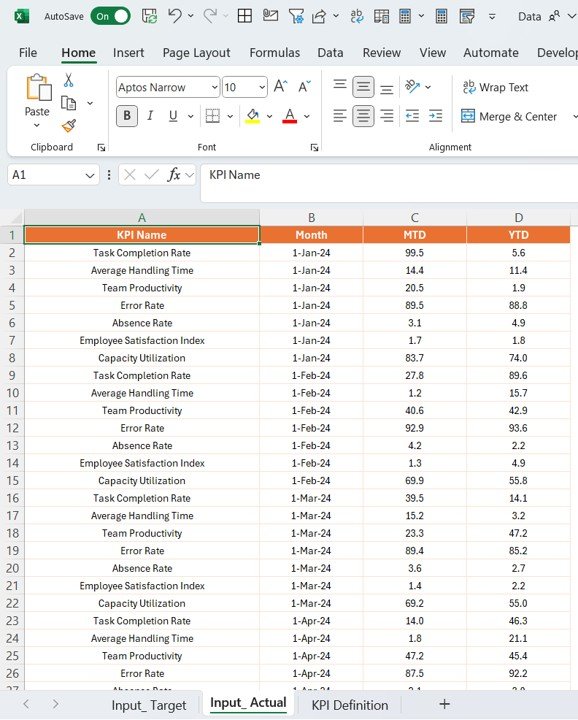
✅ Excel-Based Input
-
Actual and Target values are entered in Excel
-
Use the first day of the month in the “Month” column for easy refresh
-
No coding required
📂 What’s Included in the Dashboard
| Page | Purpose |
|---|---|
| Summary | High-level KPI performance snapshot (MTD & YTD) |
| KPI Trend | Trend analysis for selected KPI across 12 months |
| KPI Definition | KPI formula, definition & measurement details |
🛠 How to Use the Team Management KPI Dashboard
Step 1: Add Actual and Target values to the Excel sheets
Step 2: Open the Power BI file and click Refresh
Step 3: Use slicers (Month / KPI Group / KPI Name) to filter results
Step 4: Drill through for definition and formula if needed
Step 5: Review in team meetings and discuss improvement opportunities
🎯 Who Can Benefit from This Dashboard
👨💼 Team Leaders – Track performance and identify coaching needs
📈 Business Managers – Align KPIs with business goals and monitor progress
🤝 HR & People Teams – Analyze productivity trends and find improvement areas
🏢 Executives – Get a real-time, transparent performance overview
🚀 Why Use the Team Management KPI Dashboard in Power BI
-
Real-Time Insights – Analyze MTD & YTD progress instantly
-
Data-Driven Decisions – Make informed decisions based on facts, not guesses
-
Easy Input – Update data via Excel (no BI background required)
-
Performance Transparency – Share insights with the team to drive accountability
-
Trend Visibility – Detect recurring issues before they become roadblocks
-
Fully Customizable – Modify KPIs, visuals, and even add your logo


Reviews
There are no reviews yet.