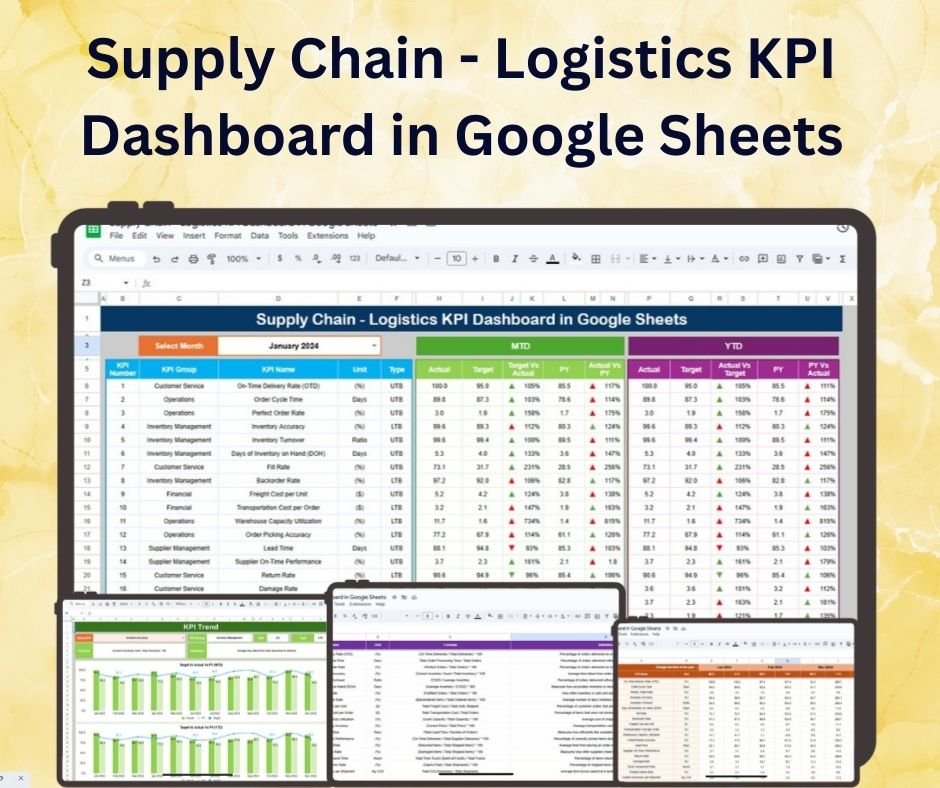

The Supply Chain – Logistics KPI Dashboard is a dynamic and comprehensive tool designed to help businesses optimize their supply chain operations. Whether you’re managing inventory, transportation, or supplier performance, this Google Sheets dashboard offers a clear, real-time view of your KPIs. Perfect for supply chain managers, logistics professionals, and business owners, it simplifies data analysis, helping you make informed decisions that drive operational efficiency.
With its user-friendly interface, this dashboard organizes vital supply chain data in one place, allowing you to track key performance indicators (KPIs) and assess the overall health of your logistics network. Whether you want to improve on-time delivery rates, reduce costs, or track inventory turnover, this dashboard makes it easy to monitor your performance metrics.
Key Features of the Supply Chain & Logistics KPI Dashboard:
📌 Real-Time Performance Tracking
Stay updated on the latest supply chain performance with real-time insights into metrics like on-time deliveries, order fulfillment rates, and inventory turnover.
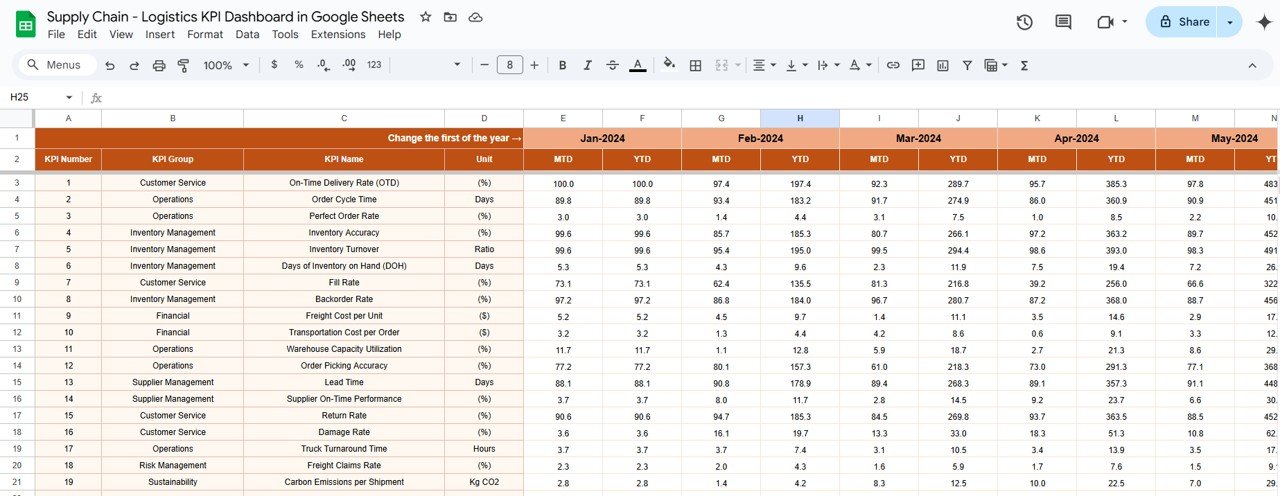
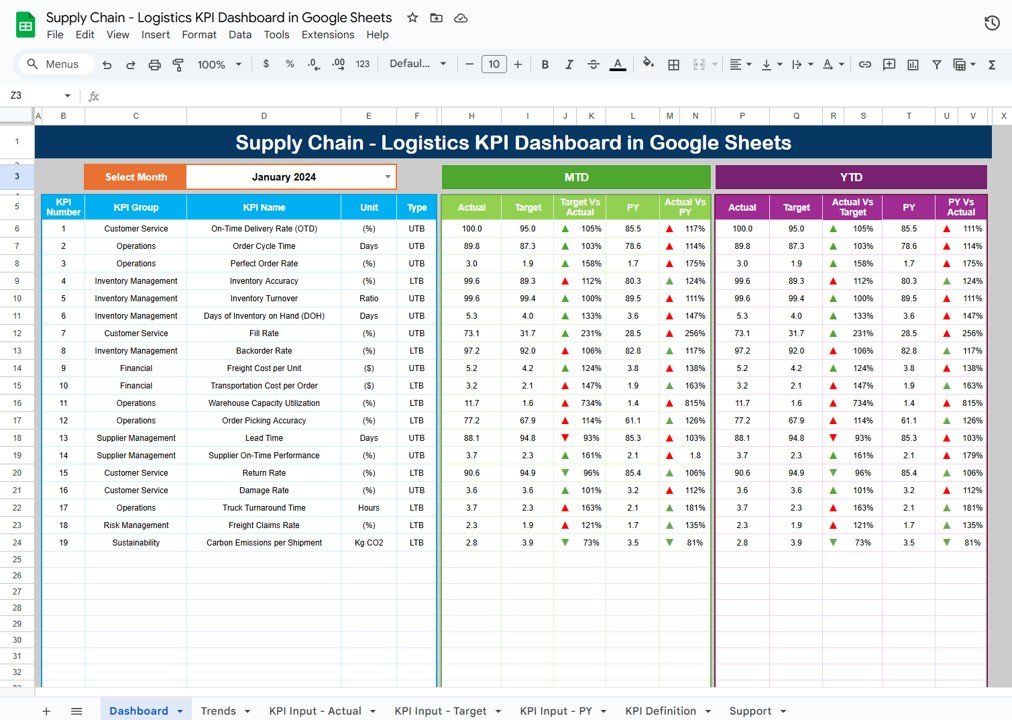
✔ Month-to-Date (MTD) and Year-to-Date (YTD) KPIs
Monitor your supply chain’s performance throughout the month and year to assess trends and identify potential issues before they escalate.
📊 Dynamic Dashboard
Easily view all key metrics in one place, with interactive charts and graphs that make data interpretation straightforward.
📈 KPI Trend Analysis
Visualize trends in critical KPIs like transportation costs, inventory turnover, and order fulfillment accuracy. Understand how your performance evolves over time.
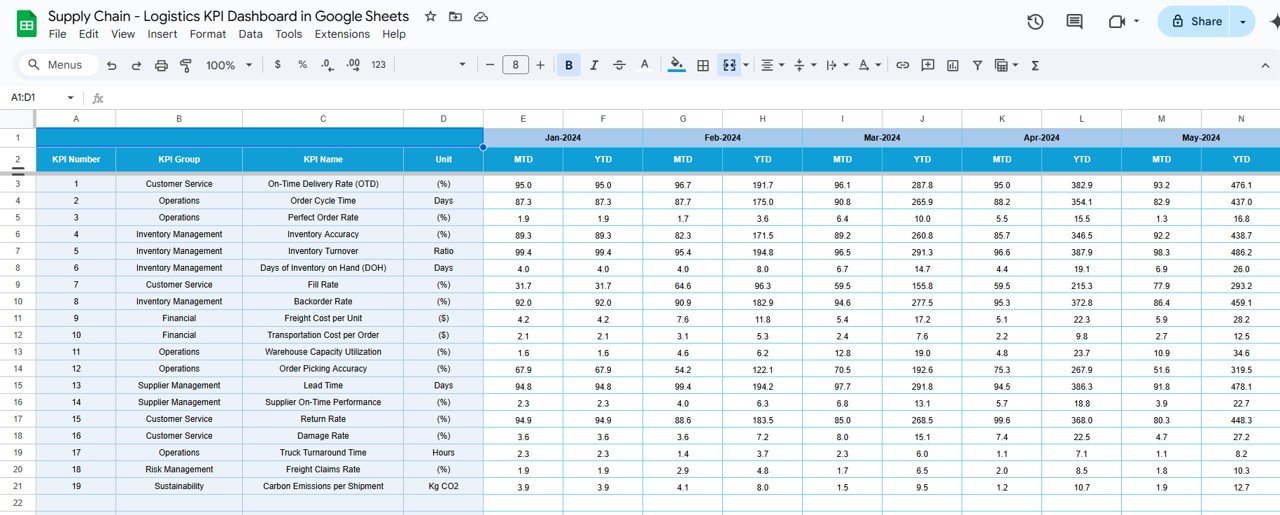
🎯 Target Setting and Comparison
Set monthly and yearly performance targets, and track progress with dynamic indicators that show how close you are to meeting your goals.
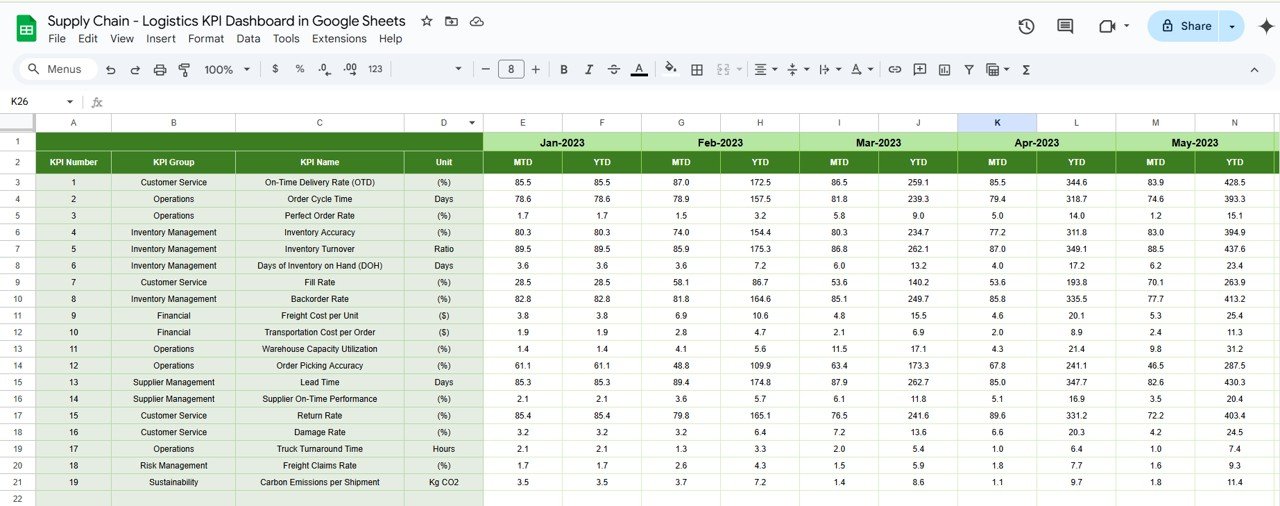
🔄 Historical Data Tracking
Input previous year’s data for year-over-year analysis, ensuring you stay on top of long-term trends and performance changes.
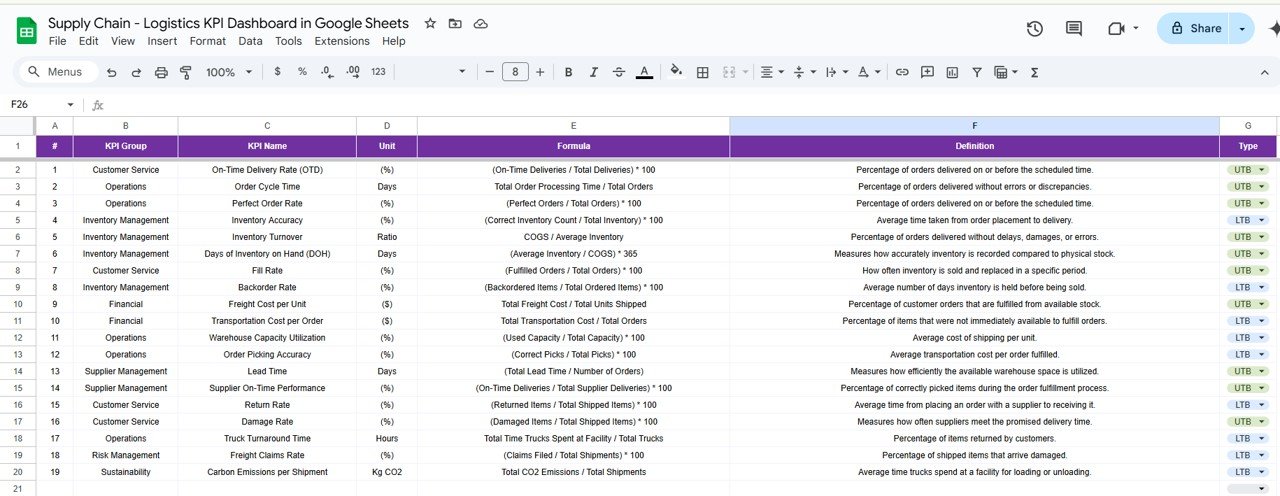
⚙️ Clear KPI Definitions
Easily understand the key metrics being tracked with clear definitions that help keep everyone on the same page.
🔔 Conditional Formatting Alerts
Use color-coded indicators to quickly spot performance deviations. Green for on-target, yellow for caution, and red for areas that need attention.
📝 Customizable Inputs
Enter actual supply chain data and compare it against your targets, adjusting the dashboard as your business needs evolve.
🔎 Easy Navigation
Navigate seamlessly with separate sheets for each KPI and a clean, intuitive layout. This ensures you can focus on what matters most without distractions.
🚀 Why You’ll Love the Supply Chain & Logistics KPI Dashboard in Google Sheets:
✅ Streamlined Data Management – Consolidate all your supply chain metrics in one dashboard to reduce time spent hunting for data across multiple spreadsheets.
✅ Improve Decision-Making – With clear insights into your performance, you’ll be able to make informed decisions that optimize your logistics network.
✅ Enhance Operational Efficiency – By tracking key supply chain activities, this tool helps identify bottlenecks, inefficiencies, and areas of improvement.
✅ Easy-to-Use Interface – The dashboard is designed to be intuitive, even for those with little technical knowledge.
✅ Fully Customizable – Adjust the dashboard to fit your unique supply chain needs, making it a perfect tool for businesses of all sizes.
What’s Inside the Supply Chain & Logistics KPI Dashboard:
- Order Fulfillment Rate: Measure how efficiently your team processes orders.
- On-Time Delivery Rate: Track your success in delivering products on time.
- Transportation Costs: Monitor the cost-effectiveness of your transportation.
- Inventory Turnover: See how quickly your inventory is moving.
- Supplier Performance: Track key metrics like delivery times and quality for each supplier.
How to Use the Supply Chain & Logistics KPI Dashboard:
1️⃣ Download the Template – Get immediate access to the Google Sheets template after purchase.
2️⃣ Input Your Data – Add your supply chain metrics into the pre-built fields.
3️⃣ Customize the Dashboard – Tailor it to reflect your specific business needs and supply chain processes.
4️⃣ Track Progress – Set targets and track your performance throughout the month and year.
5️⃣ Generate Reports – Use the dashboard to create performance reports and insights for your team.
Who Can Benefit from the Supply Chain & Logistics KPI Dashboard:
- Supply Chain Managers
- Logistics Professionals
- Inventory Managers
- Operations Teams
- Business Owners
- Enterprises and SMBs
This Google Sheets-based KPI dashboard is the perfect tool for anyone looking to streamline their supply chain operations. Track, analyze, and improve your logistics performance in a few simple steps.
Click here to read the Detailed blog post
https://neotechnavigators.com/supply-chain-logistics-kpi-dashboard-in-google-sheets/
Visit our YouTube channel to learn step-by-step video tutorials
Youtube.com/@PKAnExcelExpert


Reviews
There are no reviews yet.