
Managing a supply chain efficiently requires more than just spreadsheets and status reports—it requires clarity, speed, and precision. That’s exactly what the Supply Chain Dashboard in Excel delivers. Built for modern businesses, this powerful and interactive dashboard helps you track key metrics, identify inefficiencies, and make data-driven decisions—all within the familiar environment of Microsoft Excel. 📊🧠
Whether you’re overseeing procurement, monitoring inventory, or evaluating supplier performance, this tool gives you a 360° view of your supply chain performance—instantly.
💡 Key Features of Supply Chain Dashboard in Excel
🧭 Page Navigator Panel
Located on the left side of the dashboard, this panel offers one-click navigation across all key analytical pages. Save time and jump directly to what matters.
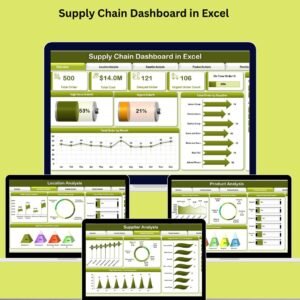
📋 Overview Page
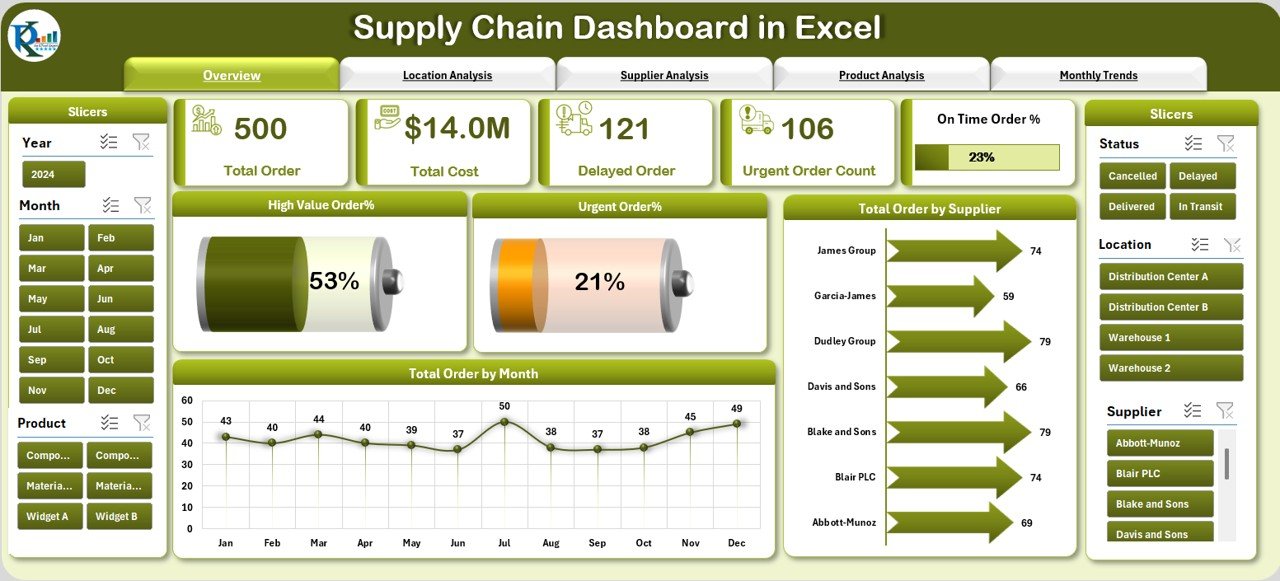
Get a summarized snapshot of your supply chain health:
-
🔢 5 Key Metric Cards – Total orders, urgent orders, high-value orders & more
-
📈 Charts – Visualize order trends by supplier and month, and highlight urgent/high-value order percentages
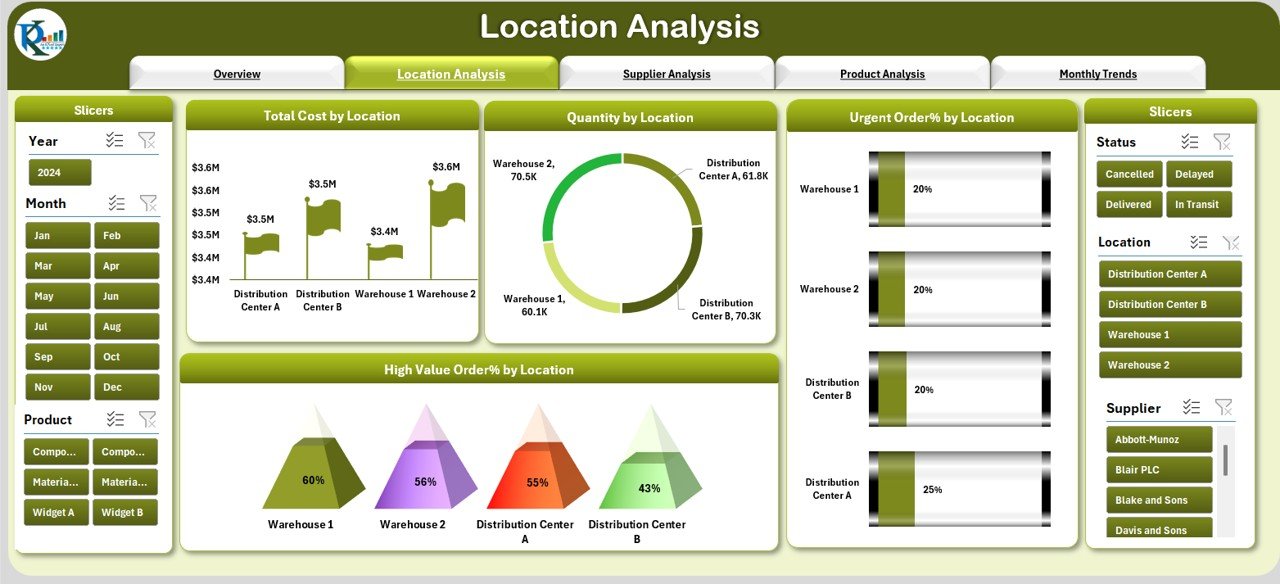
🌍 Location Analysis
Understand supply chain performance by geography:
-
💰 Total Cost by Location
-
📦 Quantity by Location
-
🚨 Urgent Orders by Region
-
💡 High-Value Order % by Location
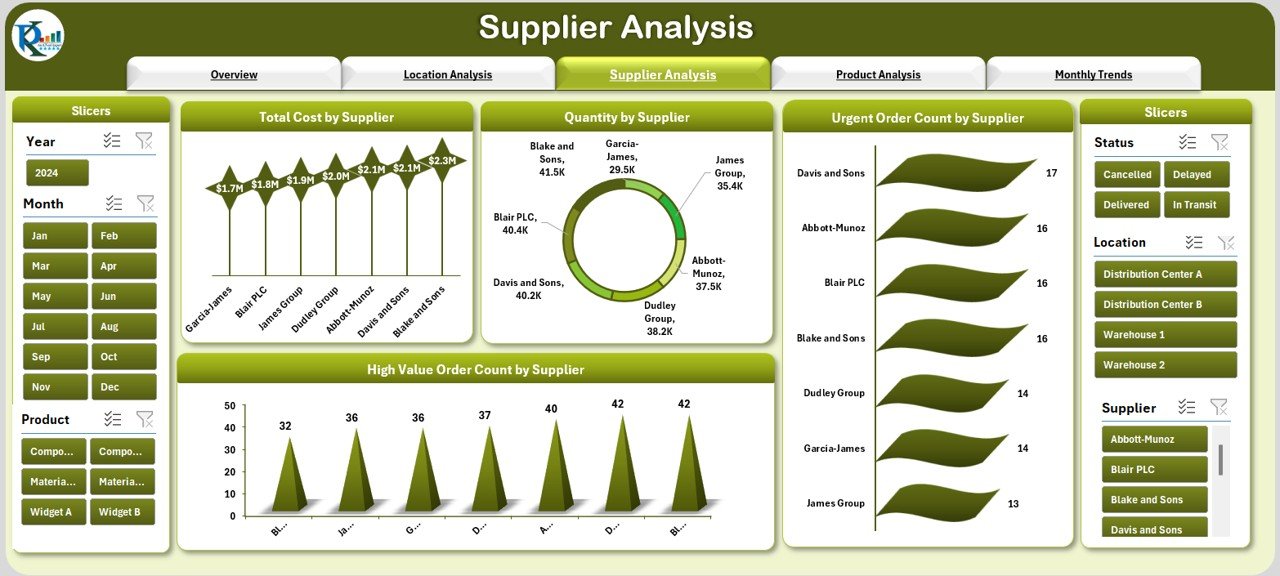
🤝 Supplier Analysis
Evaluate supplier performance to ensure cost-effective and timely fulfillment:
-
💸 Cost & Quantity by Supplier
-
⏱ Urgent Order Count
-
⭐ High-Value Order %
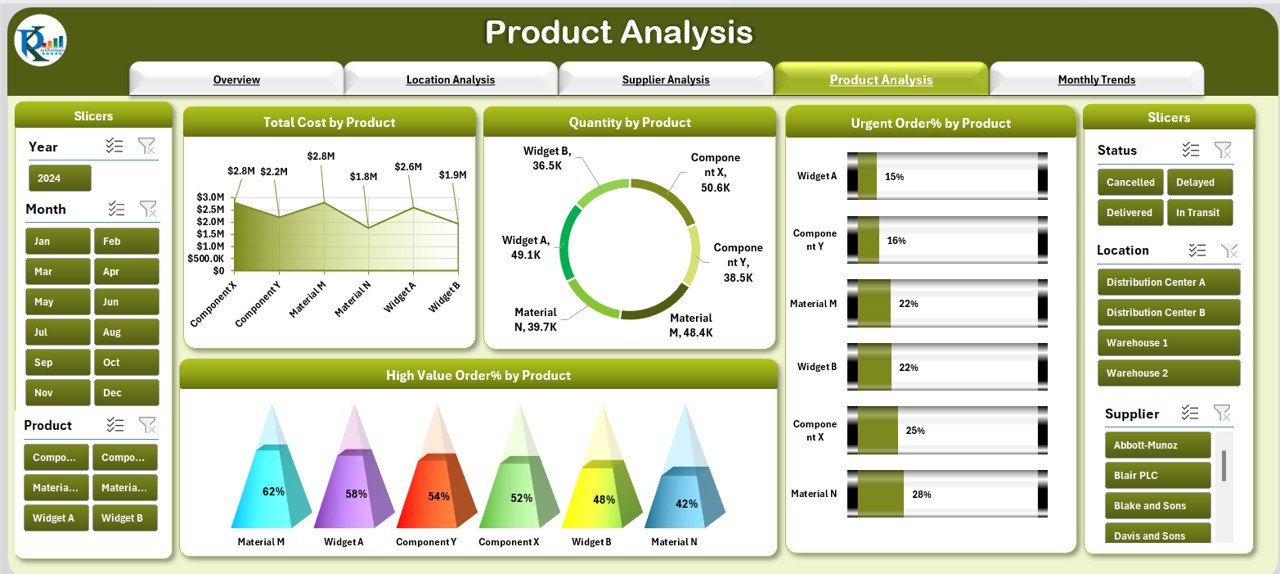
🧾 Product Analysis
Dig deep into product performance:
-
📊 Cost and Quantity per Product
-
🚨 Urgent Order %
-
⭐ High-Value Product %
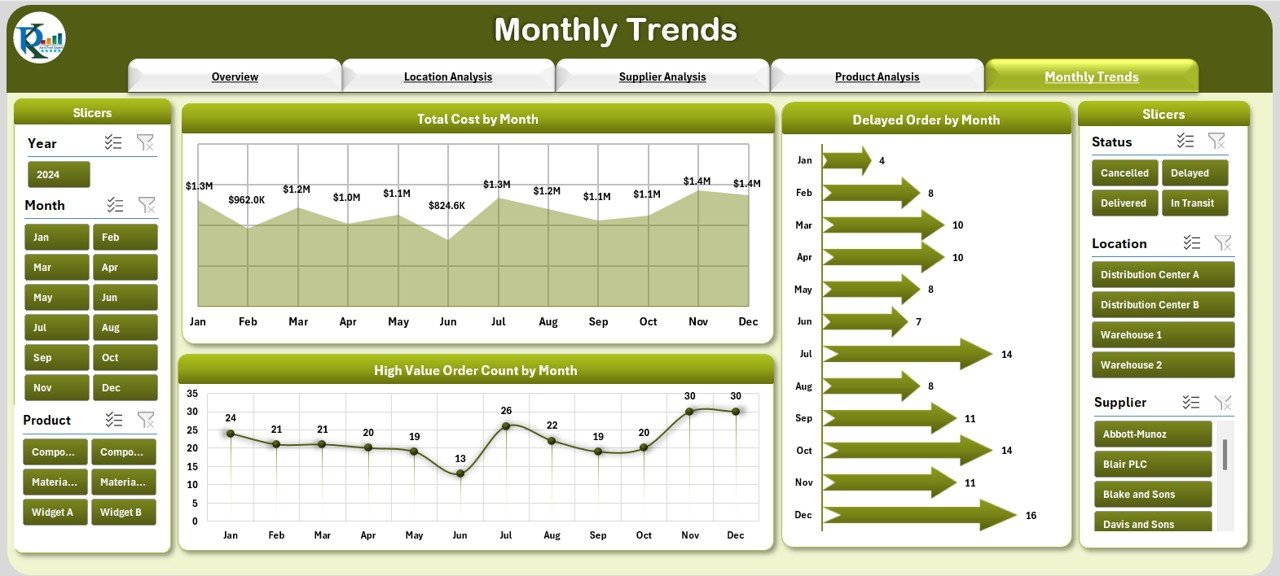
📆 Monthly Trends Page
Track how your supply chain evolves over time:
-
📈 Cost Trends
-
⚠️ Delayed Orders by Month
-
🔄 High-Value Order % by Month
📄 Data Sheet
Input and update all operational data in this structured table. The dashboard auto-refreshes with every update.
📘 Support Sheet
Excel Pivot Tables to create the charts on all pages.
📦 What’s Inside the Excel Dashboard?
-
✅ Overview Page – Instant snapshot of supply chain health
-
📍 Location, Supplier & Product Analysis – Focused, filterable views
-
📆 Monthly Trends – Understand seasonal and monthly shifts
-
🧾 Input-Ready Data Sheet – Easy to update, no coding required
-
📚 Support Page – Excel Pivot Tables to create the charts on all pages.
-
🎨 Conditional Formatting – Highlights urgent items, high costs, or delayed orders
-
📊 Visual Charts & Graphs – Make data instantly digestible
🛠️ How to Use the Supply Chain Dashboard
-
Input Data – Fill in the Data Sheet with order details, suppliers, products, etc.
-
Navigate Pages – Use the sidebar navigator to jump between dashboards.
-
View Insights – Explore charts for location, supplier, and product trends.
-
Identify Bottlenecks – Quickly spot urgent orders or delayed deliveries.
-
Make Data-Driven Decisions – Use the dashboard to guide purchasing, vendor management, and inventory optimization.
👥 Who Can Benefit from This Dashboard?
📦 Procurement Teams – Monitor order volumes and supplier reliability
🏭 Supply Chain Managers – Track regional costs and delivery issues
🛒 Retailers & Wholesalers – Improve product flow and vendor relationships
📊 Business Analysts – Identify performance trends and cost-saving opportunities
📈 Executives – Get instant insight into supply chain health for strategic decisions
Ideal for startups, mid-sized companies, and enterprise-level supply chains.
🔗 Click here to read the Detailed blog post
📺 Visit our YouTube channel to learn step-by-step video tutorials


Reviews
There are no reviews yet.