

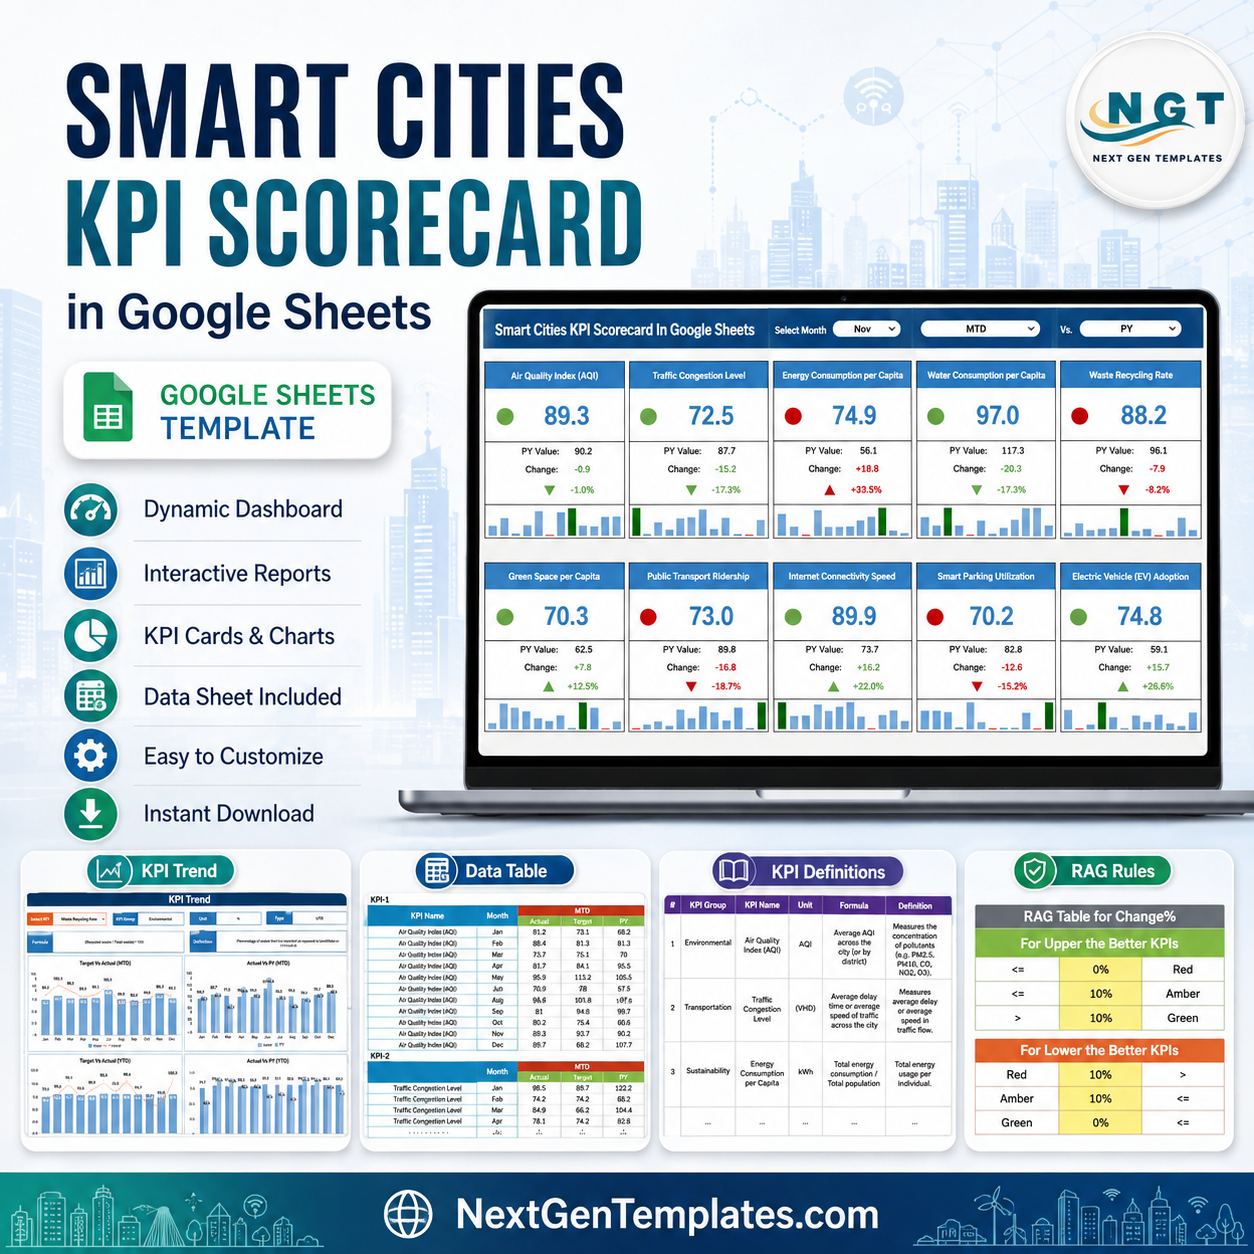
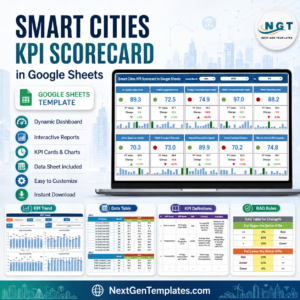
Smart Cities KPI Scorecard in Google Sheets tracks 10 city performance KPIs across environmental quality, transportation, sustainability and technology in one browser-based scorecard. City teams need that discipline: the United Nations projects 68% of the world population will live in urban areas by 2050. This template turns monthly numbers into RAG status lights, MTD/YTD comparisons, prior-year variance and 12-month sparklines. Built by PK, founder of NextGenTemplates and creator behind 300K+ YouTube subscribers, it is a one-time purchase with no subscription and an editable Google Drive copy.
Key Features of Smart Cities KPI Scorecard In Google Sheets
- 10 smart city KPIs: Air Quality Index, Traffic Congestion Level, Energy Consumption per Capita, Water Consumption per Capita, Waste Recycling Rate, Green Space per Capita, Public Transport Ridership, Internet Connectivity Speed, Smart Parking Utilization and Electric Vehicle Adoption.
- Month, period and comparison controls: select the month, switch between MTD and YTD, and compare against PY or target from the top of the scorecard.
- RAG status lights: red, amber and green indicators read from the Change% rules, with separate logic for upper-the-better and lower-the-better KPIs.
- KPI trend page: select one KPI and review Target vs Actual and Actual vs PY charts for both MTD and YTD.
- Structured data sheet: each KPI has month-by-month Actual, Target and PY fields for MTD and YTD, so the scorecard can update from clean inputs.
- Editable KPI definition sheet: document KPI group, unit, formula, definition and type so every reviewer reads the numbers the same way.
What’s Inside the Smart Cities KPI Scorecard In Google Sheets
KPI Scorecard Sheet
The main scorecard displays all 10 KPIs in two rows of cards. Each card includes the current value, PY value, change, percent change, RAG light and a compact 12-month sparkline. The sample view is set to November, MTD and PY comparison.
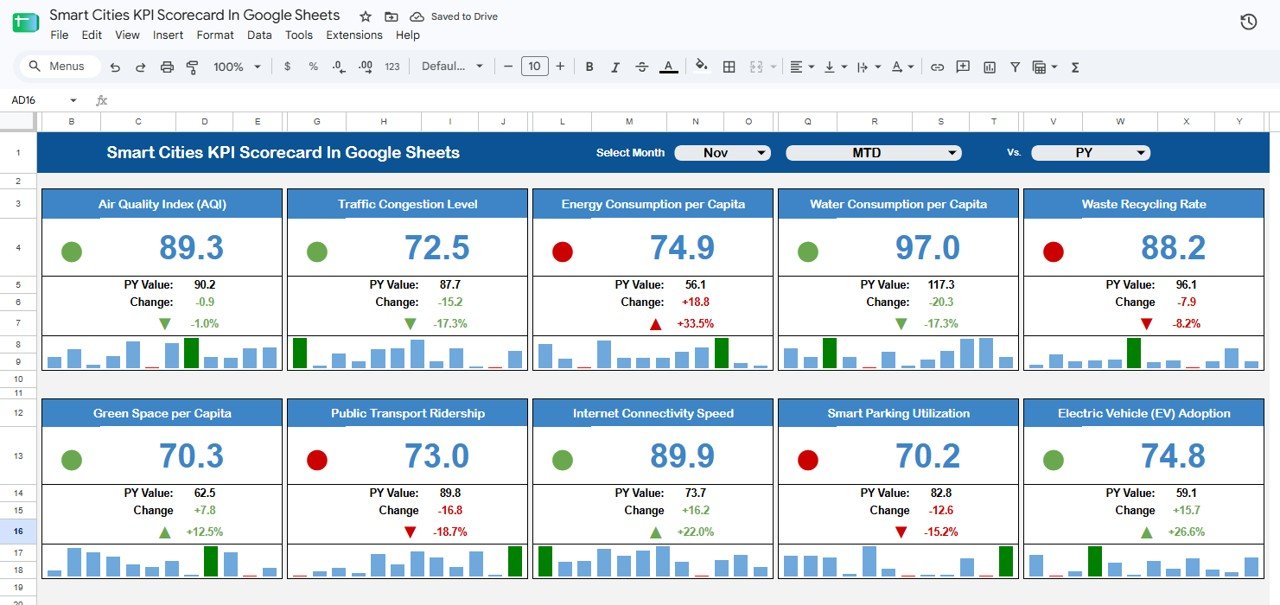
Smart Cities KPI Scorecard – main scorecard sheet
KPI Trend Sheet
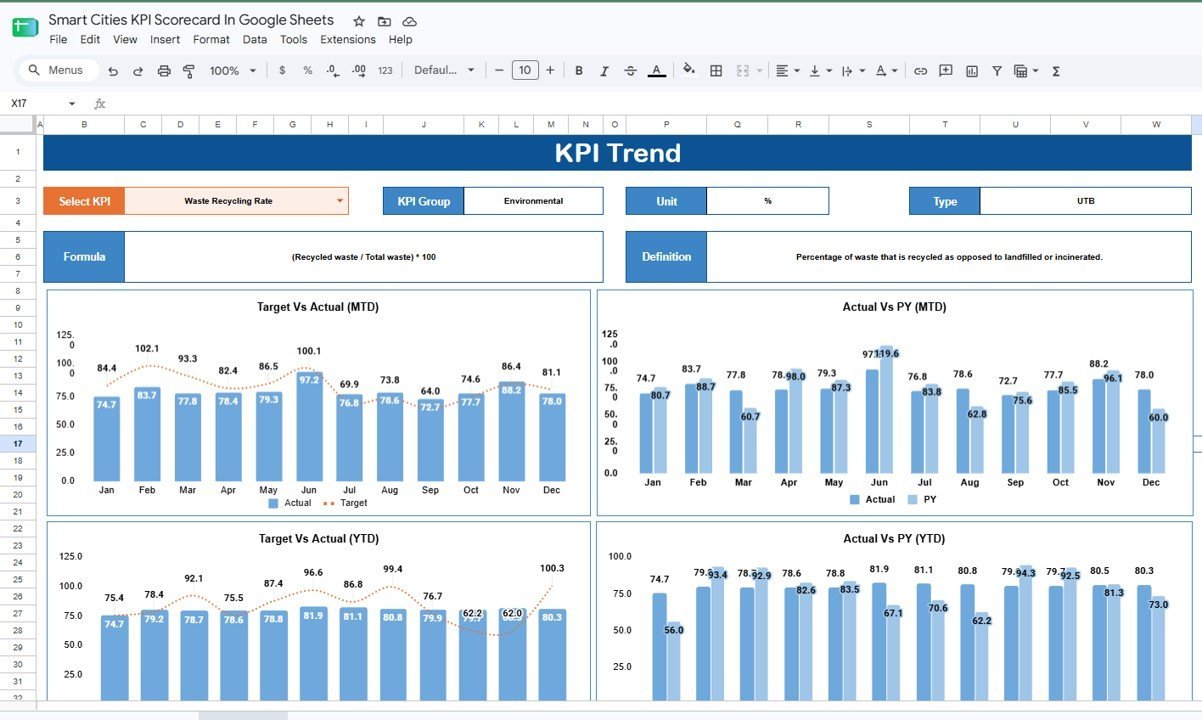
Select any KPI, such as Waste Recycling Rate, and the trend page shows its group, unit, formula, definition and type. Four charts compare Target vs Actual and Actual vs PY across MTD and YTD.
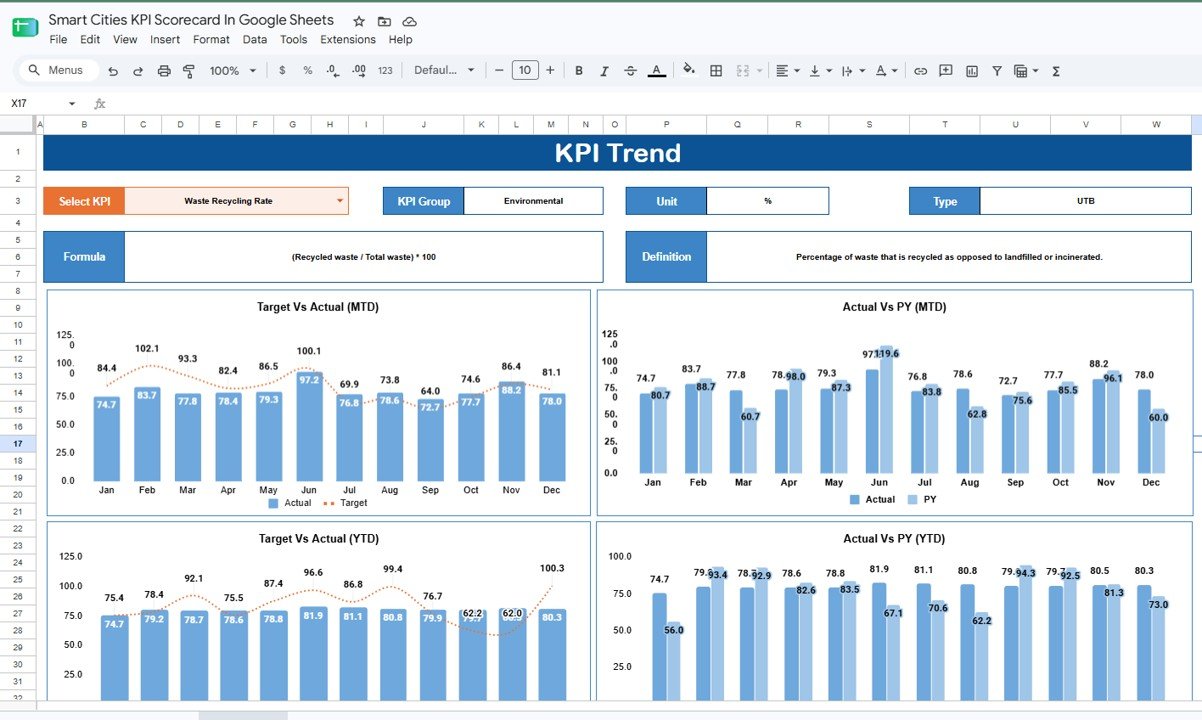
KPI Trend sheet
KPI Data Sheet
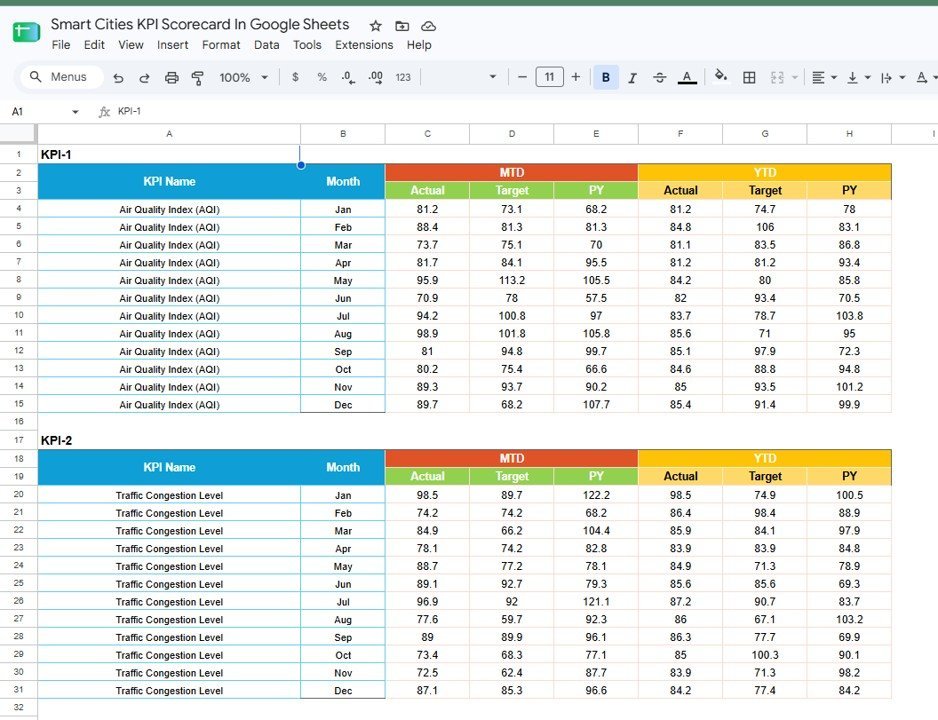
The data sheet is organized by KPI block. For every month from January to December, enter MTD Actual, Target and PY plus YTD Actual, Target and PY. The scorecard and trend charts then read from those monthly values.
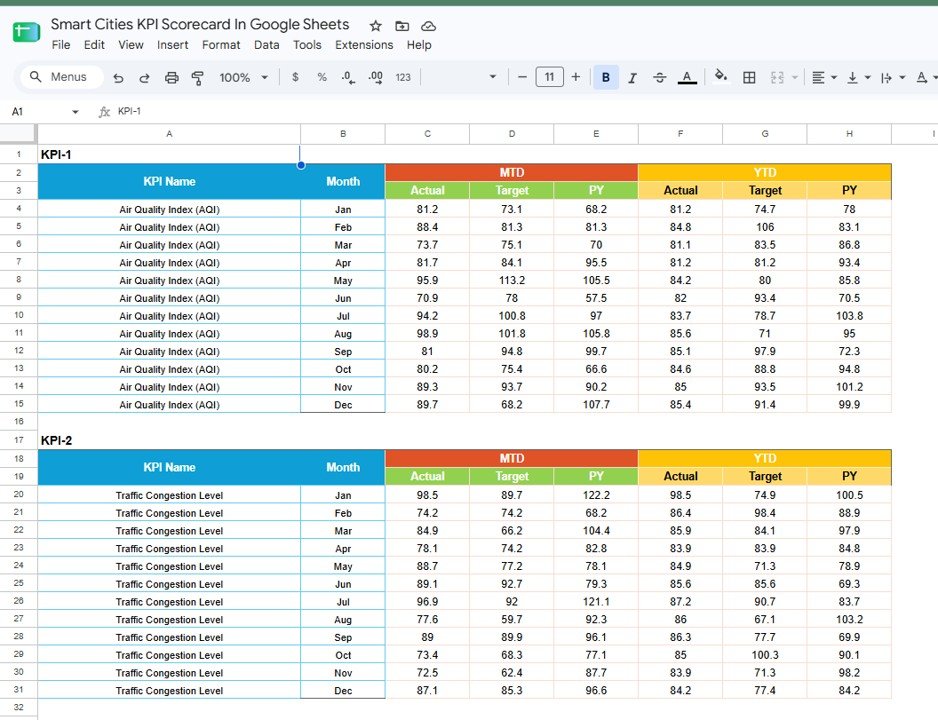
KPI data sheet
KPI Definition Sheet
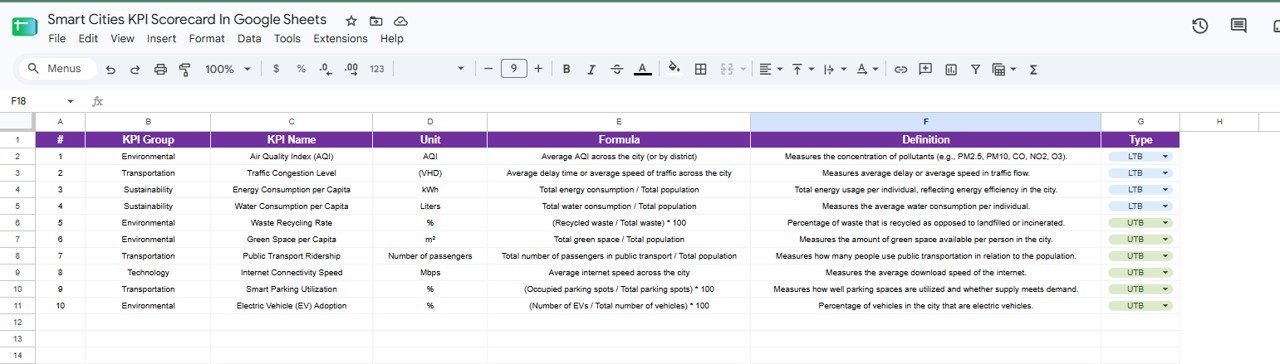
The definition sheet keeps governance visible. It lists each KPI group, name, unit, formula, definition and type. Lower-the-better KPIs include AQI, congestion, energy consumption and water consumption; upper-the-better KPIs include recycling, green space, transit ridership, internet speed, smart parking and EV adoption.
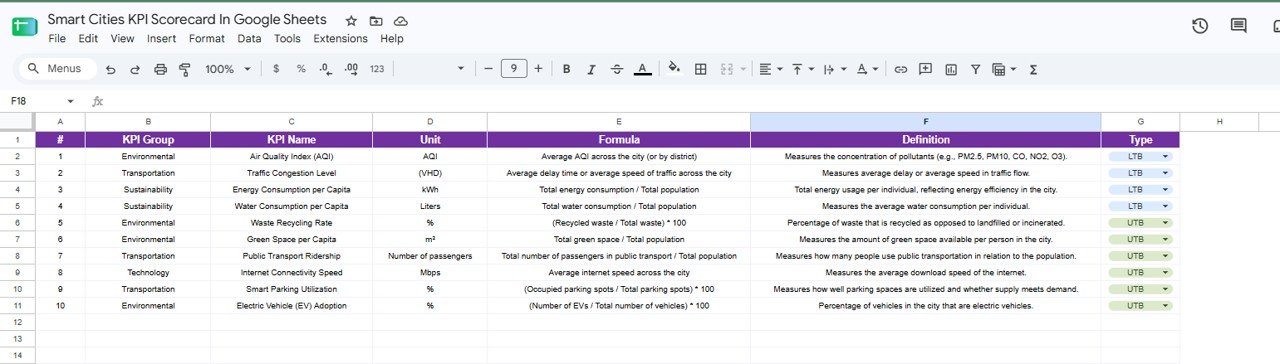
KPI definition sheet
RAG Table for Change%
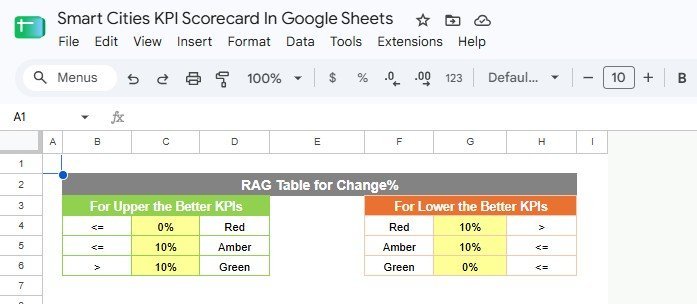
The RAG table defines how change percentages convert to red, amber and green. Upper-the-better KPIs turn green when the change is above 10%, amber up to 10%, and red at 0% or below. Lower-the-better KPIs reverse the logic so reductions score correctly.
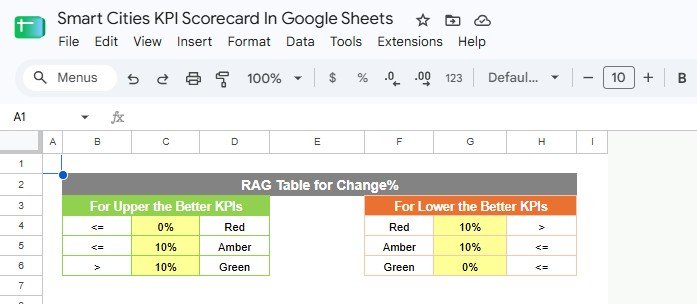
RAG Table for Change%
Smart Cities KPI Scorecard In Google Sheets vs. Microsoft Excel Scorecard vs. Paid Civic Analytics SaaS – Where This Fits
| Feature | This Google Sheets scorecard | Microsoft Excel scorecard | Paid civic analytics SaaS |
|---|---|---|---|
| Cost | $8.99 one-time | $10-$25 one-time plus Excel access | Usually subscription or quote-based |
| Platform | Google Sheets in any browser | Desktop Excel or Microsoft 365 | Vendor portal |
| Setup time | Under 10 minutes | 15-30 minutes | Days or weeks |
| Real-time team collaboration | Native Google sharing | Requires OneDrive co-authoring | Seat-based access |
| Mobile access | Google Sheets mobile app | Excel mobile app | Vendor app if available |
| Customizable fields | Edit KPI definitions, formulas and thresholds | Editable, but formulas may need care | Often limited to admin configuration |
| Share with link | Yes | Yes with cloud storage | Usually login required |
| Year-1 cost at 5 users | $8.99 total | Template cost plus licenses | Often hundreds or thousands |
| Best fit | Monthly smart city performance review | Offline spreadsheet reporting | Automated enterprise data pipelines |
Who This Template Is For – and Who It’s Not For
Use this template if you manage municipal performance reporting, smart city pilots, sustainability programs, transportation planning, public works review meetings or digital-infrastructure scorecards. It is especially useful for small and mid-size city teams that want a shared monthly KPI view without buying a large civic analytics platform.
Do not use it as a live city operations system. It does not connect to IoT sensors, traffic cameras, smart meters, permitting systems, SCADA feeds or GIS layers by itself. It reports the monthly numbers you enter, so it is a scorecard for review and communication rather than a data integration platform.
How to Use the Smart Cities KPI Scorecard In Google Sheets
- Open the PDF guide from your download and use the Google Sheets copy link to create your own editable file in Drive.
- Review the KPI Definition sheet and adjust groups, units, formulas, definitions and UTB/LTB types for your city.
- Enter monthly Actual, Target and PY values in the KPI Data sheet for MTD and YTD.
- Open the KPI Scorecard sheet, choose the month, period and comparison option, then review the RAG status cards.
- Use the KPI Trend sheet to explain one KPI at a time during leadership reviews, council briefings or program meetings.
- Adjust the RAG Table for Change% if your reporting rules use different thresholds.
Real-World Use Cases
Maria, Smart City Program Manager: Maria tracks EV adoption, smart parking utilization, internet speed and public transport ridership in one monthly file and shares a view-only link before the steering committee meeting.
Daniel, Sustainability Analyst: Daniel uses Waste Recycling Rate, Green Space per Capita, energy consumption and water consumption to show where city sustainability indicators are improving or slipping against PY.
Aisha, Transportation Planner: Aisha compares Traffic Congestion Level and Public Transport Ridership across the year, then opens the KPI Trend sheet when a single metric needs a deeper explanation.
Frequently Asked Questions
Does this Smart Cities KPI Scorecard in Google Sheets connect to live city systems?
No. It is a Google Sheets scorecard for monthly KPI reporting. You can paste or import exported values, but the template does not include live data connectors.
Can I change the KPIs?
Yes. The KPI Definition sheet is editable. You can rename KPIs, change formulas, update groups, revise units and adjust the upper-the-better or lower-the-better type.
What KPIs are included?
The included KPIs are AQI, Traffic Congestion Level, Energy Consumption per Capita, Water Consumption per Capita, Waste Recycling Rate, Green Space per Capita, Public Transport Ridership, Internet Connectivity Speed, Smart Parking Utilization and EV Adoption.
Does the scorecard support target and prior-year comparison?
Yes. The data sheet includes Actual, Target and PY columns for both MTD and YTD. The scorecard can compare against PY or target using the top dropdown controls.
Can multiple people work in the file?
Yes. Because it is built in Google Sheets, you can share the file with viewers, commenters or editors depending on your governance process.
Is this suitable for public reporting?
It can support internal review and exported reporting, but you should validate the source data, definitions and approval process before using any figures in official public publications.
About the Author
Built by PK – Microsoft Certified Professional with 15+ years of Excel, Google Sheets, and Power BI experience. Founder of NextGenTemplates, reaching 300K+ subscribers across YouTube channels. Every template is hand-built and tested before release.
Explore Related Templates
For adjacent civic and sustainability reporting, see the Municipal Services KPI Scorecard in Google Sheets, Smart City Surveillance Dashboard in Excel, Smart City Surveillance Dashboard in Power BI, Waste Reduction KPI Dashboard in Google Sheets and Carbon Footprint KPI Dashboard in Google Sheets. You can also browse the full Google Sheets KPI Dashboard category or the broader Google Sheets template collection.
Ready to track city performance in one shared file? Get the Smart Cities KPI Scorecard in Google Sheets, add your monthly values and turn 10 city indicators into a clear monthly review pack.
Watch the step-by-step video Demo:
Last updated: August 2026


























Reviews
There are no reviews yet.