



The Shelf Space Utilization KPI Dashboard in Excel is a crucial tool for retail managers, store owners, and supply chain professionals seeking to optimize the use of shelf space in their stores. This Excel-based dashboard helps track key performance indicators (KPIs) such as space efficiency, sales per square foot, inventory turnover, and product placement to improve the overall management of shelf space. By optimizing shelf space, businesses can enhance product visibility, increase sales, and reduce waste.
Whether you’re managing a supermarket, department store, or any retail environment, the Shelf Space Utilization KPI Dashboard in Excel provides the insights needed to make data-driven decisions. With real-time tracking and customizable KPIs, this dashboard enables you to assess the effectiveness of product placement, optimize shelf layout, and ultimately boost sales performance.
Key Features of the Shelf Space Utilization KPI Dashboard in Excel
📊 Track Shelf Space Efficiency
Monitor the efficiency of your shelf space utilization. Evaluate how well products are placed and track the sales generated per unit of shelf space to optimize product placement.
⚡ Sales per Square Foot
Measure sales per square foot of shelf space to identify high-performing areas and optimize product assortment and placement for maximum sales.
📈 Inventory Turnover & Stock Levels
Track inventory turnover rates to ensure that products are moving efficiently off the shelves. Monitor stock levels to avoid overstocking or stockouts, ensuring that shelves are always properly stocked.
🛒 Product Placement Optimization
Assess the placement of products on the shelves and how it impacts sales. Use the data to optimize product positioning and increase visibility for high-demand items.
🖥️ Interactive & Real-Time Insights
Gain real-time updates on key KPIs. The Excel dashboard includes interactive charts, slicers, and filters for in-depth data analysis and actionable insights.
Why You’ll Love the Shelf Space Utilization KPI Dashboard in Excel

✅ Optimize Shelf Space Efficiency
Track space efficiency and sales per square foot to ensure that your store layout maximizes sales potential. Adjust product placement and inventory based on performance.
✅ Maximize Sales Performance
Monitor sales performance across different shelf sections. Track which areas and products are performing well and adjust your shelf layout to boost overall sales.
✅ Ensure Optimal Stock Levels
Track inventory turnover and stock levels to prevent overstocking or running out of stock. Optimize product replenishment and reduce waste.
✅ Data-Driven Decision Making
Make informed decisions about product placement, stock levels, and shelf layout based on real-time data from the dashboard. Optimize operations to improve sales and efficiency.
✅ Enhance Customer Shopping Experience
By optimizing shelf space and product placement, you can create a more organized and attractive store layout, leading to a better shopping experience for your customers.
What’s Inside the Shelf Space Utilization KPI Dashboard Template?
- Shelf Space Efficiency Tracking: Monitor the efficiency of your shelf space usage to maximize sales.
- Sales per Square Foot: Track sales performance per unit of shelf space to identify high-performing areas.
- Inventory Turnover Tracking: Monitor inventory turnover rates and adjust stock levels as needed.
- Product Placement Optimization: Evaluate the effectiveness of product placement and adjust for better visibility.
- Real-Time Data Insights: Get live data on sales performance, stock levels, and space efficiency.
- Customizable KPIs: Tailor the dashboard to track the KPIs that matter most to your retail business.
How to Use the Shelf Space Utilization KPI Dashboard in Excel
1️⃣ Download the Template: Get instant access to your Shelf Space Utilization KPI Dashboard in Excel.
2️⃣ Input Your Data: Enter sales, inventory, and space utilization data into the dashboard.
3️⃣ Track & Monitor KPIs: Use the dashboard to track space efficiency, sales, and inventory performance in real time.
4️⃣ Analyze & Optimize: Use insights to optimize your shelf space, product placement, and inventory levels for improved sales.
Who Can Benefit from the Shelf Space Utilization KPI Dashboard in Excel?
🔹 Retail Managers & Store Owners
🔹 Supply Chain & Inventory Managers
🔹 Merchandisers & Visual Merchandising Teams
🔹 E-commerce & Online Retailers
🔹 Supermarket & Department Store Managers
🔹 Anyone Looking to Optimize Shelf Space & Maximize Sales
Optimize your retail operations and improve sales performance with the Shelf Space Utilization KPI Dashboard in Excel. Track space efficiency, sales per square foot, inventory turnover, and product placement to ensure that your store layout drives sales and enhances the customer experience.
Click here to read the Detailed blog post
Visit our YouTube channel to learn step-by-step video tutorials
Youtube.com/@PKAnExcelExpert
Compatibility and Requirements
- Works in Microsoft Excel desktop (Excel 2016 or later, or Microsoft 365).
- The dashboard uses charts, slicers and filters. Microsoft explains slicers in Use slicers to filter data.
Frequently Asked Questions
Which KPIs does the Shelf Space Utilization dashboard track?
Shelf space efficiency, sales per square foot, inventory turnover and stock levels, and the effect of product placement on sales.
What data do I enter?
Your sales, inventory and space utilization data. The dashboard then shows the KPIs.
Can I filter the results?
Yes. The dashboard has interactive charts, slicers and filters for deeper analysis.
Can I add my own KPIs?
Yes. The KPIs are customizable, so you can track the metrics that matter to your store.
Is there a Power BI version?
Yes. The Shelf Space Utilization KPI Dashboard in Power BI covers the same topic in Power BI.
Related Retail Templates
- Shelf Space Utilization KPI Dashboard in Power BI: the same topic in Power BI
- Retail KPI Dashboard In Excel: wider retail KPIs in Excel
- Out-of-Stock Rate KPI Dashboard in Excel: track stockouts by product
- Retail Dashboard in Excel: a full retail sales dashboard
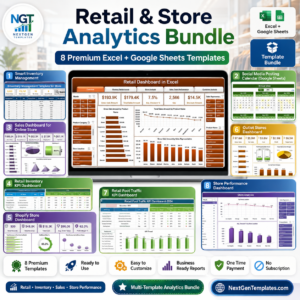
- Retail & Store Analytics Bundle: 8 retail templates in one download
Browse all Excel KPI dashboards or the Excel inventory management templates.



























Reviews
There are no reviews yet.