The Sales Tracking Dashboard in Excel is a comprehensive and dynamic tool designed to streamline sales data management, providing businesses with a clear overview of performance metrics. Whether you are tracking total sales, discounts, net sales, or analyzing performance by region, product, or sales representative, this dashboard makes the task effortless and insightful. Here’s a deeper look into its key features:
Visual Dashboard for Quick Insights
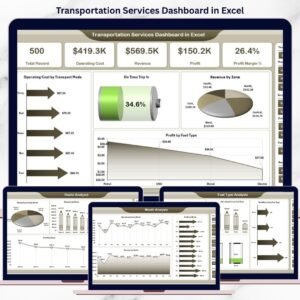
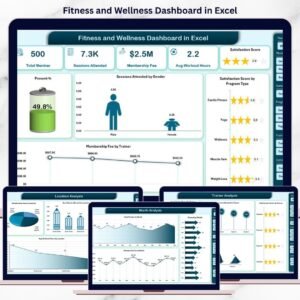
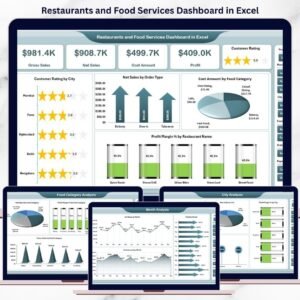
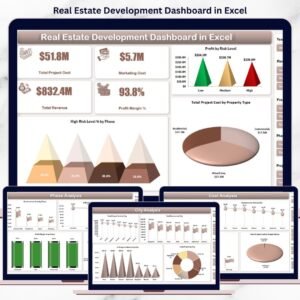
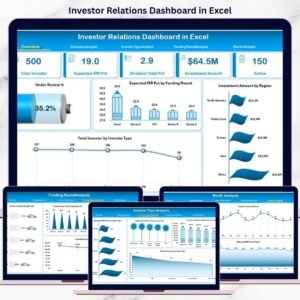
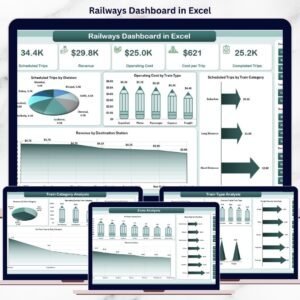
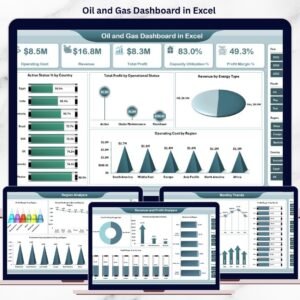
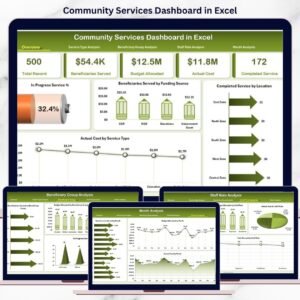
The Sales Tracking Dashboard offers a visual representation of sales data through interactive charts, including 3D pie charts, bar charts, and trend analysis graphs. These visual tools help users quickly interpret key metrics such as:
- Total Sales
- Discounts
- Net Sales by region
- Sales trends over time
The use of slicers allows users to filter data by different categories such as regions, products, or sales reps, enabling precise and customized reports for better decision-making.
Automated Data Entry Forms
Managing sales data becomes straightforward with Automated Data Entry Forms. The Excel template includes interactive buttons that allow users to:
- Add new records
- Update existing records
- Delete records
These forms simplify the data entry process, ensuring that sales representatives, products, and related information are captured accurately without manual error. They also allow easy tracking of each record’s update status, minimizing manual input and saving time.
Comprehensive Data Management
The Sales Tracking Dashboard offers comprehensive data management by organizing essential details such as:
- Sales Reps
- Products
- Regions
- Sales Channels
The tool supports various sales channels such as online, retail, and wholesale, ensuring that businesses can easily segment and analyze their sales data based on the type of transaction. Data is organized in a clear and easily accessible manner, making it simple for users to monitor and track their sales performance.
Customizable Lists and Reports
One of the standout features of this dashboard is its customizable lists and reports. Businesses can easily modify the layout and charts to suit their unique needs. For example, users can adjust the data based on the sales representative, region, or product. This level of flexibility ensures that the dashboard remains useful for different industries and business models.
Pivot Table Support for Insights
In addition to the dynamic charts, the dashboard also integrates pivot tables. These tables work behind the scenes to generate insights based on the data entered into the sales records. The pivot tables analyze key metrics like:
- Total Sales
- Net Sales by Region
- Sales by Product
This automated process saves time and effort by eliminating the need for manual data aggregation, allowing businesses to make informed decisions quickly.
Key Metrics and Performance Tracking
The dashboard provides real-time updates on the following key sales metrics:
- Net Sales: A precise calculation of sales after accounting for discounts, providing a true reflection of revenue.
- Discounts: Insights into how much discount is being given across different sales transactions and its impact on revenue.
- Sales by Product: Track the performance of each product, helping businesses identify top performers and areas of improvement.
- Sales by Region: Gain visibility into which regions are driving the most sales, enabling targeted sales strategies.
- Sales Rep Performance: Evaluate the effectiveness of each sales rep based on their total sales numbers, allowing for better sales management and accountability.
User-Friendly Interface
The dashboard has been designed with usability in mind. The layout is clean and intuitive, allowing even users with minimal Excel experience to navigate and utilize its full potential. The use of clearly labeled fields, charts, and slicers ensures that all users, regardless of their technical expertise, can benefit from this tool.
Time-Saving and Efficient
Ultimately, the Sales Tracking Dashboard is a tool designed to save time and increase efficiency. With automatic updates, interactive filtering, and easy-to-use data entry forms, businesses can track and report on sales with minimal effort. The tool’s back-end integration ensures that all data is correctly analyzed and presented in a digestible format, allowing businesses to focus on growth and strategy.
Conclusion
Whether you’re tracking sales, evaluating performance by region or product, or simply looking to generate reports quickly, the Sales Tracking Dashboard in Excel is the solution. It combines powerful visualizations, automation, and customizable features to make sales tracking easier and more efficient.
Click here to read the detailed blog post
After downloading and unzipping this file, ensure that macros are enabled before use. Refer to our below tutorial link for step-by-step instructions on enabling macros in Excel.
Visit our YouTube channel to learn step-by-step video tutorials


Reviews
There are no reviews yet.