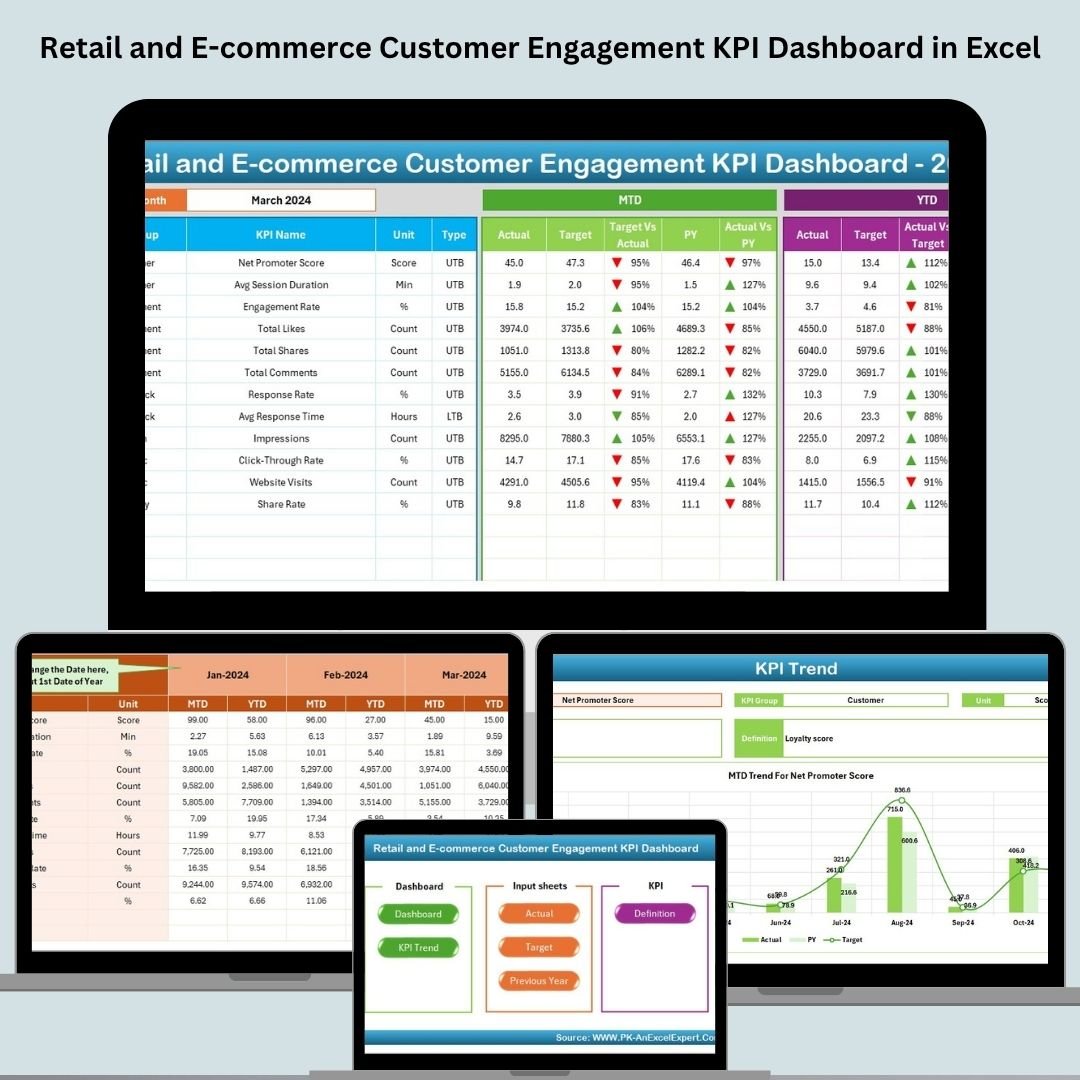

In the fast-paced world of retail and e-commerce, understanding your customers’ behavior is not optional—it’s the secret to success. That’s why we created the Retail and E-commerce Customer Engagement KPI Dashboard in Excel—a plug-and-play Excel template that helps you track, analyze, and improve your customer interaction strategies in real time.
Say goodbye to scattered spreadsheets and confusing data dumps. With this all-in-one dashboard, you get laser-sharp insights into performance metrics that matter—conversion rates, repeat purchases, cart abandonment, social media engagement, email click-throughs, and more.
Whether you’re a small online store or a large retail brand, this dashboard brings clarity, speed, and power to your engagement strategy—all inside the world’s most familiar tool: Microsoft Excel.
🔑 Key Features of Retail and E-commerce Customer Engagement KPI Dashboard
📊 All-in-One Excel Dashboard
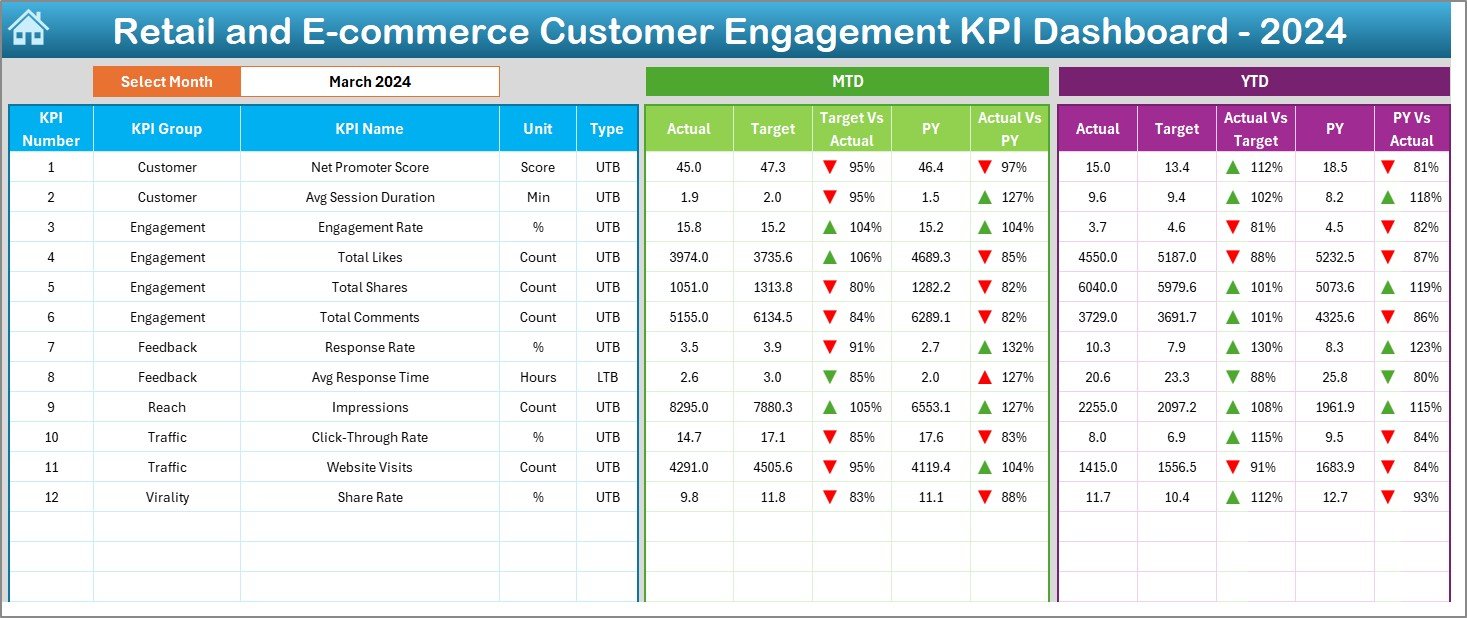
Track MTD (Month-to-Date), YTD (Year-to-Date), Actual, Target, and Previous Year performance—all from one central view.
📆 Month Selector
Choose any month from a drop-down in cell D3 and watch the entire dashboard update automatically.
🔄 Real-Time Variance Analysis
Spot gaps instantly with up/down arrow formatting between actual, target, and last year’s numbers.
📈 Dynamic Trend Charts
View trends over time for each KPI with smart visualizations for better pattern detection.
📌 Conditional Formatting
Instantly see which KPIs are underperforming—no guesswork needed.
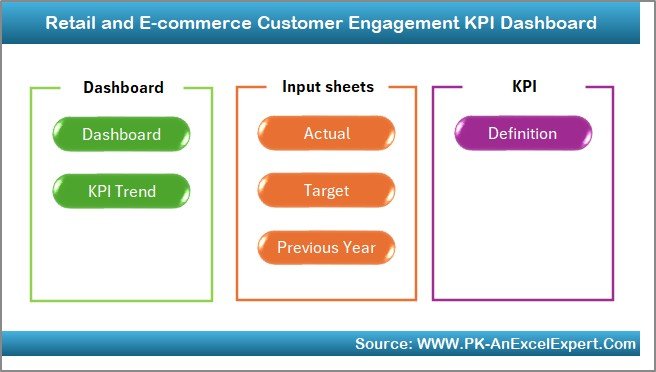
📦 What’s Inside the Dashboard?
You’ll receive an Excel file with 7 well-structured sheets:
-
Home Sheet – Navigation buttons to all pages
-
Dashboard Sheet – Your main control panel
-
KPI Trend Sheet – Drill into each KPI with trend analysis
-
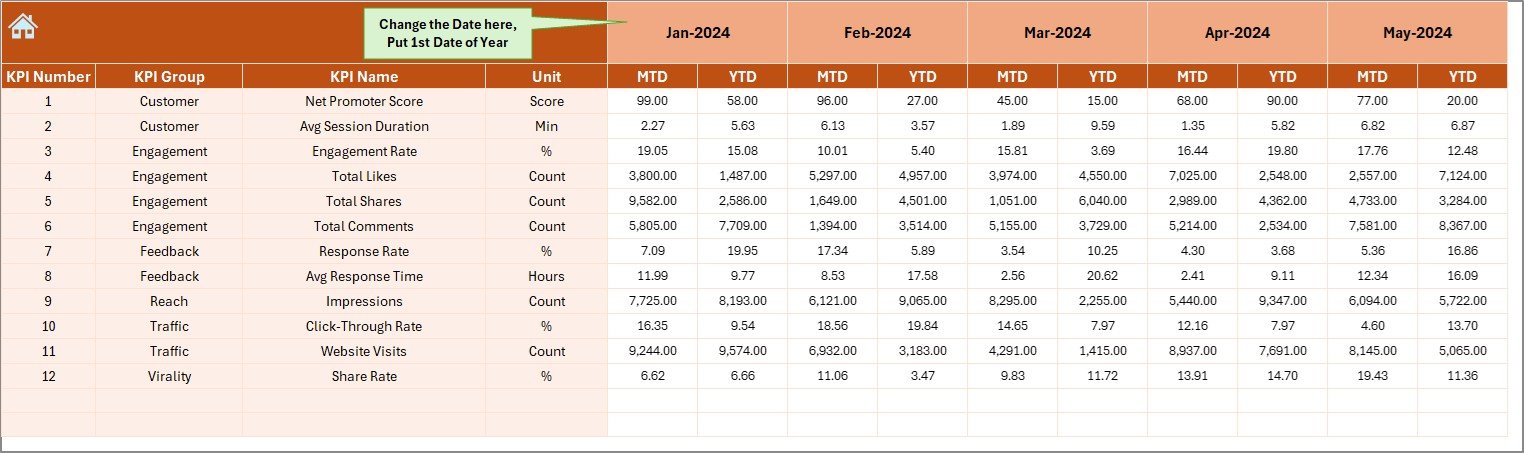
Actual Numbers Input Sheet – Enter live performance data
-
Target Sheet – Add your monthly and yearly targets
-
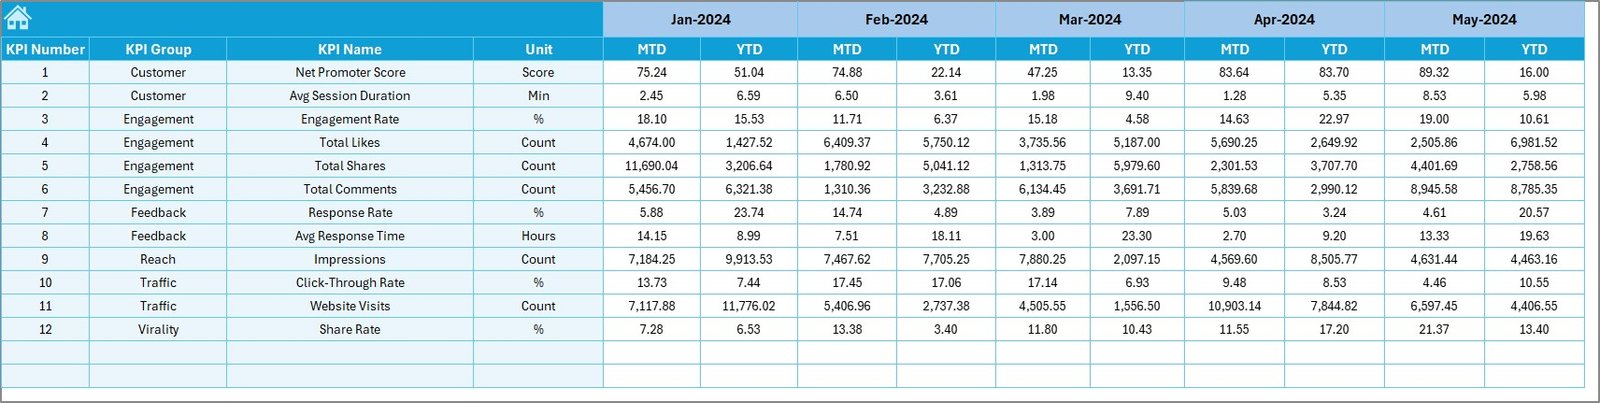
Previous Year Numbers – Enables YOY analysis
-
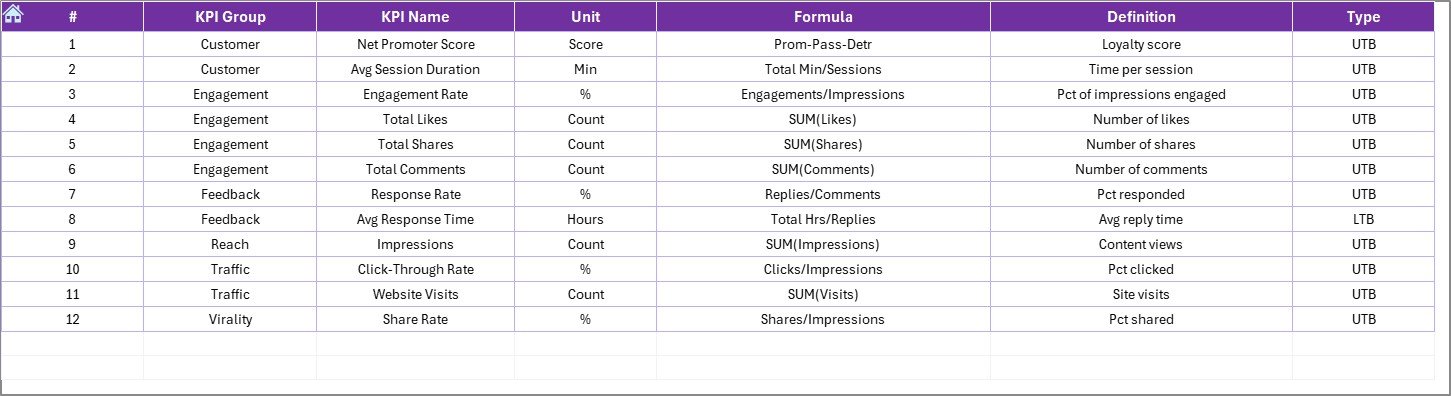
KPI Definition Sheet – All KPI formulas, types, and units explained
Each sheet is designed for clarity and ease of use. No clutter. No confusion. Just clean, actionable data.
🧩 How to Use the Dashboard
✅ Step 1 – Enter your actuals in the “Actual Numbers Input Sheet”
✅ Step 2 – Add your monthly goals in the “Target Sheet”
✅ Step 3 – Fill in last year’s numbers for benchmarking
✅ Step 4 – Select the month from the dropdown on Dashboard Sheet
✅ Step 5 – View insights, adjust strategy, repeat!
Everything updates dynamically based on your selections—no formulas to touch.
👤 Who Can Benefit from This Dashboard?
💼 E-commerce Business Owners – Understand what’s working in your funnel and what’s not
📧 Digital Marketers – Monitor email engagement, open rates, and conversions
📦 Retail Managers – Track customer satisfaction and purchase behavior
📊 Marketing Analysts – Get reliable trend data to guide campaign strategy
📈 Customer Success Teams – Use metrics to personalize service and drive loyalty
🛍️ Small Business Owners – Simplify data tracking without complex tools
If you’re managing a business and care about customer retention, this dashboard is your best friend.
🔗 Click here to read the Detailed blog post
🔗 Visit our YouTube channel to learn step-by-step video tutorials


Reviews
There are no reviews yet.