When deadlines slip and KPIs are missed, customer satisfaction suffers. That’s why the Customer Service and Support Project Timeline KPI Dashboard in Excel is your must-have tool to gain control, boost accountability, and deliver on time—every time.
This fully interactive Excel template is built for managers, support teams, and business leaders who need to monitor project timelines, measure service KPIs, and stay aligned with organizational goals. From real-time dashboards to trend analysis and year-over-year performance, this tool transforms your Excel into a full-service performance cockpit.
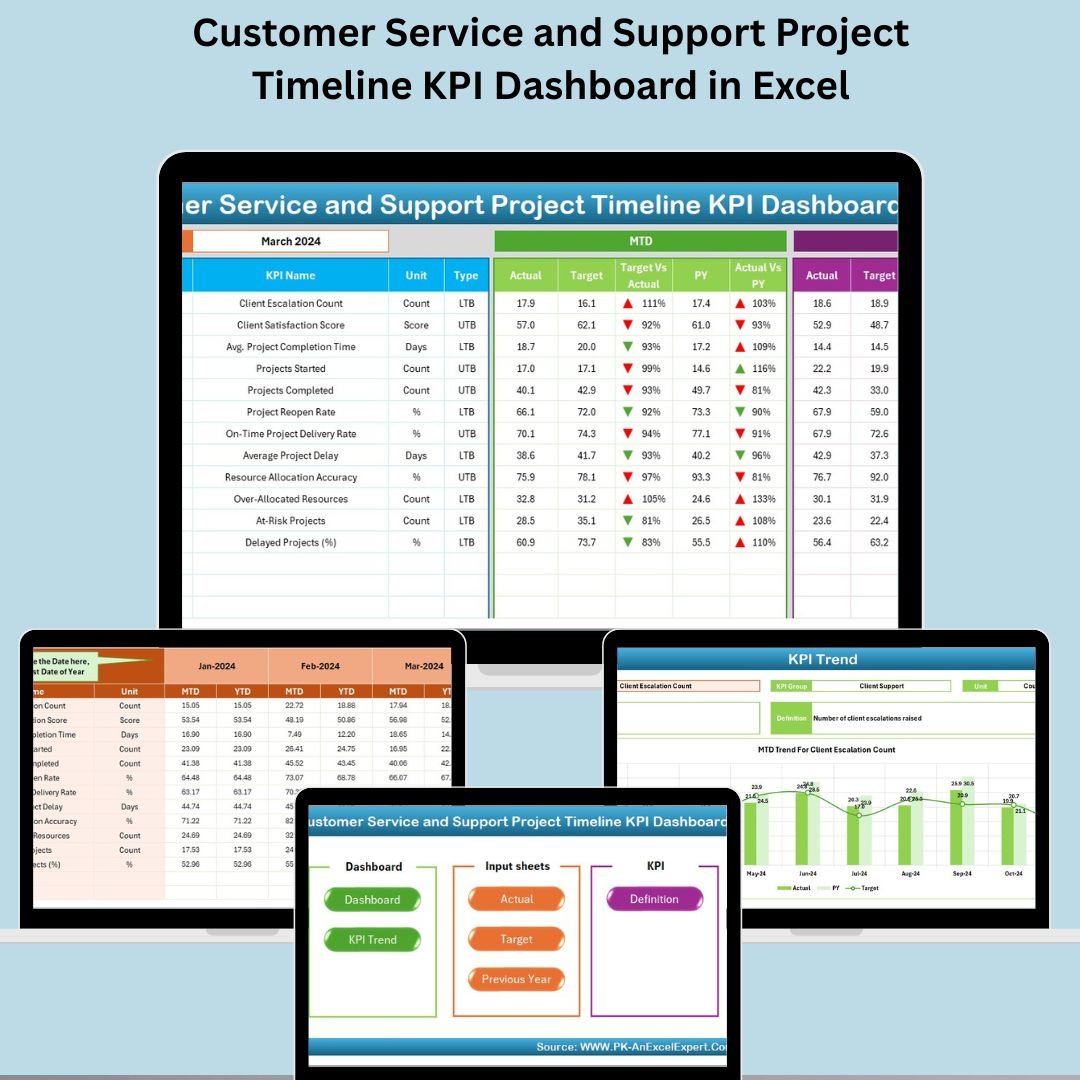
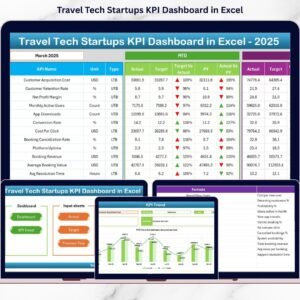
✨ Key Features of Customer Service and Support Project Timeline KPI Dashboard in Excel
🏠 Centralized Home Sheet

Navigate between worksheets effortlessly with six smart navigation buttons—no digging through tabs required.
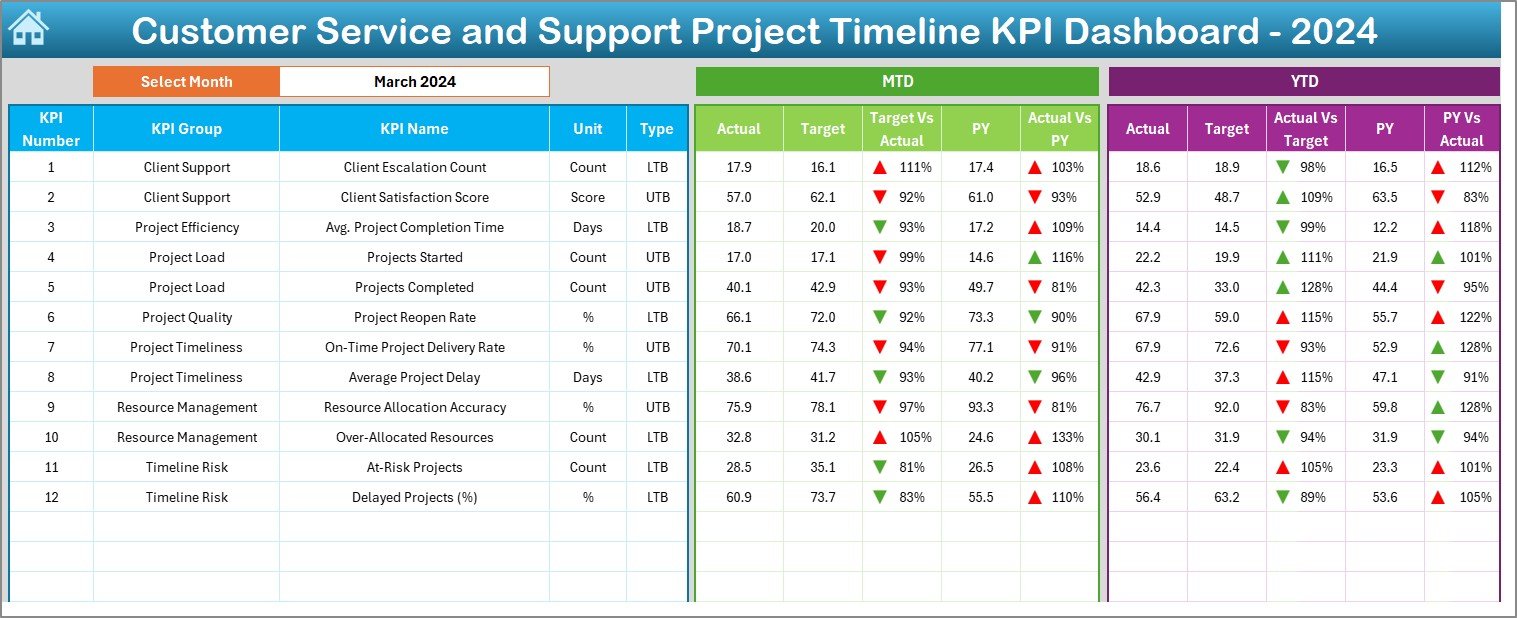
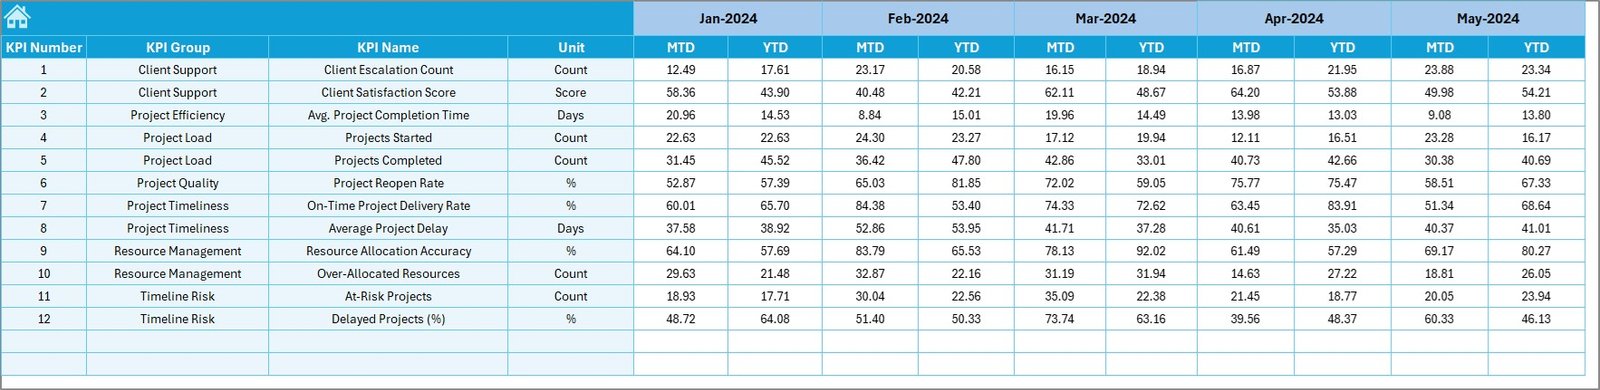
📊 Dynamic Dashboard Sheet
Track performance for the selected month (via dropdown in cell D3). Includes:
-
MTD & YTD KPIs
-
Actual vs. Target & Actual vs. Previous Year
-
Visual arrows to indicate trend direction (up/down, color-coded)
Get an executive-level snapshot in seconds.
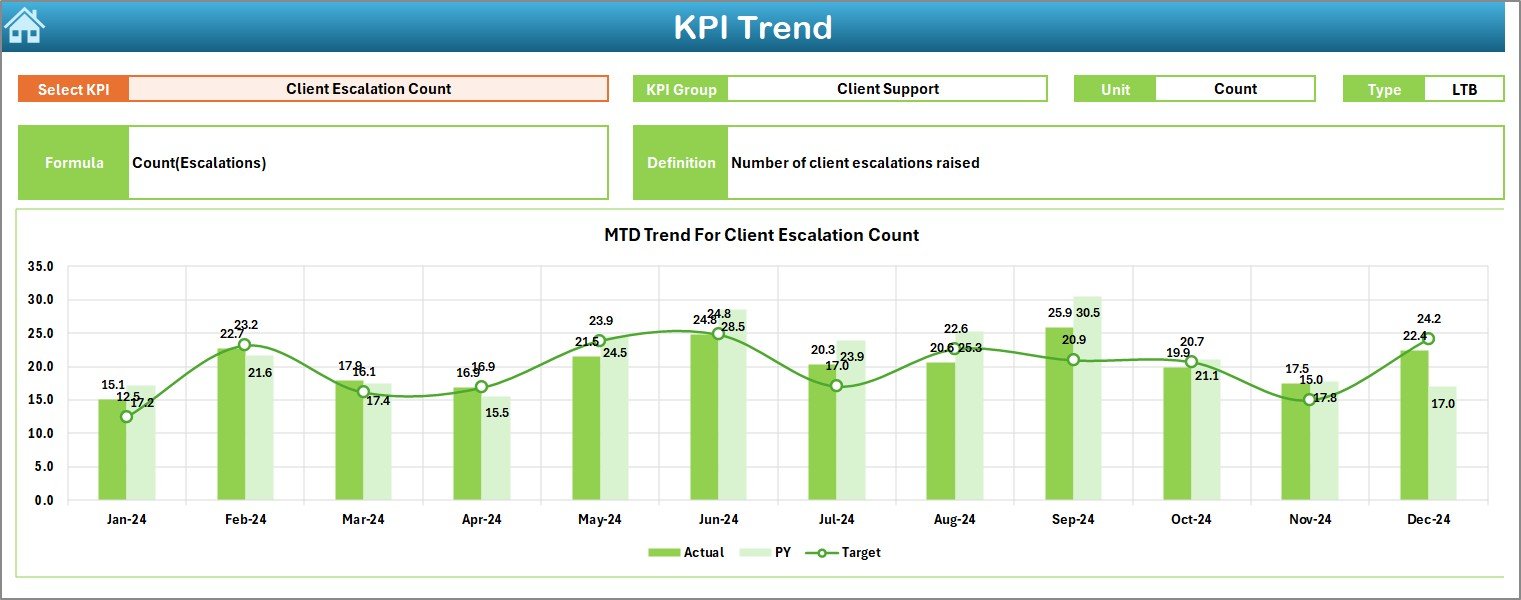
📈 KPI Trend Sheet
Select any KPI and visualize:
-
Monthly MTD & YTD performance
-
Trends compared with Target and Previous Year
-
Automatically generated line charts
Perfect for identifying patterns and performance dips.
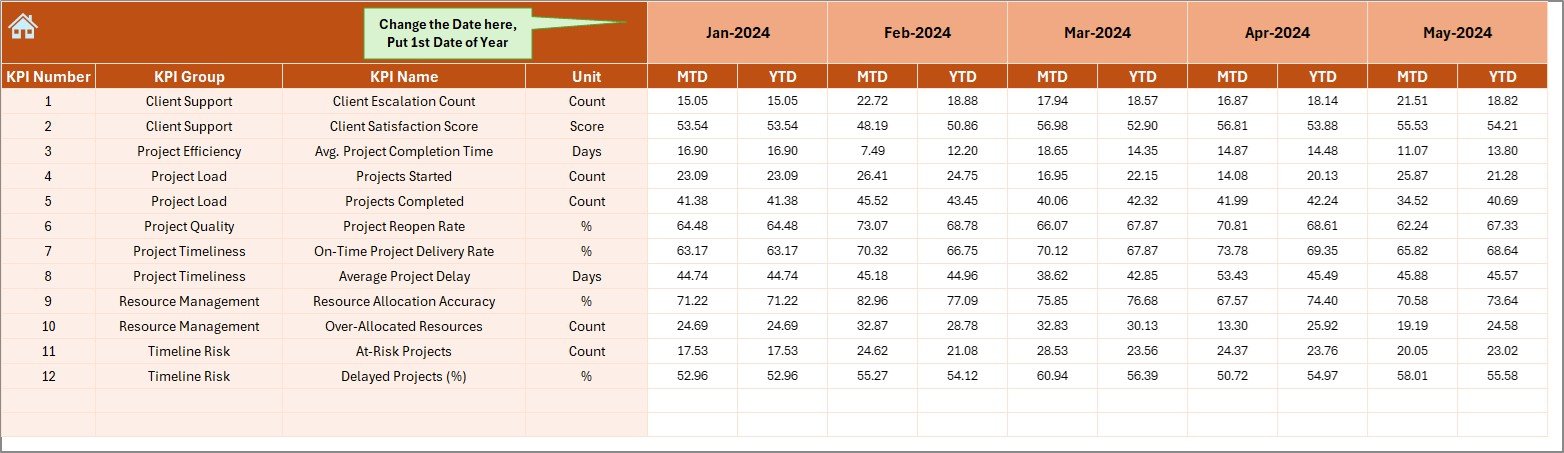
🧾 Actual Numbers Input
Easily enter your MTD/YTD numbers per month. Define your fiscal start month (cell E1) and track data effortlessly.
🎯 Target Sheet
Set monthly KPI goals for MTD and YTD. These targets drive dashboard visuals and help you measure gaps.
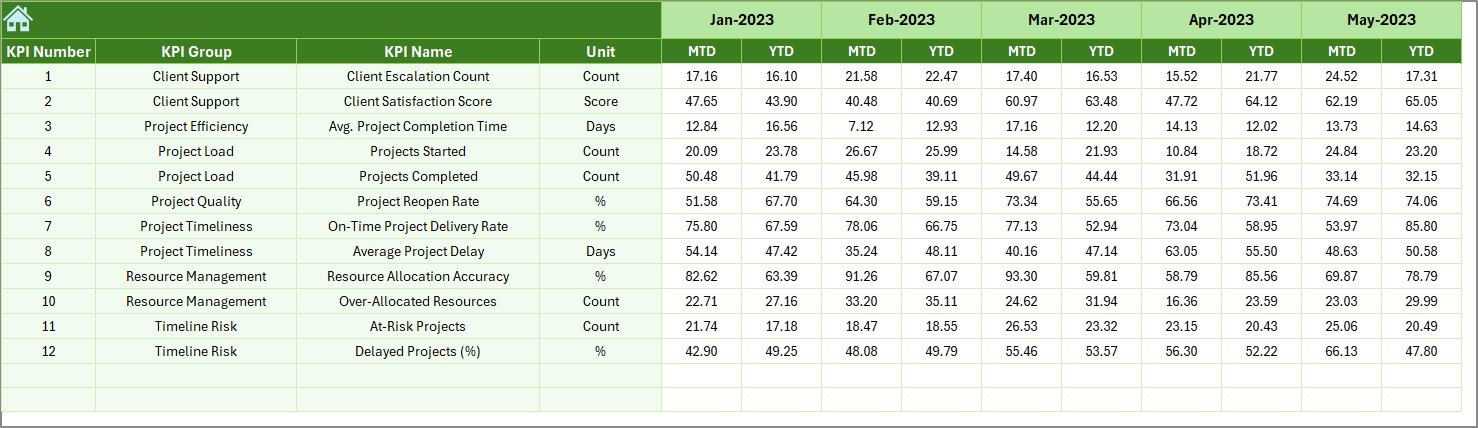
📅 Previous Year Number Sheet
Benchmark performance against historical data—ideal for YoY (Year-over-Year) analysis and decision-making.
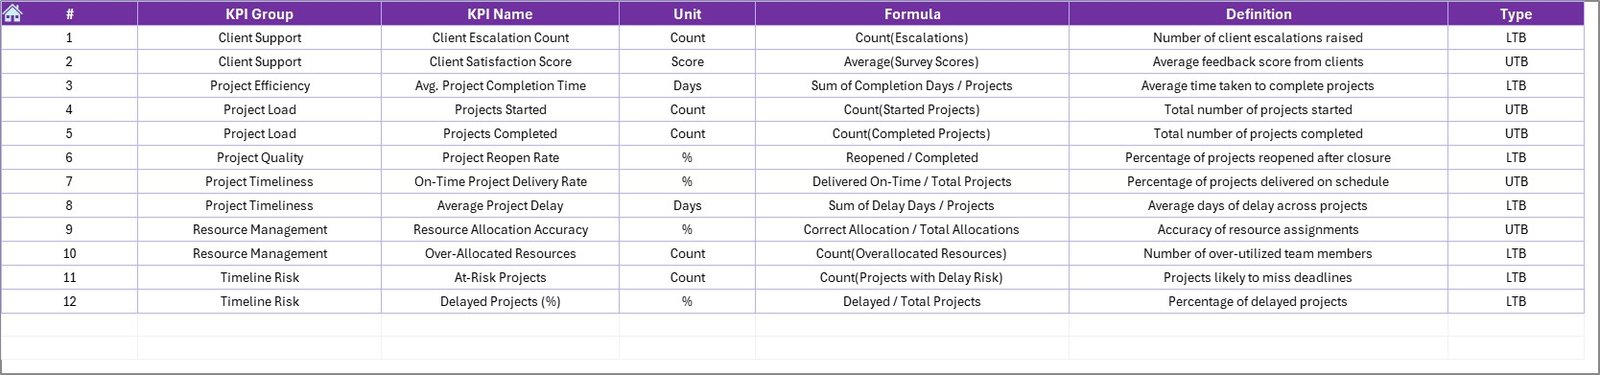
📘 KPI Definition Sheet
Create a universal KPI dictionary for your team. Fields include:
-
KPI Name & Group
-
Unit of Measure
-
Formula
-
Definition
-
Type (UTB or LTB)
This ensures consistent tracking and alignment across teams.
📂 What’s Inside the Dashboard?
This Excel-based dashboard includes 7 structured worksheet tabs:
-
Home Sheet – Quick access to all key tabs
-
Dashboard Sheet – Real-time KPI analysis
-
KPI Trend Sheet – Visual insights for every KPI
-
Actual Numbers Input – Enter current performance data
-
Target Sheet – Set monthly KPI goals
-
Previous Year Numbers – Compare against last year
-
KPI Definition Sheet – Document your KPIs in one place
No macros. No complicated coding. 100% Excel-based with plug-and-play functionality.
🛠️ How to Use the Dashboard
-
📘 Define KPIs in the KPI Definition Sheet
-
🎯 Set monthly targets in the Target Sheet
-
🗂️ Input Actuals in the Actual Numbers Sheet
-
📊 View performance in the Dashboard Sheet
-
📈 Use the KPI Trend Sheet for pattern spotting
-
🧮 Compare with Previous Year Numbers
-
🏁 Control all navigation from the Home Sheet
With drop-downs, charts, and formatting done for you—just enter the data and go!
👥 Who Can Benefit from This Dashboard?
-
👩💼 Customer Service Managers – Monitor agent KPIs and timelines
-
🧑💼 Support Team Leads – Track ticket resolution and SLA metrics
-
🧠 Business Analysts – Analyze support trends and reporting
-
🏢 Operations Teams – Align KPIs with project milestones
-
💼 Executives – Review performance across months and years
Ideal for telecom, SaaS, healthcare, e-commerce, and service-based industries.
🔗 Click here to read the Detailed blog post
🔗 Visit our YouTube channel to learn step-by-step video tutorials


Reviews
There are no reviews yet.