



The Multichannel Marketing KPI Dashboard in Excel is an essential tool designed to help marketing teams effectively monitor and analyze the performance of their campaigns across multiple channels. This dashboard consolidates key performance indicators (KPIs) from various marketing efforts into a single, easy-to-read view, empowering teams to make data-driven decisions and optimize marketing strategies.
By using this Excel-based template, organizations can track and analyze performance in real-time, assess trends, and focus their efforts on the most effective channels.

Key Features of the Multichannel Marketing KPI Dashboard in Excel
📊 Centralized Dashboard
Consolidated View: Track all your key marketing KPIs, from social media engagement to email campaign performance, in one place for a unified overview.
Easy-to-Read Visuals: Use charts, graphs, and tables to present your KPIs, making it easier to digest and interpret complex data.
📈 Customizable Metrics
Flexible KPI Tracking: Tailor the dashboard to focus on metrics that align with your specific marketing goals, such as conversion rates, return on investment (ROI), and customer acquisition costs (CAC).
Adjustable Channels: Add, remove, or modify the channels being tracked to suit your business model, whether you’re using paid ads, social media, email marketing, or any other marketing platform.
🔗 Data Integration
Seamless Data Import: Import data from various marketing platforms like Google Analytics, Facebook Ads, or email marketing tools to keep your dashboard updated with real-time insights.
Automatic Updates: With simple integrations, ensure that your dashboard reflects the most up-to-date performance metrics without the need for manual input.
🔍 Performance Tracking & Analysis
Trend Analysis: Track KPIs over time and compare performance across different periods to measure the success of campaigns and identify trends.
Campaign Comparison: Analyze how different marketing campaigns perform relative to each other, helping you optimize for the best-performing channels.
💡 User-Friendly Interface
Easy-to-Use Template: The dashboard is designed to be intuitive, even for those without a background in data analytics. Quickly visualize key insights without being overwhelmed by complex tools.
Customizable Layouts: Modify the dashboard layout to fit your team’s needs, ensuring it serves as an efficient and effective tool for your marketing activities.
Benefits of Using the Multichannel Marketing KPI Dashboard in Excel
✅ Data-Driven Decision Making
By consolidating key marketing metrics into one easy-to-use dashboard, teams can make informed decisions based on real-time data, leading to improved marketing strategies and better results.
✅ Improved ROI
Track the effectiveness of your marketing spend across different channels, enabling you to optimize resource allocation and maximize return on investment (ROI).
✅ Increased Marketing Efficiency
Monitor multiple campaigns and channels simultaneously, allowing you to identify underperforming areas and take corrective action quickly.
✅ Cost-Effective Tool
The Google Sheets template offers a free, cost-effective solution for tracking and analyzing marketing performance, providing the same level of functionality as expensive software solutions.
Getting Started with Your Multichannel Marketing KPI Dashboard in Excel
Download the Template: Start by downloading the Multichannel Marketing KPI Dashboard template to begin tracking your marketing performance.
Customize Your KPIs: Tailor the dashboard to focus on the metrics that matter most to your business, whether it’s revenue, engagement, or lead generation.
Import Data: Connect your marketing platforms (like Google Ads, social media tools, or CRM systems) to keep the data flowing in real-time.
Monitor & Analyze: Regularly review the dashboard to monitor trends, track performance, and adjust your strategies accordingly.
Collaborate: Share the dashboard with your marketing team and stakeholders for better collaboration and alignment on goals.
By implementing the Multichannel Marketing KPI Dashboard in Excel, your organization can streamline its marketing efforts, improve decision-making, and drive higher campaign performance.
Click here to read the Detailed blog post
Multichannel Marketing KPI Dashboard in Excel
Visit our YouTube channel to learn step-by-step video tutorials
YouTube.com/@PKAnExcelExpert
Watch the step-by-step video Demo:
Compatibility and Requirements
- Works in Microsoft Excel desktop (Excel 2016 or later, or Microsoft 365).
- New to Excel dashboards? Microsoft’s guide Create a chart from start to finish covers the basics.
Who Uses This Dashboard
Marketing teams that run campaigns across social media, email, paid ads and other channels and want one view of the results.
Frequently Asked Questions
Which KPIs can I track?
Metrics such as social media engagement, email campaign performance, conversion rates, return on investment (ROI) and customer acquisition cost (CAC).
Can I change the channels?
Yes. Add, remove or modify the channels you track, such as paid ads, social media or email.
Can I bring in data from my marketing tools?
Yes. Import data from platforms such as Google Analytics, Facebook Ads or your email marketing tool.
Can I compare campaigns?
Yes. Compare how campaigns perform against each other and across periods.
Is there a Google Sheets version?
Yes. See the Multichannel Marketing KPI Dashboard in Google Sheets.
Related Marketing Templates
- Multichannel Marketing KPI Dashboard in Google Sheets: the same KPIs in Google Sheets
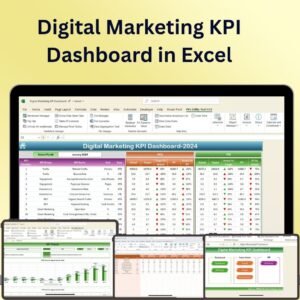
- Digital Marketing KPI Dashboard in Excel: digital marketing KPIs in Excel
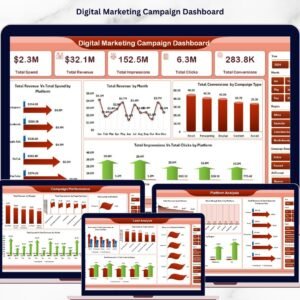
- Digital Marketing Campaign Dashboard in Excel: a full digital marketing campaign dashboard
- Marketing KPI Dashboard In Excel: general marketing KPIs in Excel
- Marketing and Social Media Analytics Kit: 7 marketing and social media templates
Browse all Excel KPI dashboards.























Reviews
There are no reviews yet.