The Recycling KPI Dashboard in Google Sheets is a comprehensive and user-friendly tool designed to help organizations monitor and evaluate their recycling efforts. Whether you’re managing municipal recycling programs, corporate sustainability initiatives, or community outreach projects, this dashboard provides a structured approach to visualize and analyze your recycling data.
Key Features:
-
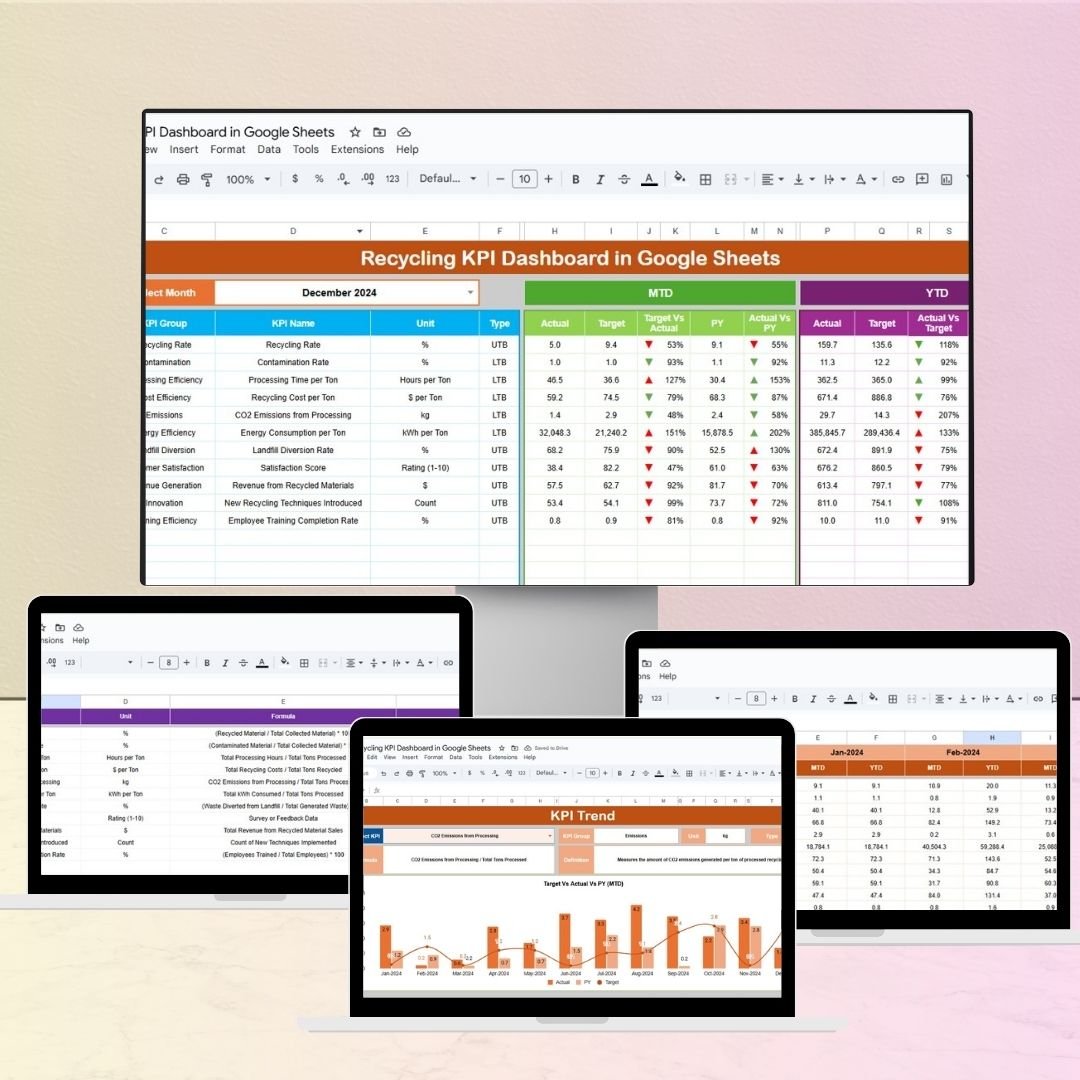
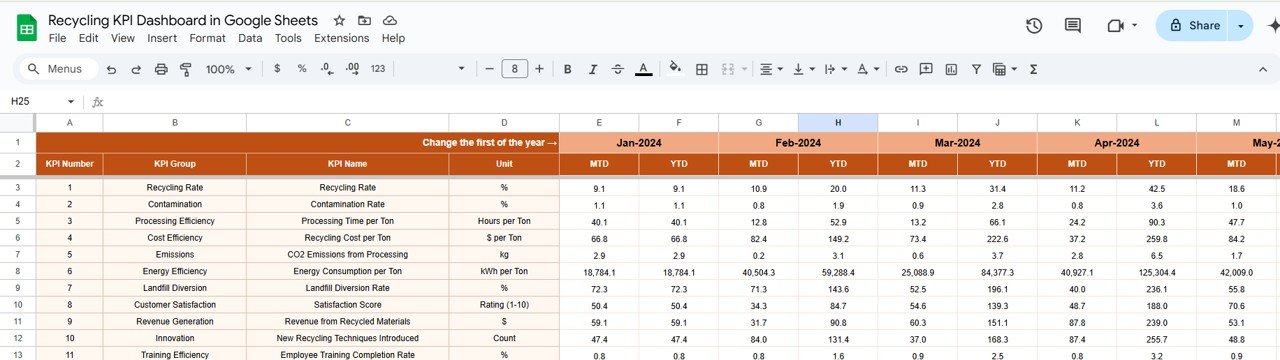
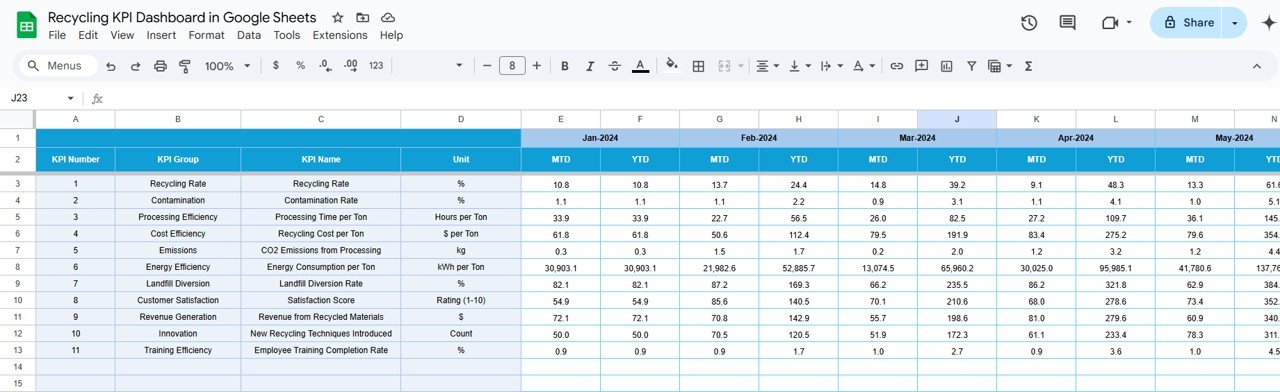
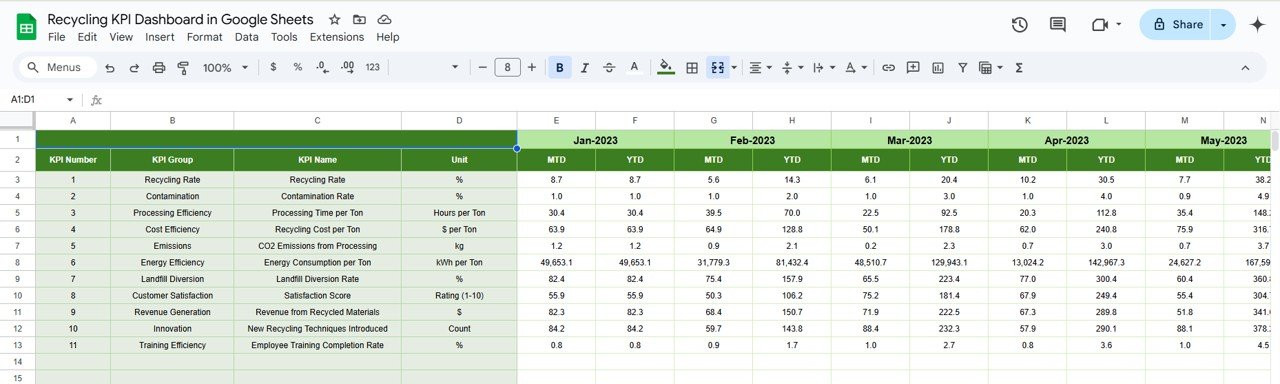
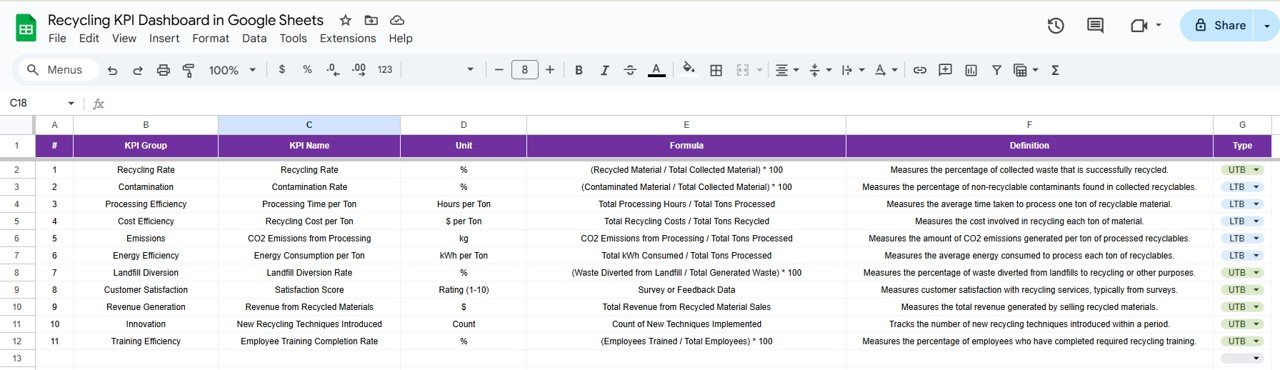
Customizable Metrics: Tailor the dashboard to your organization’s specific KPIs, such as total recyclables collected, recycling rates, contamination levels, and cost per ton recycled.
-
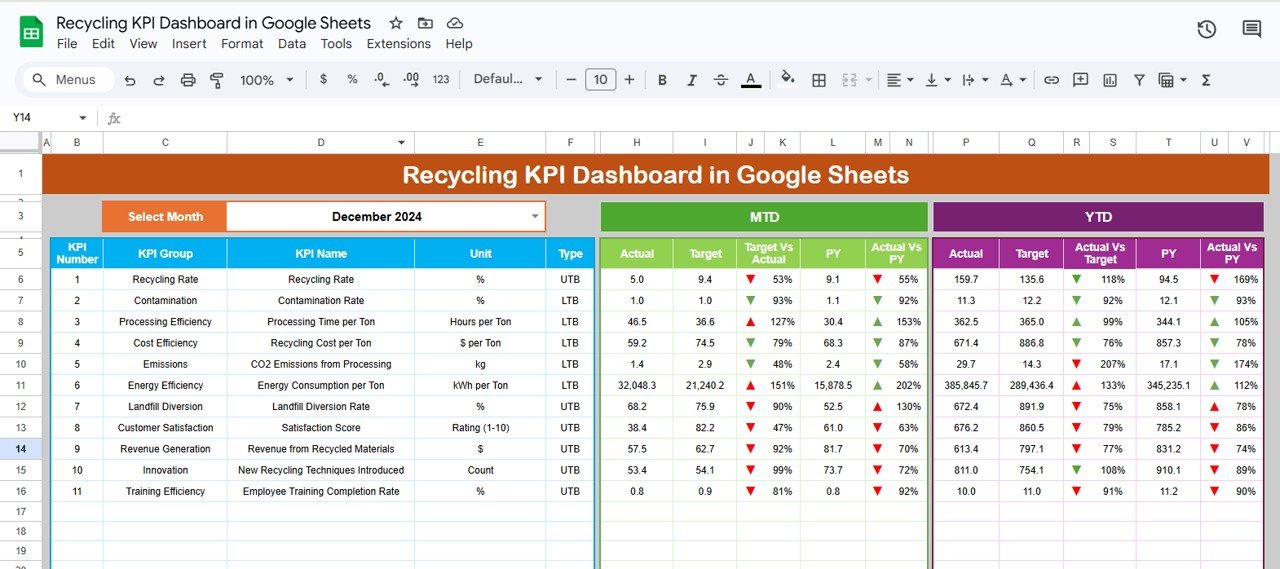
Real-Time Data Updates: Automatically refresh your data to ensure that your dashboard reflects the most current information, allowing for timely decision-making.
-
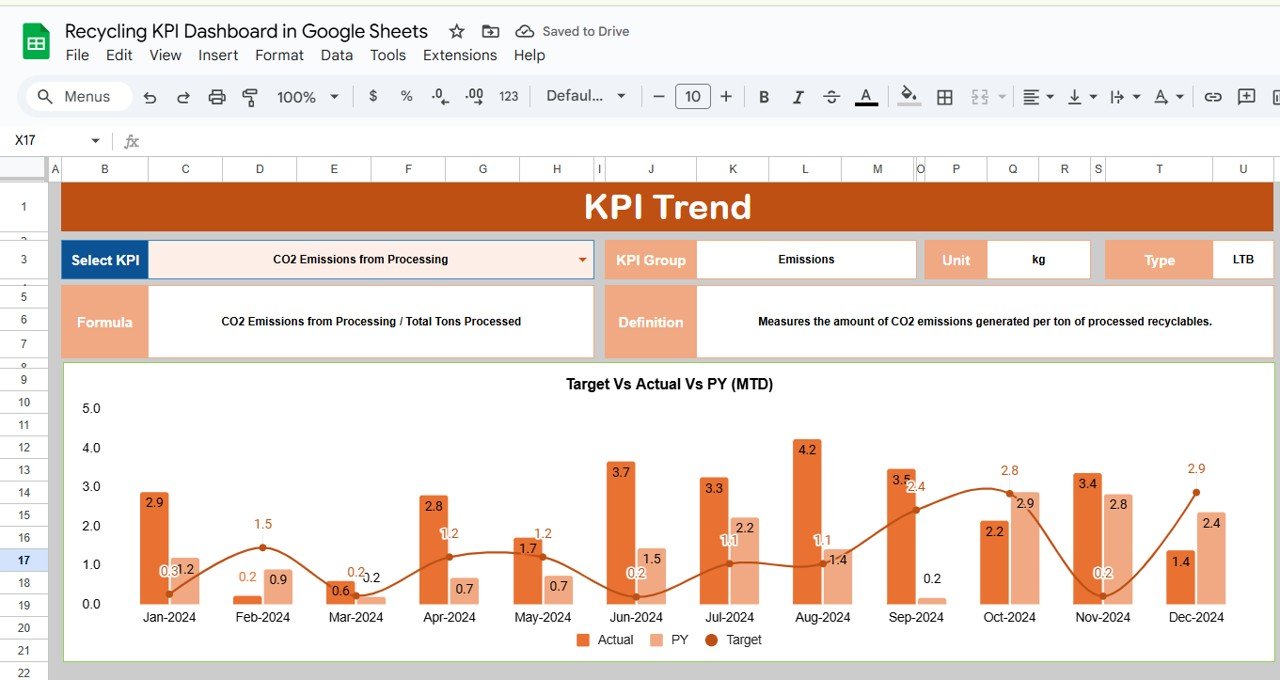
Interactive Visualizations: Utilize charts and graphs to present your data in an easily digestible format, facilitating quick insights and trend analysis.
-
User-Friendly Interface: Navigate through the dashboard with ease, thanks to its intuitive design and layout, making it accessible for users with varying levels of technical expertise.
-
Collaboration Tools: Share the dashboard with team members and stakeholders to foster transparency and collaborative decision-making.
Benefits:
-
Enhanced Decision-Making: With real-time data and visualizations, make informed decisions that can improve recycling practices and reduce costs.
-
Increased Accountability: Track progress towards your recycling goals and identify areas for improvement, promoting accountability within your organization.
-
Resource Optimization: By identifying trends and patterns, allocate resources more effectively to areas that require attention, ensuring optimal use of assets.
-
Regulatory Compliance: Stay compliant with environmental regulations by monitoring key metrics and ensuring that recycling practices meet required standards.
How to Use:
-
Access the Template: Open the provided Google Sheets template link.
-
Customize Metrics: Modify the existing metrics or add new ones that align with your organization’s goals.
-
Input Data: Regularly update the dashboard with your organization’s data to keep it current.
-
Analyze Trends: Use the visualizations to identify trends and make data-driven decisions.
-
Share Insights: Collaborate with team members and stakeholders by sharing the dashboard and discussing the insights gathered.
Who Can Benefit:
-
Municipalities: Manage city-wide recycling programs efficiently.
-
Recycling Companies: Monitor operational performance and identify areas for improvement.
-
Environmental Organizations: Track sustainability initiatives and report on progress towards environmental goals.
-
Regulatory Bodies: Ensure compliance with environmental standards and regulations.
By implementing the Recycling KPI Dashboard in Google Sheets, organizations can enhance their ability to monitor performance, make informed decisions, and ultimately improve the services they provide to the community.
Click here to read the Detailed blog post
Visit our YouTube channel to learn step-by-step video tutorials
Youtube.com/@PKAnExcelExpert


Reviews
There are no reviews yet.