

Railway cargo operations are the backbone of national and international supply chains. From bulk freight to containerized cargo, railway operators must manage volume, utilization, turnaround time, revenue, and service reliability with precision. Railway Cargo KPI Dashboard in Excel However, many organizations still depend on fragmented Excel files, manual calculations, and delayed reports. As a result, performance gaps remain unnoticed, and corrective actions come too late.
Railway Cargo KPI Dashboard in Excel That is exactly why the Railway Cargo KPI Dashboard in Excel becomes an essential performance management tool.
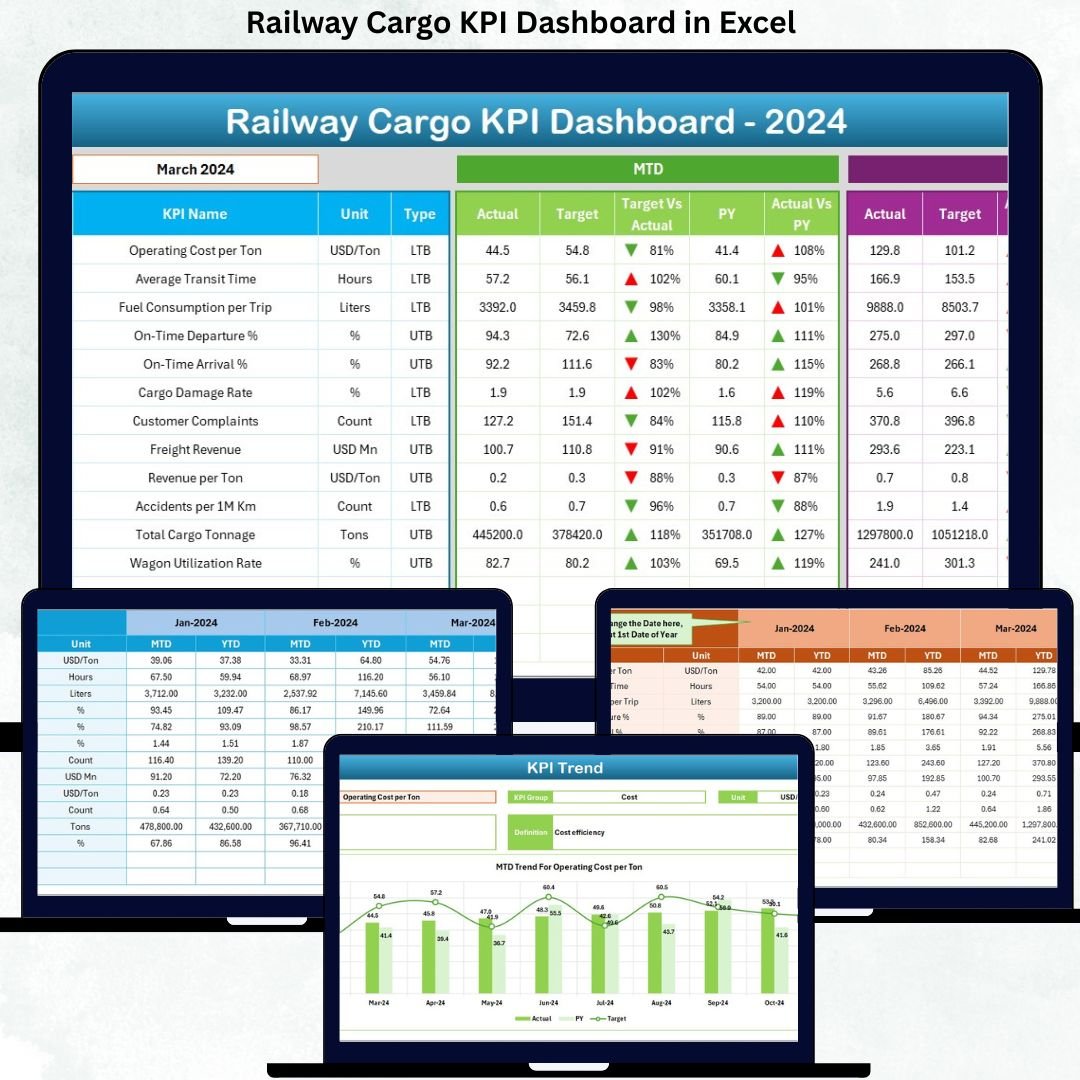
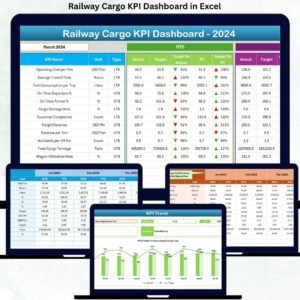
This ready-to-use dashboard helps railway cargo teams track, analyze, and improve operational performance using well-defined KPIs. Instead of juggling multiple sheets for actuals, targets, and previous-year data, everything is consolidated into one structured, interactive Excel dashboard.
Because it is built entirely in Excel, this dashboard remains easy to use, flexible, and accessible without any advanced BI tools. Even non-technical users can update data, analyze trends, and present insights confidently.
🚀 Key Features of Railway Cargo KPI Dashboard in Excel
✅ Centralized Cargo Performance Tracking – Monitor all cargo KPIs in one dashboard
✅ MTD & YTD Analysis – Track monthly and cumulative performance clearly
✅ Target vs Actual Comparison – Instantly identify gaps and underperformance
✅ Previous Year Comparison – Analyze year-over-year cargo trends
✅ Conditional Formatting with Arrows – Quickly spot positive and negative performance
✅ Interactive Month Selection – Change month once and update the entire dashboard
✅ KPI Trend Analysis – Visualize cargo performance over time
✅ 100% Excel-Based Solution – No Power BI or external tools required
📦 What’s Inside the Railway Cargo KPI Dashboard in Excel
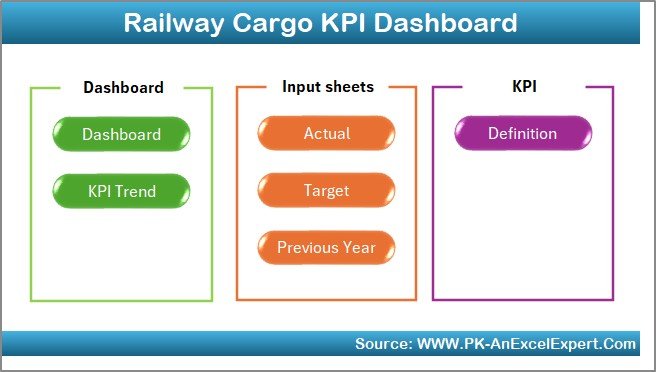
This digital product includes a professionally designed Excel workbook with 7 structured worksheets, each serving a clear purpose.
📊 Sheets Included
🏠 Home Sheet
Clean dashboard index
6 navigation buttons
One-click access to key sections
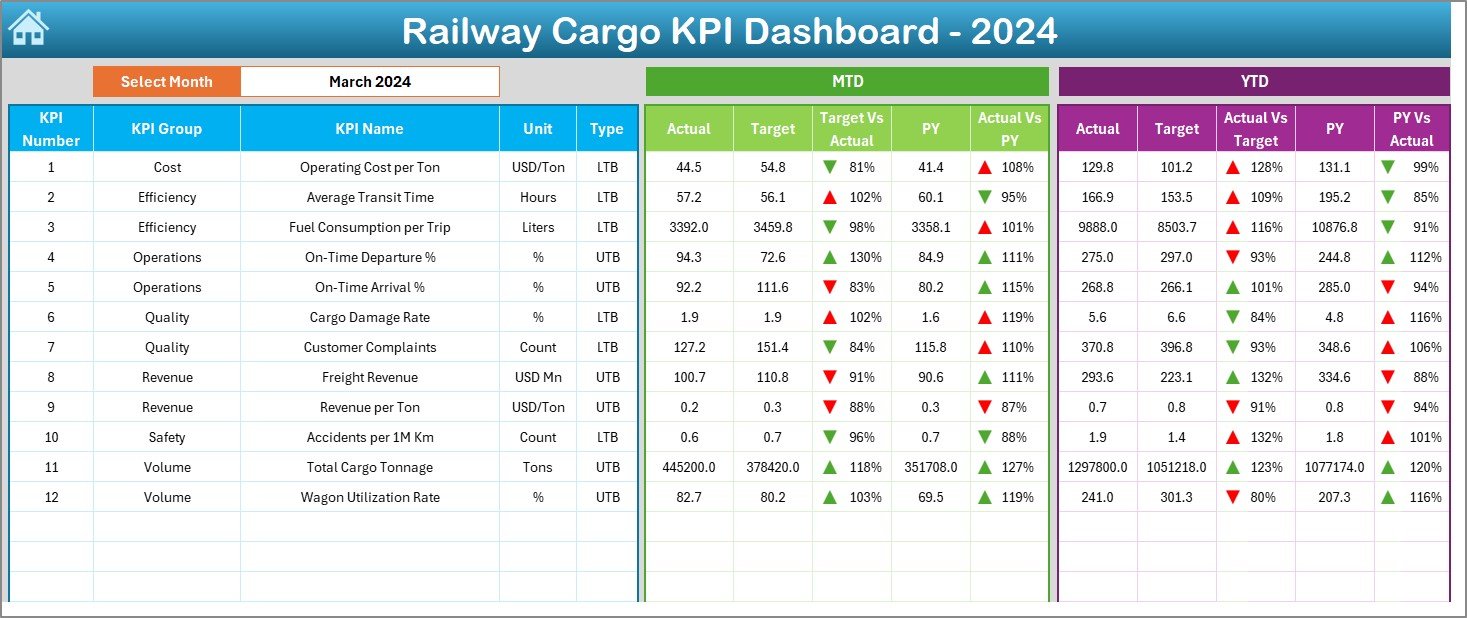
📈 Dashboard Sheet
Month selection in cell D3
MTD metrics: Actual, Target, Previous Year, variances
YTD metrics: Actual, Target, Previous Year, variances
Green ▲ and Red ▼ arrows for instant performance interpretation
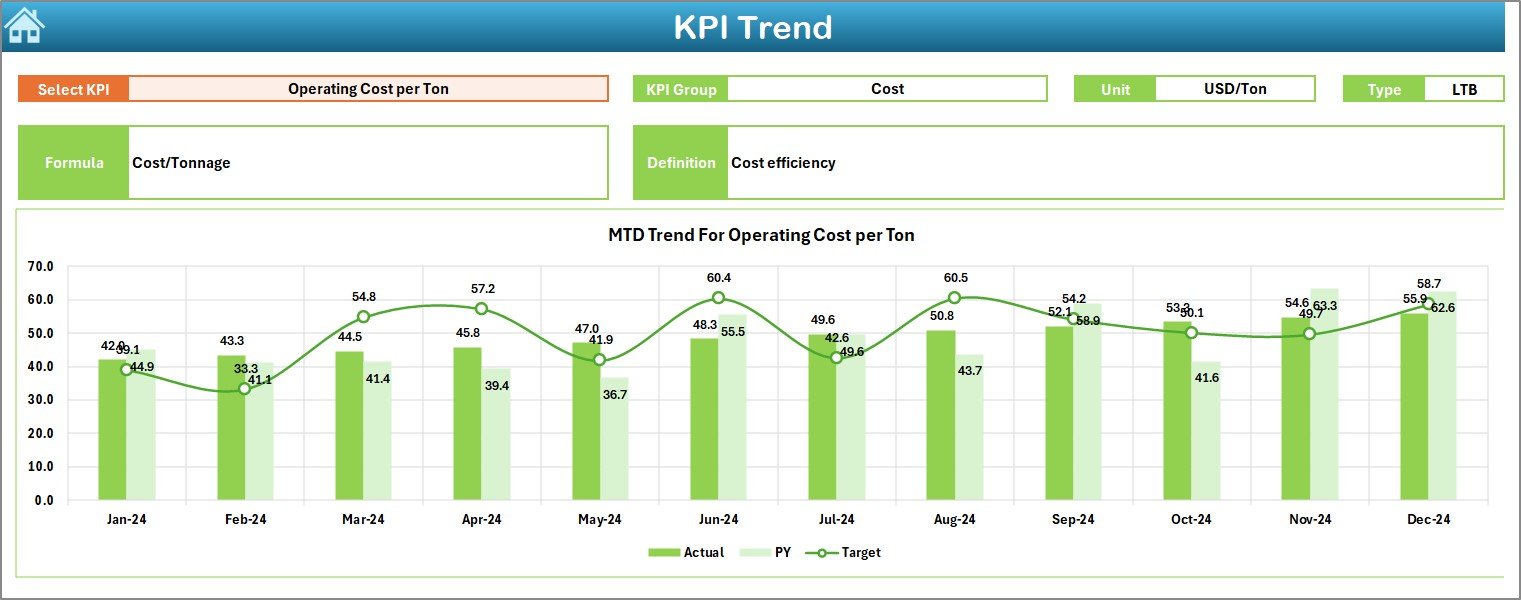
📉 KPI Trend Sheet
KPI selection in cell C3
KPI Group, Unit, Type, Formula, and Definition
MTD trend chart (Actual, Target, PY)
YTD trend chart (Actual, Target, PY)
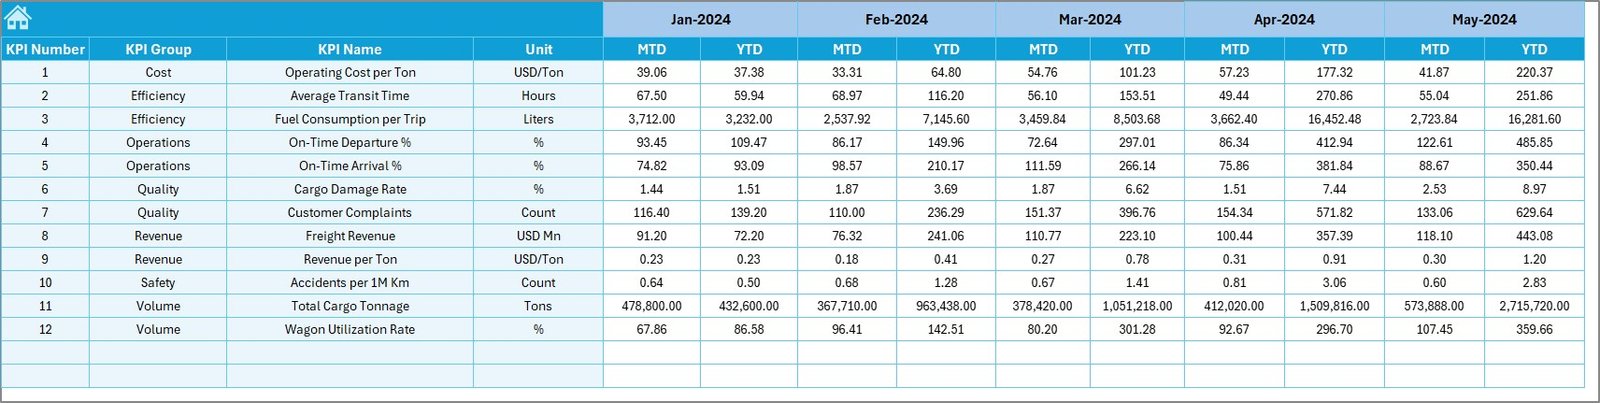
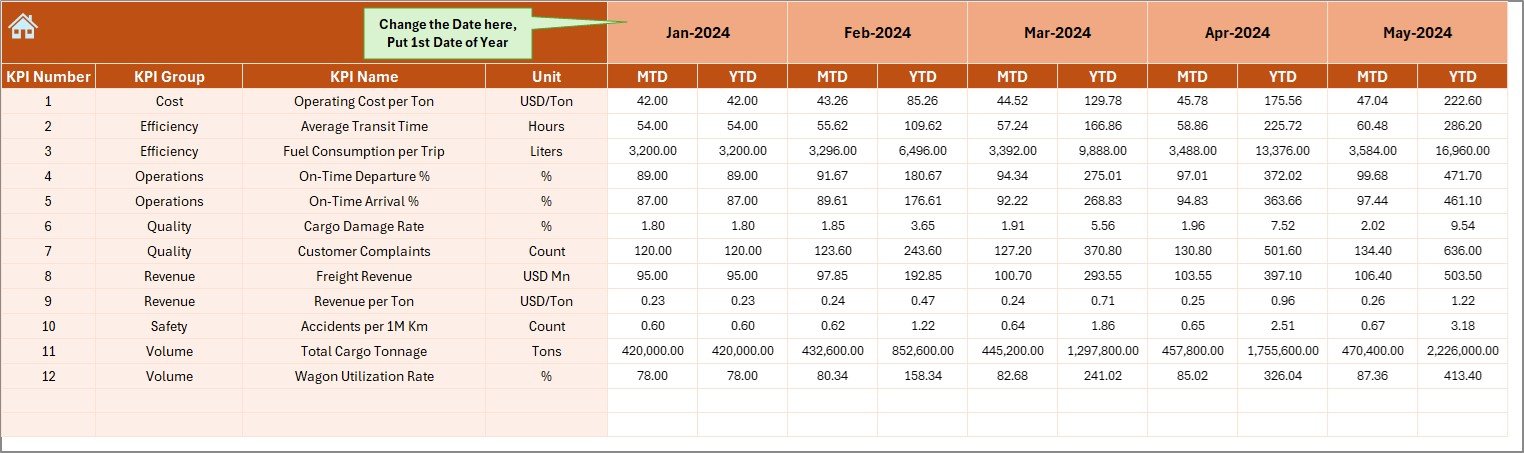
📥 Actual Numbers Input Sheet
Enter current-year MTD and YTD values
Month control via cell E1 for accurate YTD calculation
🎯 Target Sheet
KPI-wise MTD and YTD targets
Month-specific performance goals
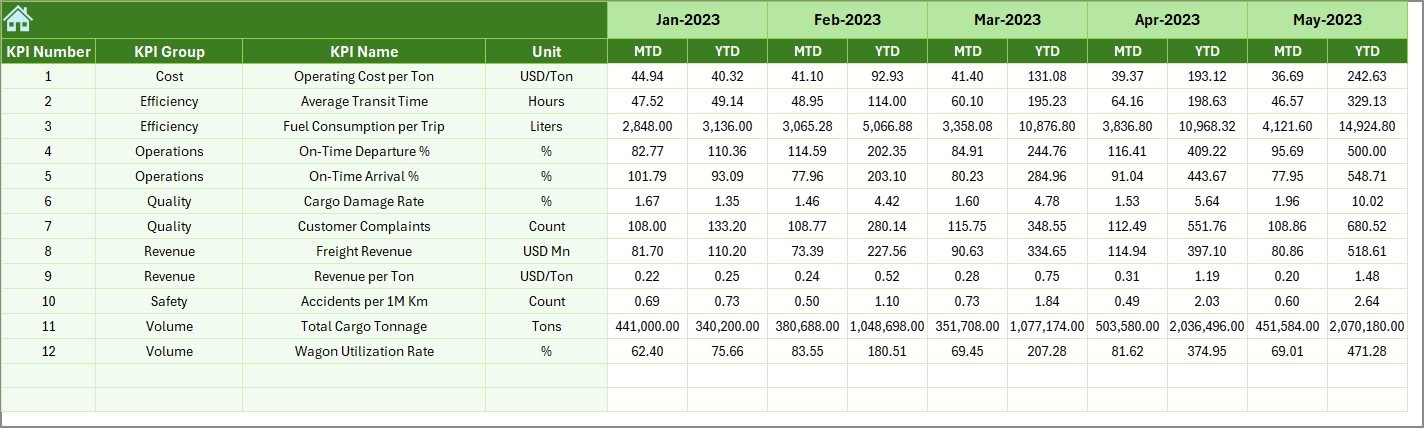
📅 Previous Year Number Sheet
Stores prior-year cargo data
Enables accurate year-over-year analysis
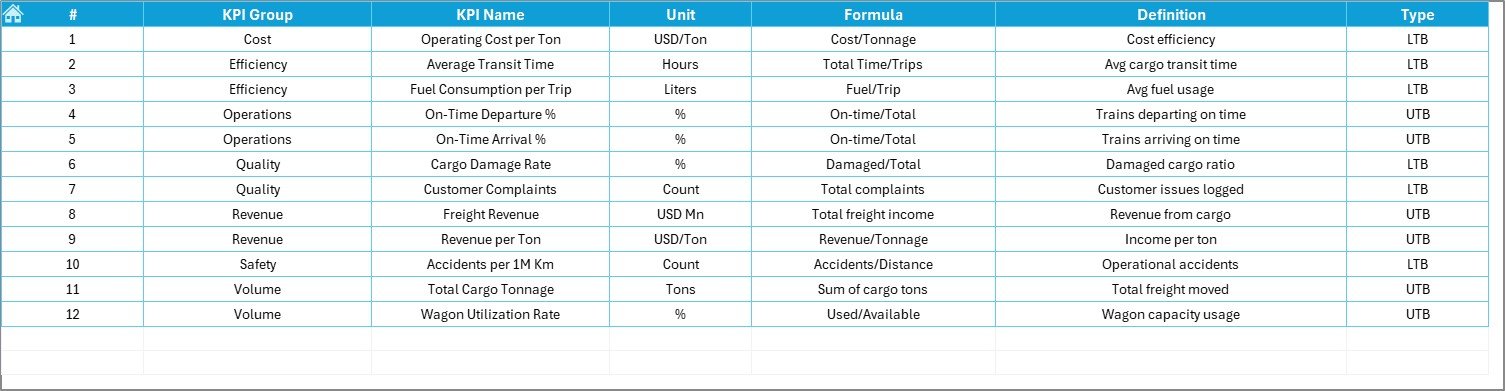
📘 KPI Definition Sheet
KPI Name, Group, Unit
Formula and Definition
Ensures clarity and standardization
🧭 How to Use the Railway Cargo KPI Dashboard in Excel
Using this dashboard is simple and efficient:
1️⃣ Define KPIs in the KPI Definition sheet
2️⃣ Enter actual cargo data in the Actual Numbers sheet
3️⃣ Update performance targets in the Target sheet
4️⃣ Enter previous-year data for comparison
5️⃣ Select the Month on the Dashboard sheet
6️⃣ Review MTD and YTD performance instantly
No complex formulas or advanced Excel skills are required.
👥 Who Can Benefit from This Railway Cargo KPI Dashboard in Excel
🚆 Railway Cargo Operations Teams – Monitor day-to-day performance
📦 Freight Planning Departments – Improve utilization and planning
📊 Logistics & Supply Chain Managers – Track cargo flow and efficiency
📈 Performance Analysts – Analyze trends and variances
🏢 Senior Management – Make fast, data-driven decisions
This dashboard works for small, medium, and large railway cargo networks.
📖 Click here to read the Detailed blog post
📺 Visit our YouTube channel to learn step-by-step video tutorials
👉 YouTube.com/@PKAnExcelExpert






















Reviews
There are no reviews yet.