
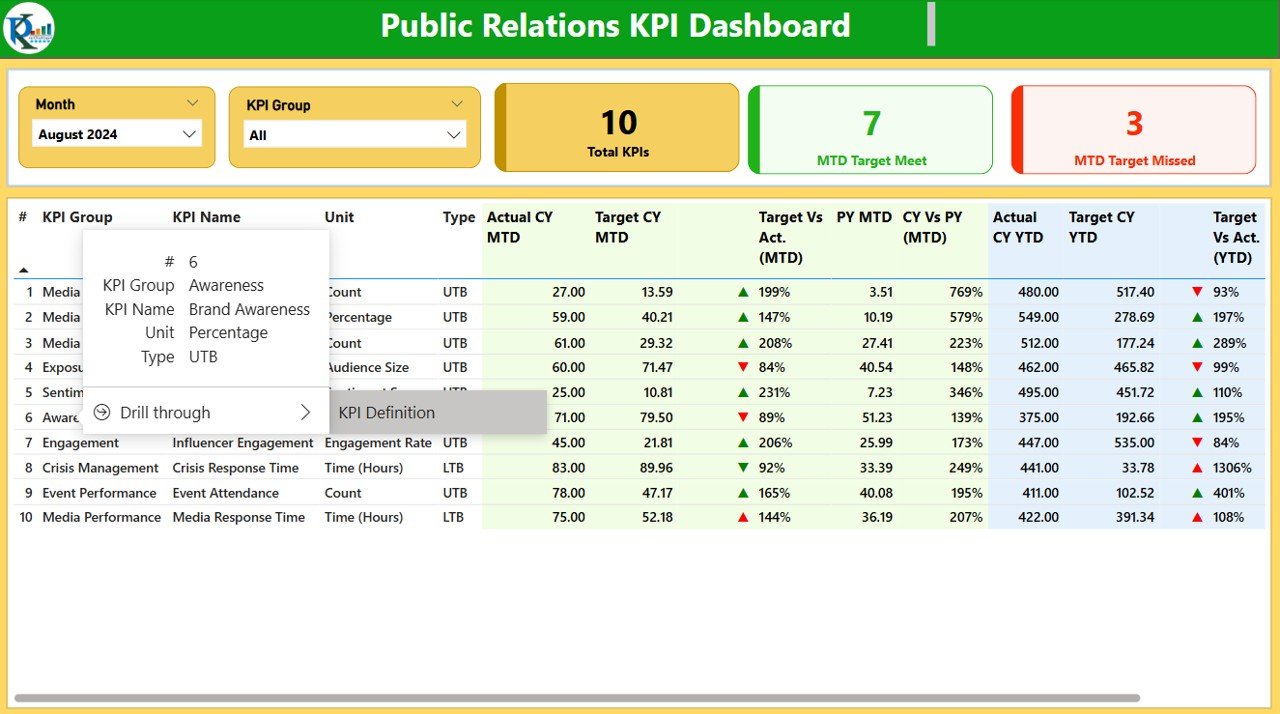

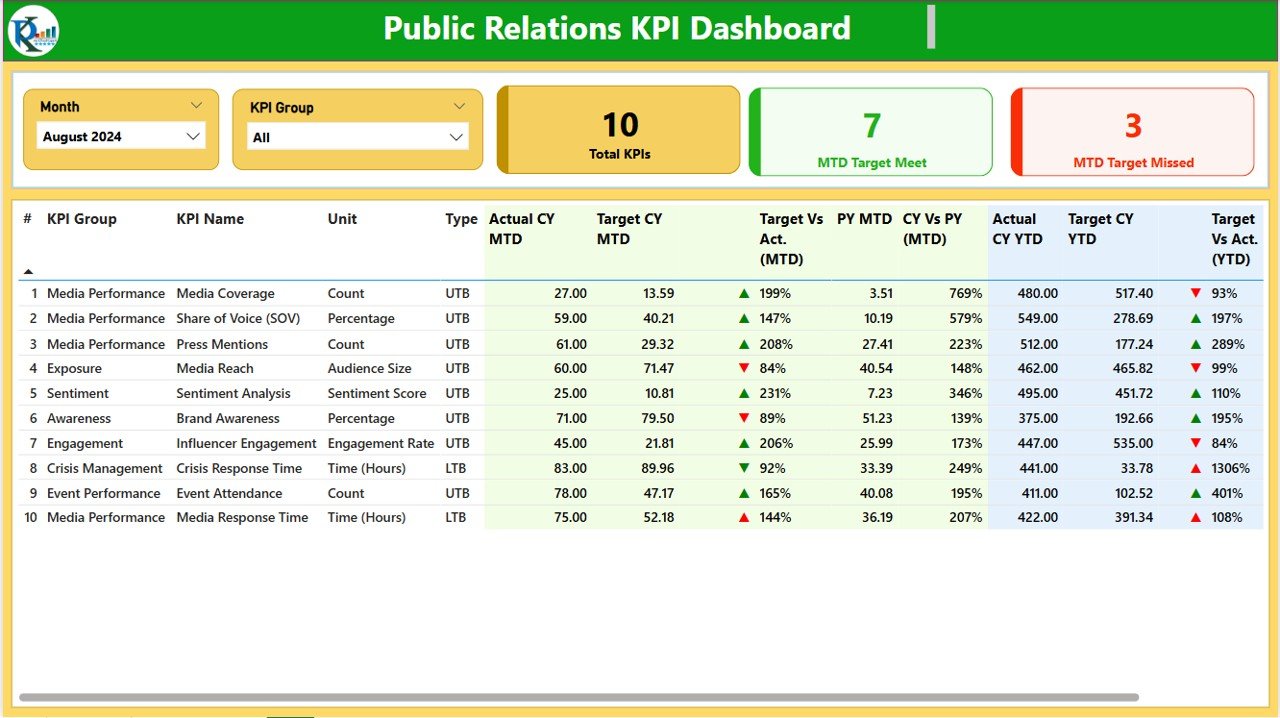
The Public Relations KPI Dashboard in Power BI is an essential tool for PR managers, communications teams, and business executives looking to measure and optimize the effectiveness of their public relations campaigns. This powerful Power BI dashboard helps you track key performance indicators (KPIs) such as media coverage, brand sentiment, social media engagement, and public perception, all in one central platform.
This dynamic dashboard integrates data from multiple sources and visualizes your PR metrics in real time, giving you clear insights into how your campaigns are performing. Whether you’re analyzing the success of press releases, measuring the impact of media outreach, or tracking social media mentions, this dashboard will help you stay on top of your PR strategy and drive results.
Key Features of the Public Relations KPI Dashboard in Power BI
📊 Media Coverage Tracking
Monitor your media coverage across various platforms, including news outlets, blogs, and social media. Track the number of mentions, the tone of the coverage (positive, negative, or neutral), and the reach of each piece of media content.
📈 Brand Sentiment Analysis
Track public perception and sentiment about your brand. Measure how positive or negative public opinions are based on media coverage, social media interactions, and customer feedback.
📱 Social Media Engagement Monitoring
Track social media interactions, including likes, shares, comments, and mentions across platforms like Twitter, Facebook, Instagram, and LinkedIn. Measure engagement rates and identify trends in audience interaction.
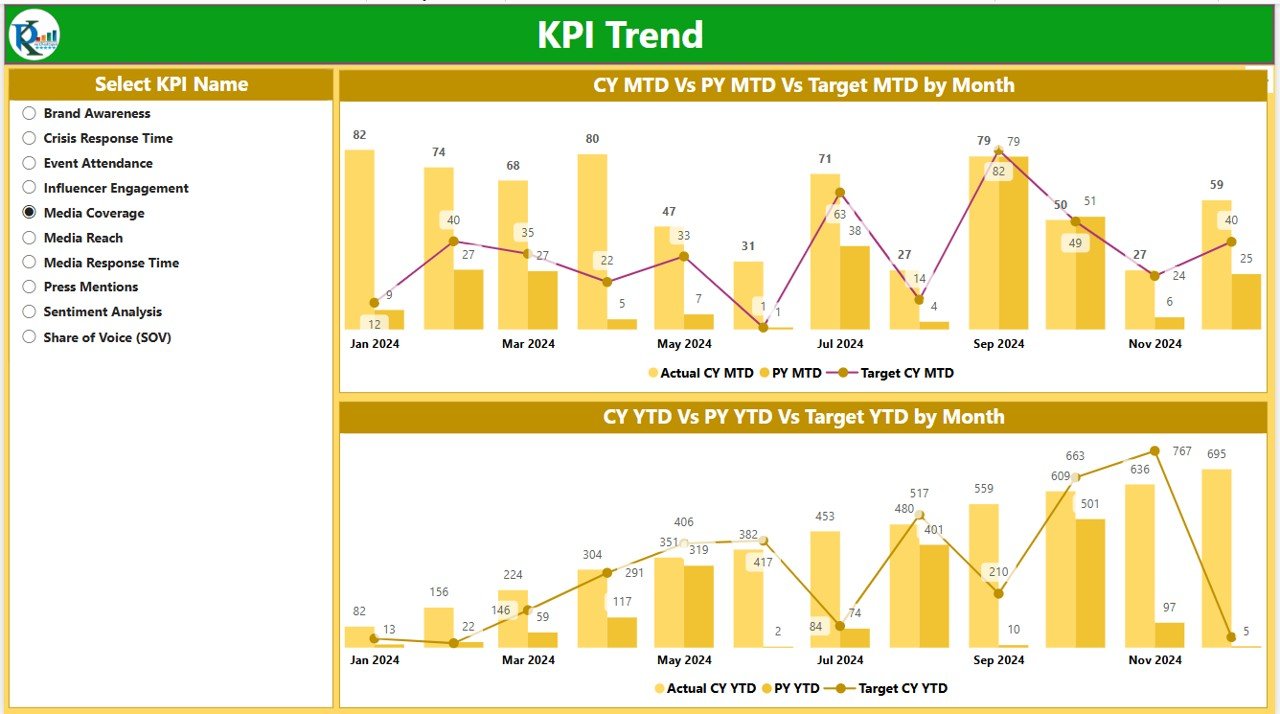
📅 Campaign Performance Over Time
Analyze your PR campaign performance over time, comparing results from various periods. Track how media coverage, sentiment, and engagement evolve during and after campaign periods.
🔄 Real-Time Data Integration
Integrate data from multiple sources in real time, including media outlets, social media platforms, and public opinion surveys, to get accurate and up-to-date insights into your PR campaigns.
⚙️ Customizable Dashboards
Tailor the dashboard to reflect the specific KPIs that matter most to your organization. You can add or remove data sources, update the visuals, and customize the metrics tracked based on your business needs.
Why You’ll Love the Public Relations KPI Dashboard in Power BI
✅ Comprehensive PR Monitoring
Track all aspects of your public relations campaigns in one place—from media coverage to social media engagement. Get a 360-degree view of how your PR efforts are performing.
✅ Data-Driven Decision Making
Make informed decisions based on real-time data. Use the insights from the dashboard to refine your PR strategies, optimize media outreach, and improve public perception.
✅ Measure Campaign Effectiveness
Easily assess the effectiveness of your PR campaigns and activities. Track the success of press releases, events, and media partnerships to identify what works and what needs improvement.
✅ Boost Brand Awareness & Engagement
Monitor how your PR efforts impact brand awareness and engagement with your audience. Measure how well your PR initiatives resonate with the public and foster positive interactions.
✅ Customizable for Any PR Strategy
Whether you’re a small business, a large corporation, or a PR agency, the dashboard is fully customizable to suit your specific needs. Track the KPIs that matter most to your PR strategy.
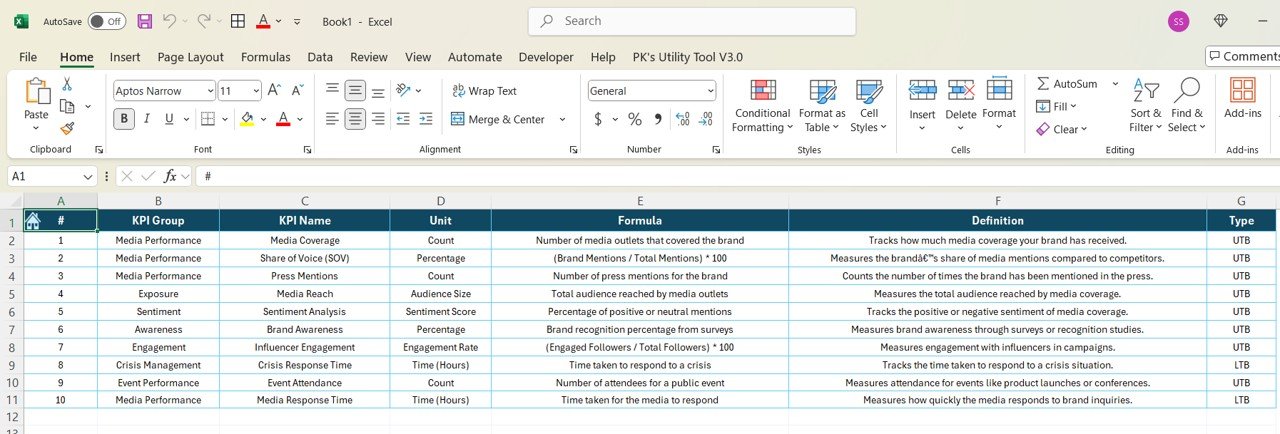
What’s Inside the Public Relations KPI Dashboard in Power BI?
-
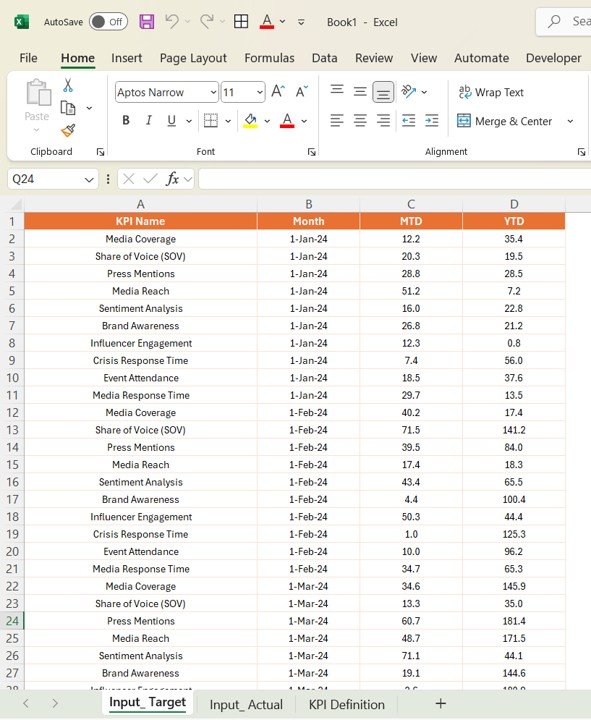
Media Coverage Tracking: Monitor the reach and tone of media mentions.
-
Brand Sentiment Analysis: Measure how the public perceives your brand.
-
Social Media Engagement: Track interactions on social media platforms.
-
Campaign Performance Over Time: Compare results from different campaign periods.
-
Real-Time Data Integration: Integrate data from various sources for accurate insights.
-
Customizable Dashboards: Tailor the dashboard to your PR objectives.
How to Use the Public Relations KPI Dashboard in Power BI
1️⃣ Download the Template: Get the Public Relations KPI Dashboard in Power BI instantly.
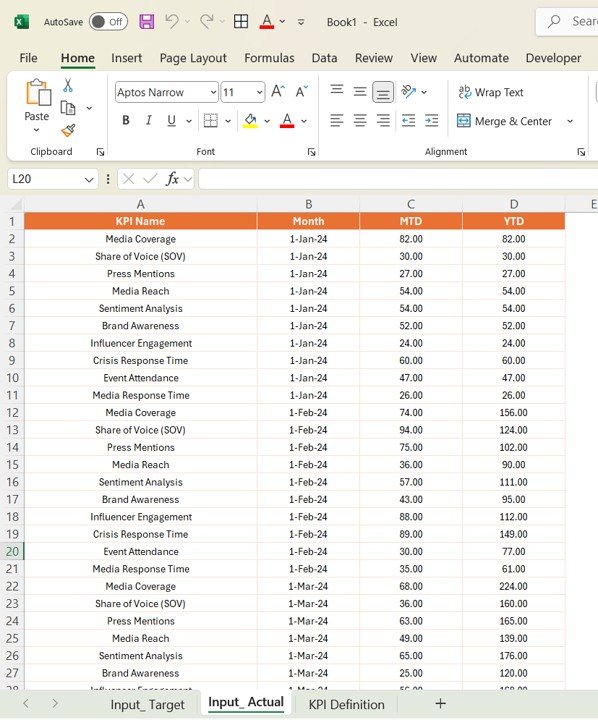
2️⃣ Integrate Data Sources: Link your media outlets, social media platforms, and customer feedback tools to the dashboard.
3️⃣ Monitor KPIs & Campaign Performance: Track media coverage, sentiment, and engagement in real time.
4️⃣ Analyze Trends Over Time: Use time-based analysis to evaluate your PR campaigns’ performance and impact.
5️⃣ Optimize Your PR Strategy: Use the insights to fine-tune your PR efforts and improve brand visibility and engagement.
Who Can Benefit from the Public Relations KPI Dashboard in Power BI?
🔹 PR & Communications Teams
🔹 Marketing & Brand Managers
🔹 Media Relations Specialists
🔹 Social Media Managers
🔹 Business Executives & Decision-Makers
🔹 Public Relations Agencies
🔹 Non-Profit Organizations & Government Agencies
Enhance your PR campaigns with the Public Relations KPI Dashboard in Power BI. Track media coverage, measure public sentiment, and optimize your social media engagement for better results.
Click here to read the Detailed blog post
Visit our YouTube channel to learn step-by-step video tutorials
Youtube.com/@PKAnExcelExpert


Reviews
There are no reviews yet.